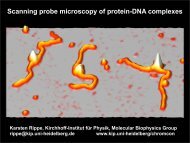
Human ISWI chromatin-remodeling complexes sample ...
Human ISWI chromatin-remodeling complexes sample ...
Human ISWI chromatin-remodeling complexes sample ...

Create successful ePaper yourself
Turn your PDF publications into a flip-book with our unique Google optimized e-Paper software.
Snf2H-GFP<br />
GFP-Snf2L<br />
GFP-Snf2L+13<br />
Remodeler<br />
G phase<br />
S phase<br />
DNA damage<br />
G phase<br />
S phase<br />
DNA damage<br />
G phase<br />
S phase<br />
DNA damage<br />
PCNA-RFP<br />
5 µm<br />
5 µm<br />
5 µm<br />
GFP bleach curve<br />
1.6<br />
1.4<br />
1.2<br />
no immobile fraction<br />
1.0<br />
1.6<br />
1.4<br />
~ 70 % immobile<br />
1.2<br />
1.0<br />
1.6<br />
1.4<br />
~ 60 % immobile<br />
1.2<br />
1.0<br />
1.6<br />
1.4<br />
no immobile fraction<br />
~ 70 % immobile<br />
~ 40 % immobile<br />
no immobile fraction<br />
~ 70 % immobile<br />
~ 50 % immobile<br />
1.2<br />
1.0<br />
1.6<br />
1.4<br />
1.2<br />
1.0<br />
2.5<br />
2.0<br />
1.5<br />
1.0<br />
1.6<br />
1.4<br />
1.2<br />
1.0<br />
1.6<br />
1.4<br />
1.2<br />
1.0<br />
2.5<br />
2.0<br />
1.5<br />
1.0<br />
5 10 time (s)<br />
Stable U2OS lines expressing one GFP-tagged remodeler variant<br />
were used to measure the expression level of the endogenous<br />
remodelers. The concentrations of GFP-tagged remodelers were<br />
determined by FCS experiments (Table S1). Subsequently, quantitative<br />
Western blotting was used to measure the ratio of endogenous<br />
remodelers relative to the GFP-tagged ones (Fig. S2). The<br />
expression levels of Snf2H-GFP and GFP-Snf2L+13 were about<br />
twofold higher than those of the corresponding endogenous proteins,<br />
whereas endogenous Snf2L was not detectable in the U2OS<br />
cell line. From the combined FCS/Western blot analysis endogenous<br />
protein concentrations of 0.83 ± 0.13 μM (Snf2H), >0.15 ±<br />
0.03 μM (hACF complex formed by Snf2H and Acf1),