Human ISWI chromatin-remodeling complexes sample ...
Human ISWI chromatin-remodeling complexes sample ...
Human ISWI chromatin-remodeling complexes sample ...

You also want an ePaper? Increase the reach of your titles
YUMPU automatically turns print PDFs into web optimized ePapers that Google loves.
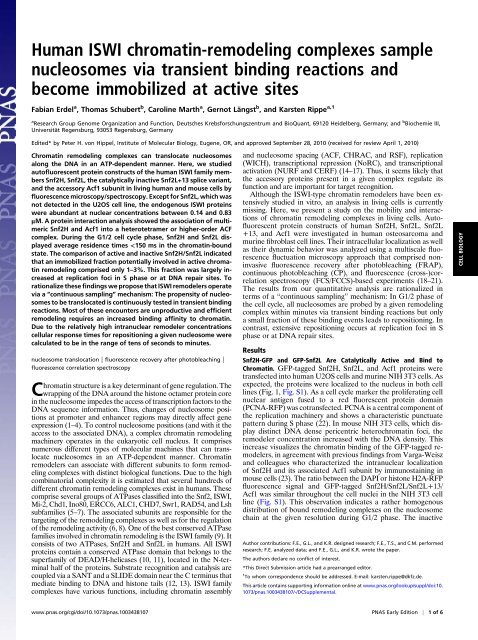
<strong>Human</strong> <strong>ISWI</strong> <strong>chromatin</strong>-<strong>remodeling</strong> <strong>complexes</strong> <strong>sample</strong><br />
nucleosomes via transient binding reactions and<br />
become immobilized at active sites<br />
Fabian Erdel a , Thomas Schubert b , Caroline Marth a , Gernot Längst b , and Karsten Rippe a,1<br />
a Research Group Genome Organization and Function, Deutsches Krebsforschungszentrum and BioQuant, 69120 Heidelberg, Germany; and b Biochemie III,<br />
Universität Regensburg, 93053 Regensburg, Germany<br />
Edited* by Peter H. von Hippel, Institute of Molecular Biology, Eugene, OR, and approved September 28, 2010 (received for review April 1, 2010)<br />
Chromatin <strong>remodeling</strong> <strong>complexes</strong> can translocate nucleosomes<br />
along the DNA in an ATP-dependent manner. Here, we studied<br />
autofluorescent protein constructs of the human <strong>ISWI</strong> family members<br />
Snf2H, Snf2L, the catalytically inactive Snf2L+13 splice variant,<br />
and the accessory Acf1 subunit in living human and mouse cells by<br />
fluorescence microscopy/spectroscopy. Except for Snf2L, which was<br />
not detected in the U2OS cell line, the endogenous <strong>ISWI</strong> proteins<br />
were abundant at nuclear concentrations between 0.14 and 0.83<br />
μM. A protein interaction analysis showed the association of multimeric<br />
Snf2H and Acf1 into a heterotetramer or higher-order ACF<br />
complex. During the G1/2 cell cycle phase, Snf2H and Snf2L displayed<br />
average residence times
Snf2H-GFP<br />
GFP-Snf2L<br />
GFP-Snf2L+13<br />
Remodeler<br />
G phase<br />
S phase<br />
DNA damage<br />
G phase<br />
S phase<br />
DNA damage<br />
G phase<br />
S phase<br />
DNA damage<br />
PCNA-RFP<br />
5 µm<br />
5 µm<br />
5 µm<br />
GFP bleach curve<br />
1.6<br />
1.4<br />
1.2<br />
no immobile fraction<br />
1.0<br />
1.6<br />
1.4<br />
~ 70 % immobile<br />
1.2<br />
1.0<br />
1.6<br />
1.4<br />
~ 60 % immobile<br />
1.2<br />
1.0<br />
1.6<br />
1.4<br />
no immobile fraction<br />
~ 70 % immobile<br />
~ 40 % immobile<br />
no immobile fraction<br />
~ 70 % immobile<br />
~ 50 % immobile<br />
1.2<br />
1.0<br />
1.6<br />
1.4<br />
1.2<br />
1.0<br />
2.5<br />
2.0<br />
1.5<br />
1.0<br />
1.6<br />
1.4<br />
1.2<br />
1.0<br />
1.6<br />
1.4<br />
1.2<br />
1.0<br />
2.5<br />
2.0<br />
1.5<br />
1.0<br />
5 10 time (s)<br />
Stable U2OS lines expressing one GFP-tagged remodeler variant<br />
were used to measure the expression level of the endogenous<br />
remodelers. The concentrations of GFP-tagged remodelers were<br />
determined by FCS experiments (Table S1). Subsequently, quantitative<br />
Western blotting was used to measure the ratio of endogenous<br />
remodelers relative to the GFP-tagged ones (Fig. S2). The<br />
expression levels of Snf2H-GFP and GFP-Snf2L+13 were about<br />
twofold higher than those of the corresponding endogenous proteins,<br />
whereas endogenous Snf2L was not detectable in the U2OS<br />
cell line. From the combined FCS/Western blot analysis endogenous<br />
protein concentrations of 0.83 ± 0.13 μM (Snf2H), >0.15 ±<br />
0.03 μM (hACF complex formed by Snf2H and Acf1),
cells stably expressing Snf2H-GFP. The normalized degree of<br />
cross-correlation was r x = 0.22 ± 0.04 (Fig. 2, Table 1), which<br />
shows that both proteins interact. The simplest model to explain<br />
the FCCS results is the association of Snf2H and Acf1 homodimers<br />
into a heterotetrameric ACF complex (larger <strong>complexes</strong><br />
would also be compatible with the data). For an ACF heterotetramer<br />
the fraction of the total cellular Snf2H pool in this<br />
complex is >18 ± 4%. Considering the contribution of unlabeled<br />
endogenous protein would increase this value.<br />
Snf2H-GFP, GFP-Snf2L, and Acf1-GFP Are Only Transiently Associated<br />
with Chromatin in G1/2 Phase. The dynamics of Snf2H, Snf2L, and<br />
Snf2L+13 in living U2OS cells during G1/2 and S phase were<br />
characterized by a combination of FRAP and FCS experiments<br />
(Fig. 3, Tables 2 and 3). For all proteins the FRAP recovery curves<br />
could be fitted well with a diffusion model, in which the contribution<br />
of transient binding is included into an effective diffusion<br />
coefficient (19). Recovery in the FRAP experiments during G1<br />
phase was almost complete with immobile fractions of only 1–4%<br />
(Table 2). During S phase the immobile fraction increased as observed<br />
in FRAP and CP experiments (Table 2, Fig. 1). The FRAP<br />
value of ∼10% was lower than that of 40–70% estimated from the<br />
CP analysis because the bleached area in the FRAP experiments<br />
contained both replication foci and regions of low PCNA density.<br />
From an analysis of the FRAP data according to a reaction–<br />
diffusion model the lower limit of the dissociation rate in G1/2<br />
phase was determined to be k off > 14 s −1 (t res = 70 ms) for Snf2H-<br />
GFP and k off > 8s −1 (t res = 130 ms) for GFP-Snf2L (SI Materials<br />
and Methods). An upper limit for k off could not be determined<br />
reliably in the FRAP analysis because the average residence time<br />
in the <strong>chromatin</strong>-bound state was too short. This question was<br />
addressed by FCS experiments that have a much better time resolution<br />
and yield the diffusion time τ in the nucleus as a direct<br />
readout from the intensity fluctuations in the focal volume. In<br />
addition, the remodelers’ mobility can be measured also in the<br />
cytosol by FCS where both Snf2H and Snf2L are freely mobile and<br />
present at nanomolar concentration with D =13μm 2·s −1 or τ =<br />
∼0.6 ms (Table 3). Corresponding values in the nucleus were<br />
G( ) (a. u.)<br />
G( ) (a. u.)<br />
1.0<br />
0.8<br />
0.6<br />
0.4<br />
0.2<br />
1.0<br />
0.8<br />
0.6<br />
0.4<br />
0.2<br />
AC green<br />
XC<br />
Snf2H-GFP + Acf1-RFP<br />
AC red<br />
A<br />
AC green<br />
AC red<br />
XC positive<br />
AC red<br />
10 2 10 3 10 4 10 5 10 6 10 2 10 3 10 4 10 5 10 6<br />
(µs) (µs)<br />
AC green<br />
XC<br />
Snf2H-GFP + RFP-Snf2H<br />
AC red<br />
(µs)<br />
C<br />
XC<br />
AC green<br />
10 2 10 3 10 4 10 5 10 6 XC negative<br />
Acf1-GFP + Acf1-RFP<br />
GFP/RFP controls<br />
B<br />
D<br />
10 2 10 3 10 4 10 5<br />
(µs)<br />
Fig. 2. Interactions of Snf2H and Acf1 probed by FCCS in the U2OS cell<br />
nucleus. The value of the ratio r x (Table 1) calculated from the amplitudes of<br />
the cross-correlation and autocorrelation functions reveals the presence of<br />
<strong>complexes</strong> containing Snf2H-GFP and Acf1-RFP (A), Acf1-GFP and Acf1-RFP<br />
(B), and Snf2H-GFP and RFP-Snf2H (C). Auto- (AC) and cross-correlation (XC)<br />
functions of the two color channels are shown. (D) Control measurements in<br />
U2OS cells expressing a GFP–RFP fusion protein (XC positive) or GFP and RFP<br />
alone (XC negative).<br />
Table 1. FCCS measurements of Snf2H and Acf1 interactis in the<br />
U2OS cell nucleus<br />
Complex D nuc (μm 2·s −1 ) Ratio G r x Complex, %<br />
Snf2H-GFP·RFP-Snf2H 3.4 ± 0.6 0.35 ± 0.02 0.29 ± 0.02 >82 ± 8<br />
Snf2H-GFP·Acf1-RFP 3.8 ± 1.5 0.29 ± 0.04 0.22 ± 0.04 >18 ± 4<br />
Acf1-GFP·Acf1-RFP 2.9 ± 0.9 0.37 ± 0.03 0.32 ± 0.04 >94 ± 6<br />
D nuc is the diffusion coefficient of the complex determined from the crosscorrelation<br />
analysis. The degree of cross-correlation r x reflects the amount of<br />
<strong>complexes</strong> formed that carry both a GFP and an RFP label. For details on the<br />
FCCS analysis, see SI Materials and Methods.<br />
2.0 ± 0.3 ms (Snf2H-GFP) and 1.2 ± 0.2 ms (GFP-Snf2L) for 70–<br />
80% of the molecules (Table 3). Furthermore, an additional slow<br />
population with D slow = 0.03–0.10 μm 2·s −1 (τ = 100–600 ms) was<br />
present in the nucleus, which reflects <strong>chromatin</strong> translocations<br />
that manifest themselves as slow intensity fluctuations of bound<br />
fluorescently labeled proteins. This explanation is inferred from<br />
the value of the anomaly parameter α > 1, which is indicative of<br />
a confined diffusion behavior in the FCS analysis, and the observation<br />
that this contribution is a general feature of proteins<br />
that interact transiently with <strong>chromatin</strong> like hetero<strong>chromatin</strong><br />
protein 1 (19). This interpretation is corroborated by the absence<br />
of a corresponding mobility fraction in the FRAP experiments for<br />
Snf2H/Snf2L, where a
1.0<br />
Snf2H-GFP<br />
A<br />
GFP-Snf2L<br />
B<br />
GFP-Snf2L+13<br />
C<br />
Acf1-GFP<br />
D<br />
(%)<br />
intensity<br />
0.8<br />
0.6<br />
0.4<br />
0.2<br />
G1/2 phase<br />
S phase<br />
G1/2, ATP depletion<br />
0 5 10 15 20 25 30 35<br />
t (s)<br />
0 5 10 15 20 25 30 35<br />
t (s)<br />
0 5 10 15 20 25 30 35<br />
t (s)<br />
0 5 10 15 20 25 30 35<br />
t (s)<br />
1.0<br />
Snf2H-GFP<br />
E<br />
GFP-Snf2L<br />
F<br />
GFP-Snf2L+13<br />
G<br />
Acf1-GFP<br />
H<br />
N ormalized G( )<br />
0.8<br />
0.6<br />
0.4<br />
0.2<br />
cytosol<br />
nucleus<br />
cytosol<br />
nucleus<br />
cytosol<br />
nucleus<br />
cytosol<br />
nucleus<br />
10 2 10 3 10 4 10 5<br />
(µs)<br />
10 2 10 3 10 4 10 5<br />
(µs)<br />
(µs)<br />
(µs)<br />
10 2 10 3 10 4 10 5<br />
10 2 10 3 10 4 10 5 10 6<br />
Fig. 3. Mobility of Snf2H-GFP, GFP-Snf2L, GFP-Snf2L+13, and Acf1-GFP. All proteins displayed a high mobility and only transient binding to <strong>chromatin</strong> during<br />
G1/2 phase (Tables 2 and 3) but an increased immobilized fraction was observed for Snf2H and Snf2L during S phase in U2OS cells. A–D show averaged FRAP<br />
curves, and E–H display single FCS experiments for the indicated proteins.<br />
described above. The results were the same as those obtained in<br />
the comparison of Snf2L and Snf2L+13: A small reduction by 1–<br />
3% in the immobile fraction and a slight change of the effective<br />
diffusion coefficient toward a higher mobility in the ATP-depleted<br />
cells (Fig. 3 A–D, Table 2). Thus, the mobility differences between<br />
the active and the inactive (Snf2L+13, ATP-depleted Snf2H and<br />
Snf2L) case were significant but small. This result suggests that<br />
only a fraction of a few percent of the remodelers is actively involved<br />
in <strong>chromatin</strong> <strong>remodeling</strong> during G1/2 phase and displays<br />
an increased residence time in the <strong>chromatin</strong>-bound state.<br />
Discussion<br />
The translocation of nucleosomes by <strong>chromatin</strong> <strong>remodeling</strong><br />
<strong>complexes</strong> was investigated previously in numerous in vitro<br />
studies (e.g., refs. 6–8, 13, 16, 17, 27, 28, 32, and references<br />
therein). However, details on their mode of operation in living<br />
cells are missing. Here, we analyzed the dynamics and interaction<br />
behavior of Snf2H, Snf2L, and Snf2L+13 as well as Acf1 in living<br />
cells with a multiscale approach that combined FRAP, CP, and<br />
FC(C)S experiments (18–21). In the case of FRAP, the shape of<br />
Table 2.<br />
Protein<br />
FRAP measurements in U2OS cells<br />
D eff , μm 2·s −1 k off ,s −1 Immobile, %<br />
G1/2 S G1/2 G1/2 S<br />
Snf2H-GFP 0.9 ± 0.1 0.8 ± 0.1 >13.6 ± 2.3 4 ± 1 9 ± 2<br />
Snf2H-GFP, no ATP 1.2 ± 0.1 0.8 ± 0.1 >12.3 ± 2.3 1 ± 0 9 ± 2<br />
GFP-Snf2L 1.0 ± 0.1 0.6 ± 0.1 >8.3 ± 1.5 3 ± 1 9 ± 1<br />
GFP-Snf2L, no ATP 1.2 ± 0.2 0.6 ± 0.2 >3.3 ± 0.4 2 ± 1 12 ± 3<br />
GFP-Snf2L+13 1.6 ± 0.1 1.5 ± 0.7 >2.0 ± 0.4 1 ± 1 n.d.<br />
GFP-Snf2L+13, 1.4 ± 0.2 n.d. >7.7 ± 1.5 1 ± 0 n.d.<br />
no ATP<br />
Acf1-GFP 0.9 ± 0.3 n.d. >2.3 ± 0.8 3 ± 2 n.d.<br />
Acf1-GFP, no ATP 0.7 ± 0.1 n.d. >2.3 ± 0.5 0 n.d.<br />
Measurements in S phase represent an average over several replication<br />
foci and regions of low PCNA density within the bleached region. n.d., not<br />
determined.<br />
the recovery curve is used to extract dynamic parameters such<br />
as the diffusion coefficient and the kinetic rate constants. Furthermore,<br />
immobilized proteins are identified reliably from an<br />
incomplete recovery. CP has the advantage that immobilized<br />
protein fractions at loci as small as the optical resolution can<br />
be evaluated. FCS on the other hand yields information on the<br />
mobile protein fraction with high spatial and temporal resolution<br />
that is complementary to FRAP and CP.<br />
The FRAP, CP, and FCS experiments revealed that all proteins<br />
studied here were highly dynamic in the nucleus during G1/2<br />
phase and bound only transiently to <strong>chromatin</strong> with upper limits<br />
for the residence times of
Table 3.<br />
FCS measurements in U2OS cells<br />
Protein D cyt , μm 2·s −1 D nuc , μm 2·s −1 f slow ,% D slow , μm 2·s −1 α slow K* bin<br />
Snf2H-GFP 13.0 ± 1.0 3.9 ± 0.4 22 ± 3 0.03 ± 0.01 2.1 ± 0.2 2.3 ± 0.7<br />
GFP-Snf2L 13.3 ± 0.8 6.6 ± 0.4 29 ± 3 0.11 ± 0.01 1.5 ± 0.1 1.0 ± 0.3<br />
GFP-Snf2L+13 13.0 ± 1.4 5.2 ± 0.4 25 ± 4 0.10 ± 0.01 1.3 ± 0.2 1.5 ± 0.5<br />
Acf1-GFP 10.4 ± 0.5 3.5 ± 0.5 33 ± 5 0.07 ± 0.02 1.4 ± 0.3 2.0 ± 0.6<br />
From the comparison of FCS measurements of diffusion coefficients in the cytosol (D cyt ) and in the nucleus<br />
(D nuc ) the pseudoequilibrium binding constant K* bin (K bin multiplied with the binding site concentration) was<br />
determined. The larger value for Snf2H-GFP compared with GFP-Snf2L reflects either a higher binding affinity to<br />
<strong>chromatin</strong> or the presence of more binding sites than for GFP-Snf2L. The slow mobility fractions f slow displayed<br />
a behavior indicative of a slowly, confinedly moving lattice that is characterized by α > 1 in the FCS analysis.<br />
value is the lower limit that does not consider the presence of<br />
unlabeled endogenous Snf2H and Acf1, which reduce the crosscorrelation<br />
signal. Due to the presence of other Snf2H-containing<br />
<strong>complexes</strong> like NoRC or WSTF not the whole Snf2H pool is<br />
present in Acf1-containing <strong>complexes</strong> (8, 9, 26). Because the<br />
monomeric Snf2H fraction was determined to equal 0.15 ± 0.03 μM (hACF complex formed<br />
by Snf2H and Acf1), 100 nM. Extrapolating this value to the total<br />
concentration of all <strong>remodeling</strong> <strong>complexes</strong> and including <strong>complexes</strong><br />
of the other ATPase families (Snf2, Mi-2, Chd1, Ino80,<br />
ERCC6, ALC1, CHD7, Swr1, RAD54, and Lsh), the total <strong>chromatin</strong><br />
remodeler concentration in the human cell nucleus is estimated<br />
to be in the 10 μM range with a nucleosome concentration<br />
of 140 μM (35). Thus, the resulting remodeler/nucleosome<br />
ratio is similar to that of yeast with one remodeler per ∼10<br />
nucleosomes (36, 37). Because of their presence in high concentrations<br />
and the capability of <strong>complexes</strong> like ACF to bind >1 nucleosome,<br />
it has been proposed that <strong>ISWI</strong> <strong>chromatin</strong> remodelers<br />
might represent a stable structural component of <strong>chromatin</strong> (38).<br />
In the light of the high mobility of these <strong>complexes</strong> and the absence<br />
of a significant immobile fraction during G1/2 phase, such an<br />
architectural function during the whole cell cycle seems unlikely.<br />
Furthermore, several other conclusions on the mechanism by<br />
which <strong>chromatin</strong> <strong>remodeling</strong> <strong>complexes</strong> operate in living cells can<br />
be made (Fig. 4). The very short residence time in the <strong>chromatin</strong>bound<br />
state during G1/2 phase reveals either that the <strong>remodeling</strong><br />
reaction is too fast to be resolved or that only a very small<br />
remodeler fraction (
esults of several reports that demonstrate a connection between<br />
<strong>remodeling</strong> activity and histone modifications as reviewed in ref. 7.<br />
From the parameters measured here for the isolated Snf2H ATPase<br />
and its complex with Acf1 (endogenous protein concentration 0.15–<br />
0.83 μM, average residence time 75–430 ms) we estimate that<br />
nucleosomes are <strong>sample</strong>d at a rate of 0.1–3min −1 by a specific<strong>ISWI</strong>type<br />
complex. To probe 99% of all genomic nucleosomes, average<br />
sampling times of ∼80 s (all Snf2H containing remodelers) and ∼45<br />
min (ACF) are calculated with the values from the FRAP analysis (SI<br />
Materials and Methods and Table S2). These results have to be<br />
regarded as upper limits because the average residence times in the<br />
order of 10 ms from the FCS analysis would decrease the corresponding<br />
sampling times to 11–64 s. Thus, after setting an appropriate<br />
signal a nucleosome can be translocated within tens of seconds<br />
or minutes to its new position. For this mechanism a relatively large<br />
concentration of remodelers is required to <strong>sample</strong> the ensemble of<br />
all nucleosomes in the genome at an acceptable speed. If the cell<br />
contained a 100-fold lower concentration of <strong>ISWI</strong>-type remodelers,<br />
i.e., a concentration of a few nanomolar, the sampling time would<br />
increase to hours. This would introduce a significant lag time for the<br />
readout of external signals on the timescale of cellular transitions.<br />
From this point of view a large pool of remodelers with only a small<br />
fraction of simultaneously active <strong>complexes</strong> seems mandatory to<br />
respond quickly to changes of the <strong>chromatin</strong> state. It is noted that<br />
these features of the continuous sampling mechanism are in excellent<br />
agreement with findings on cyclically occurring epigenetic processes<br />
that initiate and terminate <strong>remodeling</strong> of <strong>chromatin</strong> by SWI/<br />
SNF and NuRD <strong>complexes</strong> (33, 43, 44). In contrast, a large fraction<br />
of continuously active remodelers would constantly expose all parts<br />
of the DNA sequence to the surrounding nucleoplasm at much<br />
higher energy costs, because the remodelers’ ATPase activity is<br />
stimulated by the bound nucleosome substrate (32). Thus, our<br />
findings point to a tight regulation of <strong>chromatin</strong> accessibility, realized<br />
by nucleosomes as switches that are continuously <strong>sample</strong>d by <strong>chromatin</strong><br />
remodelers and triggered upon distinct signals.<br />
Materials and Methods<br />
Experiments were conducted with GFP and RFP constructs of human Snf2H,<br />
Snf2L, Snf2L+13, and Acf1 in human U2OS osteosarcoma, human embryonic<br />
kidney HEK293T, and mouse NIH 3T3 cell lines as described in SI Materials and<br />
Methods. For Snf2H-GFP, GFP-Snf2L, and GFP-Snf2L+13 stably transfected U2OS<br />
clones were derived. Other constructs were introduced via transient transfection.<br />
FRAP, CP, and F(C)CS experiments were conducted as described previously<br />
(19) and in SI Materials and Methods.Atleast20cellsweremeasuredfor<br />
a given experimental condition. For FRAP the time evolution of the intensity<br />
integrated over the bleach spot was fitted to a diffusion model, to a binding<br />
model, or to a reaction–diffusion model that incorporates both diffusion and<br />
binding processes. In the CP experiments the decay of the fluorescence signal<br />
due to the dynamic equilibrium of photobleaching, diffusion, and <strong>chromatin</strong><br />
dissociation/association of GFP-tagged proteins was used to measure the<br />
immobilized fraction with the resolution given by the confocal excitation volume.<br />
The FCS data were fitted to a one- or two-component anomalous diffusion<br />
model, which is characterized by a nonlinear time dependency of the mean<br />
squared particle displacement given by the anomaly parameter α.<br />
ACKNOWLEDGMENTS. We thank Malte Wachsmuth for help and discussions,<br />
Patrick Varga-Weisz (Babraham Institute, Cambridge, UK) and David<br />
Picketts (Ottawa Health Research Institute, Ottawa, Canada) for plasmid<br />
vectors, and Hanswalter Zentgraf (Deutsches Krebsforschungszentrum,<br />
Heidelberg, Germany) for the Snf2L+13 antibody. This work was supported<br />
by Deutsche Forschungsgemeinschaft Grants Ri 1283/8-1 (to K.R.) and FOR1068<br />
(to G.L.) and by the Baygene program of the Bavarian State Ministry of<br />
Sciences, Research, and the Arts (G.L.).<br />
1. Radman-Livaja M, Rando OJ (2010) Nucleosome positioning: How is it established, and<br />
why does it matter Dev Biol 339:258–266.<br />
2. Jiang C, Pugh BF (2009) Nucleosome positioning and gene regulation: Advances<br />
through genomics. Nat Rev Genet 10:161–172.<br />
3. Segal E, Widom J (2009) From DNA sequence to transcriptional behaviour: A<br />
quantitative approach. Nat Rev Genet 10:443–456.<br />
4. Henikoff S (2008) Nucleosome destabilization in the epigenetic regulation of gene<br />
expression. Nat Rev Genet 9:15–26.<br />
5. Flaus A, Martin DM, Barton GJ, Owen-Hughes T (2006) Identification of multiple distinct<br />
Snf2 subfamilies with conserved structural motifs. Nucleic Acids Res 34:2887–2905.<br />
6. Rippe K, et al. (2007) DNA sequence- and conformation-directed positioning of nucleosomes<br />
by <strong>chromatin</strong>-<strong>remodeling</strong> <strong>complexes</strong>. Proc Natl Acad Sci USA 104:15635–15640.<br />
7. Gangaraju VK, Bartholomew B (2007) Mechanisms of ATP dependent <strong>chromatin</strong><br />
<strong>remodeling</strong>. Mutat Res 618:3–17.<br />
8. He X, Fan HY, Garlick JD, Kingston RE (2008) Diverse regulation of SNF2h <strong>chromatin</strong><br />
<strong>remodeling</strong> by noncatalytic subunits. Biochemistry 47:7025–7033.<br />
9. Corona DF, Tamkun JW (2004) Multiple roles for <strong>ISWI</strong> in transcription, chromosome<br />
organization and DNA replication. Biochim Biophys Acta 1677:113–119.<br />
10. Bork P, Koonin EV (1993) An expanding family of helicases within the ‘DEAD/H’<br />
superfamily. Nucleic Acids Res 21:751–752.<br />
11. Eisen JA, Sweder KS, Hanawalt PC (1995) Evolution of the SNF2 family of proteins:<br />
Subfamilies with distinct sequences and functions. Nucleic Acids Res 23:2715–2723.<br />
12. Boyer LA, Latek RR, Peterson CL (2004) The SANT domain: A unique histone-tailbinding<br />
module Nat Rev Mol Cell Biol 5:158–163.<br />
13. Grüne T, et al. (2003) Crystal structure and functional analysis of a nucleosome<br />
recognition module of the <strong>remodeling</strong> factor <strong>ISWI</strong>. Mol Cell 12:449–460.<br />
14. Eberharter A, Becker PB (2004) ATP-dependent nucleosome remodelling: Factors and<br />
functions. J Cell Sci 117:3707–3711.<br />
15. Banting GS, et al. (2005) CECR2, a protein involved in neurulation, forms a novel<br />
<strong>chromatin</strong> <strong>remodeling</strong> complex with SNF2L. Hum Mol Genet 14:513–524.<br />
16. Längst G, Becker PB (2001) Nucleosome mobilization and positioning by <strong>ISWI</strong>containing<br />
<strong>chromatin</strong>-<strong>remodeling</strong> factors. J Cell Sci 114:2561–2568.<br />
17. Narlikar GJ, Fan HY, Kingston RE (2002) Cooperation between <strong>complexes</strong> that<br />
regulate <strong>chromatin</strong> structure and transcription. Cell 108:475–487.<br />
18. Wachsmuth M, Caudron-Herger M, Rippe K (2008) Genome organization: Balancing<br />
stability and plasticity. Biochim Biophys Acta 1783:2061–2079.<br />
19. Müller KP, et al. (2009) Multiscale analysis of dynamics and interactions of hetero<strong>chromatin</strong><br />
protein 1 by fluorescence fluctuation microscopy. Biophys J 97:2876–2885.<br />
20. Michelman-Ribeiro A, et al. (2009) Direct measurement of association and dissociation<br />
rates of DNA binding in live cells by fluorescence correlation spectroscopy. Biophys J<br />
97:337–346.<br />
21. Haustein E, Schwille P (2007) Fluorescence correlation spectroscopy: Novel variations<br />
of an established technique. Annu Rev Biophys Biomol Struct 36:151–169.<br />
22. Leonhardt H, et al. (2000) Dynamics of DNA replication factories in living cells. J Cell<br />
Biol 149:271–280.<br />
23. Collins N, et al. (2002) An ACF1-<strong>ISWI</strong> <strong>chromatin</strong>-<strong>remodeling</strong> complex is required for<br />
DNA replication through hetero<strong>chromatin</strong>. Nat Genet 32:627–632.<br />
24. Barak O, Lazzaro MA, Cooch NS, Picketts DJ, Shiekhattar R (2004) A tissue-specific,<br />
naturally occurring human SNF2L variant inactivates <strong>chromatin</strong> <strong>remodeling</strong>. J Biol<br />
Chem 279:45130–45138.<br />
25. Gunkel M, et al. (2009) Dual color localization microscopy of cellular nanostructures.<br />
Biotechnol J 4:927–938.<br />
26. Xiao A, et al. (2009) WSTF regulates the H2A.X DNA damage response via a novel<br />
tyrosine kinase activity. Nature 457:57–62.<br />
27. Ito T, et al. (1999) ACF consists of two subunits, Acf1 and <strong>ISWI</strong>, that function cooperatively<br />
in the ATP-dependent catalysis of <strong>chromatin</strong> assembly. Genes Dev 13:1529–1539.<br />
28. Poot RA, et al. (2000) HuCHRAC, a human <strong>ISWI</strong> <strong>chromatin</strong> remodelling complex<br />
contains hACF1 and two novel histone-fold proteins. EMBO J 19:3377–3387.<br />
29. Rippe K (2000) Simultaneous binding of two DNA duplexes to the NtrC-enhancer<br />
complex studied by two-color fluorescence cross-correlation spectroscopy. Biochemistry<br />
39:2131–2139.<br />
30. Strohner R, et al. (2005) A ‘loop recapture’ mechanism for ACF-dependent<br />
nucleosome <strong>remodeling</strong>. Nat Struct Mol Biol 12:683–690.<br />
31. Barak O, et al. (2003) Isolation of human NURF: A regulator of Engrailed gene<br />
expression. EMBO J 22:6089–6100.<br />
32. Boyer LA, et al. (2000) Functional delineation of three groups of the ATP-dependent<br />
family of <strong>chromatin</strong> <strong>remodeling</strong> enzymes. J Biol Chem 275:18864–18870.<br />
33. Hager GL, McNally JG, Misteli T (2009) Transcription dynamics. Mol Cell 35:741–753.<br />
34. Hu M, et al. (2008) Three-dimensional structure of human <strong>chromatin</strong> accessibility<br />
complex hCHRAC by electron microscopy. J Struct Biol 164:263–269.<br />
35. Weidemann T, et al. (2003) Counting nucleosomes in living cells with a combination<br />
of fluorescence correlation spectroscopy and confocal imaging. J Mol Biol 334:229–240.<br />
36. Ghaemmaghami S, et al. (2003) Global analysis of protein expression in yeast. Nature<br />
425:737–741.<br />
37. Huh WK, et al. (2003) Global analysis of protein localization in budding yeast. Nature<br />
425:686–691.<br />
38. Varga-Weisz PD, Becker PB (2006) Regulation of higher-order <strong>chromatin</strong> structures by<br />
nucleosome-remodelling factors. Curr Opin Genet Dev 16:151–156.<br />
39. Zhang Y, et al. (2006) DNA translocation and loop formation mechanism of <strong>chromatin</strong><br />
<strong>remodeling</strong> by SWI/SNF and RSC. Mol Cell 24:559–568.<br />
40. Yang JG, Narlikar GJ (2007) FRET-based methods to study ATP-dependent changes in<br />
<strong>chromatin</strong> structure. Methods 41:291–295.<br />
41. Fyodorov DV, Kadonaga JT (2002) Dynamics of ATP-dependent <strong>chromatin</strong> assembly<br />
by ACF. Nature 418:897–900.<br />
42. Gangaraju VK, Prasad P, Srour A, Kagalwala MN, Bartholomew B (2009) Conformational<br />
changes associated with template commitment in ATP-dependent<br />
<strong>chromatin</strong> <strong>remodeling</strong> by ISW2. Mol Cell 35:58–69.<br />
43. Métivier R, et al. (2003) Estrogen receptor-alpha directs ordered, cyclical, and<br />
combinatorial recruitment of cofactors on a natural target promoter. Cell 115:751–763.<br />
44. George AA, Schiltz RL, Hager GL (2009) Dynamic access of the glucocorticoid receptor<br />
to response elements in <strong>chromatin</strong>. Int J Biochem Cell Biol 41:214–224.<br />
6of6 | www.pnas.org/cgi/doi/10.1073/pnas.1003438107 Erdel et al.
Supporting Information<br />
Erdel et al. 10.1073/pnas.1003438107<br />
SI Materials and Methods<br />
Plasmid Vectors and Cell Lines. The plasmids pEGFP-N3-Snf2H<br />
and pEGFP-N1-Acf1 were kindly provided by Patrick Varga-<br />
Weisz and contain the full coding sequence of human Snf2H or<br />
Acf1 fused to GFP at the C terminus, referred to as Snf2H-GFP<br />
and Acf1-GFP (1). The coding sequences of human Snf2L and<br />
Snf2L+13 generously provided by David Picketts (2, 3) were<br />
cloned into pEGFP-C1 (Clontech) to construct the GFP-Snf2L<br />
and GFP-Snf2L+13 vectors. The red fluorescent derivatives<br />
RFP-Snf2H and Acf1-RFP were generated by cloning the coding<br />
sequence into pTagRFP-N1 or pTagRFP-C1 (Evrogen). The<br />
mRFP1-labeled histone H2A (H2A-RFP) and proliferating cell<br />
nuclear antigen (PCNA-RFP) have been described previously<br />
(4, 5). For FCCS analyses, an mRFP1-GFP fusion construct was<br />
used for comparison, which was kindly provided by Malte<br />
Wachsmuth (European Molecular Biology Laboratory, Heidelberg,<br />
Germany).<br />
Cell Culture, Immunoprecipitation, and Western Blotting. Cells of the<br />
human U2OS osteosarcoma cell line (HTB-96) were cultured<br />
in DMEM/10% FCS, NIH 3T3 cells were cultured in DMEM<br />
High Glucose/10% FCS. For Snf2H-GFP, GFP-Snf2L and GFP-<br />
Snf2L+13 stably transfected U2OS clones were derived. Other<br />
constructs were introduced via transient transfection. For FRAP<br />
and FCS experiments as well as live imaging cells were grown in<br />
LabTek chambers (Nunc). ATP depletion was done as described<br />
previously by adding sodium azide to a final concentration of 10 mM<br />
(6). Measurements were performed after 20–30 min incubation.<br />
For immunostaining, cells were cultured in 12-well plates, and fixation<br />
was carried out using 4% paraformaldehyde/PBS for 7 min.<br />
For the production of cell lysates, U2OS cells were grown to confluence,<br />
harvested, and incubated on ice for 30 min in lysis buffer<br />
[10 mM Tris/Cl (pH 7.5), 150 mM NaCl, 0.5 mM EDTA, 0.1%<br />
Nonidet P-40] supplemented with a “complete” protease inhibitor<br />
mixture (Roche). Subsequently, membrane fragments were removed<br />
by centrifugation. For immunoprecipitation of GFP-tagged<br />
proteins, equilibrated Sepharose beads coupled to GFP-binding<br />
protein (GBP) (Chromotek) were added to the cell lysate and incubated<br />
for 1–2 h at 4 °C. Captured proteins were eluted by boiling<br />
in SDS-containing elution buffer and loaded onto a polyacrylamide<br />
gel. Proteins were transferred on nitrocellulose membranes<br />
(Whatman), using a wet-blot system (BioRad). Membranes were<br />
incubated with primary antibodies directed against Snf2H (no.<br />
07-624; Upstate), Snf2L (ab37003; Abcam), or Snf2L+13 (Hanswalter<br />
Zentgraf, Deutsches Krebsforschungszentrum, Heidelberg,<br />
Germany) and secondary antibodies coupled to horseradish peroxidase.<br />
For detection, membranes were incubated with ECL solution<br />
and imaged with a CCD system (Intas). Alternatively, secondary<br />
antibodies coupled to DyLight 680 or DyLight 800 dyes<br />
were used and the signal was detected with a LI-COR Odyssey system<br />
(LI-COR Biosciences). Both methods yielded identical results.<br />
In Vitro Activity Assay of GFP-Tagged ATPases Snf2H and Snf2L. The<br />
activity of the GFP-tagged remodelers was tested in an in vitro<br />
assay. First, Snf2H-GFP, GFP-Snf2L, and the splice variant GFP-<br />
Snf2L+13 were purified from transiently transfected HEK293T<br />
cells, using the GFP-Trap system (Chromotek) according to the<br />
manufacturer’s protocol. Second, the matrix-bound proteins were<br />
incubated with nucleosomes reconstituted on a Cy5-labeled DNA<br />
fragment containing the 601 nucleosome positioning sequence<br />
and ATP. Nucleosome <strong>remodeling</strong> reactions were performed<br />
as described (7). For one reaction, 0.02 pmol nucleosomes and<br />
0.3 ± 0.1 pmol of the His-tagged remodelers in solution (Fig. S3B<br />
and His-Snf2L in Fig. S3D) or 0.9 ± 0.3 pmol of the remodelers<br />
bound to agarose beads (Fig. S3C and GFP-Snf2L/L+13 in Fig.<br />
S3D) were used. Nucleosome positions were resolved on 6% native<br />
polyacrylamide gels containing 0.5× TBE and scanned with<br />
the Fuji FLA-5000 fluorescence system.<br />
Continuous Photobleaching and UV Microirradiation. Continuous<br />
photobleaching experiments were conducted with a Zeiss LSM<br />
710 ConfoCor3. Medium laser intensities (∼10% of the Lasos<br />
Argon laser operated in standby mode) were used for bleaching.<br />
CP data were analyzed as described previously (8, 9). All curves<br />
measured here could be successfully fitted with a model incorporating<br />
an immobile fraction and a mobile pool:<br />
<br />
IðtÞ ¼f immo 1 þ α t<br />
2 þ α2 t 2 − 1<br />
þð1 − f immo Þexpð −β tÞ:<br />
6<br />
α and β denote the bleach rates for the immobile and the mobile<br />
pool, respectively; f immo is the immobile fraction. This expression<br />
corresponds to the equation derived previously with k off = 0 (8).<br />
For UV microirradiation a region of interest was irradiated with<br />
the 405-nm laser line at maximum power for ∼10 s to introduce<br />
DNA damage.<br />
Fluorescence Recovery After Photobleaching. FRAP experiments<br />
were carried out on a Leica SP5 microscope. Images were acquired<br />
with 128 × 128 pixels in size and a scanning speed of 1,400 Hz.<br />
Typically 30 images were acquired before the bleach, 2 images<br />
were used for bleaching, and up to 500 images were acquired after<br />
the bleach. The shape of the bleachedregionofinterest(ROI)was<br />
chosen to be circular because in this case an analytical solution for<br />
the Laplace transform of the recovery curve can be found. The diameter<br />
of the ROI was between 3 and 5 μm. The location of the ROI<br />
was selected in a way that between the cell boundary and the ROI<br />
sufficient space remained: This positioning is important to meet the<br />
assumption that the recovery does not depend on the local geometry<br />
and occurs in an isotropic fashion. Typically, 20–30 cells were analyzed<br />
for a given experimental condition. For the average values of<br />
the effective diffusion coefficient, each FRAP curve was fitted, the<br />
normalized diffusion times (i.e., the inverse diffusion coefficients)<br />
from each individual fit were averaged, and the resulting diffusion<br />
coefficient was calculated on the basis of the averaged diffusion time.<br />
FRAP analysis was conducted with the software FREDIS (9).<br />
Recovery curves were fitted to a diffusion model, a reaction<br />
model, and a reaction–diffusion model (10). The diffusion model<br />
is suitable if no binding sites or binding sites with very high dissociation<br />
rates are present (effective diffusion). The reaction<br />
model describes the recovery if a binding site with a small dissociation<br />
rate is present, and the reaction–diffusion model describes<br />
the recovery in the presence of immobile binding sites with dissociation<br />
rate constant k off . The expressions for the different<br />
models are as follows:<br />
<br />
diffusion model: frapðtÞ¼ e − τ D τD<br />
τD<br />
<br />
2t I 0 þ I 1<br />
2t 2t<br />
reaction model: frap t ¼ 1 − C eq e − k offt<br />
Erdel et al. www.pnas.org/cgi/content/short/1003438107<br />
1of7
eaction-diffusion model:<br />
frapðpÞ ¼ 1 p − F eq<br />
p<br />
<br />
1 − 2K 1 ðqwÞI 1 ðqwÞ <br />
1 þ k∗ on<br />
p þ k off<br />
C eq<br />
− :<br />
p þ k off<br />
C eq and F eq denote the bound and the free fraction, k ∗ on and k off<br />
denote the pseudoassociation rate and the dissociation rate, τ D<br />
is the diffusion time, I 0 and I 1 are modified Bessel functions,<br />
<br />
w<br />
is the bleach radius, and q 2 ¼ p=D f<br />
1 þ k ∗ on =ðp þ k offÞ . Because<br />
there is no analytical solution in the case of the reaction–diffusion<br />
model, the solution for the inverse Laplace transform is<br />
given ( p is the complex Laplace variable).<br />
The different fits were compared with each other on the basis of<br />
the F ratio, which depends on the fit qualities (χ 2 values) and the<br />
number of fit parameters in each model. A model with more fit<br />
parameters is expected to fit better than a simpler model. Accordingly,<br />
the number of fit parameters has to be accounted for<br />
when comparing different models. All proteins studied in this<br />
work exhibited effective diffusion behavior because their recoveries<br />
could be fitted with the diffusion-dominant model, but the<br />
diffusion coefficients obtained in the nucleus were significantly<br />
smaller than the (free) diffusion coefficients measured in the cytosol.<br />
Because viscosity and crowding effects are similar in the<br />
nucleus and the cytosol (as revealed by the analysis of GFP in the<br />
nucleus and the cytosol) (11), the reduced diffusion coefficient can<br />
be explained by <strong>chromatin</strong> interaction. Using the expression for<br />
the reaction–diffusion model (which fitted the data equally well<br />
compared with the diffusion-dominant model), the 95% confidence<br />
interval for k off was determined. These confidence intervals<br />
became very large in the case of effective diffusion because the<br />
recovery essentially depends on the ratio of the rate constants<br />
k ∗ on =k off. The confidence intervals ranged from some lower limit<br />
for k off to infinity; i.e., for k off values above this lower limit good fits<br />
were obtained by adjusting the other fit parameters accordingly. In<br />
this manner only a lower limit for the dissociation rate k off could be<br />
determined from the FRAP analysis.<br />
Fluorescence Correlation Spectroscopy. For FCS experiments,<br />
a Leica TCS SP2 AOBS FCS2 system or a Zeiss LSM 710<br />
ConfoCor3 was used. Typical acquisition times were in the range<br />
of 60 s. Before every measurement, a calibration with Alexa 488<br />
C5 maleimide (Invitrogen) was performed. Similar laser intensities<br />
were used for the measurement of the <strong>sample</strong>s and the<br />
controls. Data acquisition was with the programs Vista 3.6.22<br />
(ISS) for the Leica SP2 and ZEN (Zeiss) for the Zeiss LSM 710.<br />
FCS data were analyzed as described previously (9). The autocorrelation<br />
function was calculated, and in the case of bleaching<br />
a moving average trend correction was applied. The autocorrelation<br />
function was fitted with the formula for anomalous diffusion<br />
(with one or two components):<br />
GðτÞ ¼ 1 <br />
N f 1<br />
1 ∗ τ<br />
α1<br />
− 1 <br />
þ<br />
1 þ 1 τ<br />
α1<br />
− 1<br />
2<br />
τ D;1 κ 2 τ D;1<br />
τ<br />
α2<br />
− 1 <br />
þð1 − f 1 Þ 1 þ<br />
1 þ 1 τ<br />
α2<br />
! − 1<br />
2<br />
τ D;2 κ 2 :<br />
τ D;2<br />
Here, N denotes the particle number, f 1 the size of the first<br />
component, τ D,1 and τ D,2 are the diffusion times for the first and<br />
the second component, κ is the structure parameter of the microscope’s<br />
focal volume, and α 1 and α 2 are the anomaly parameters<br />
for the first and the second component. Typical fits had<br />
R 2 values >0.95 and uncorrelated residues. At least 20 measurements<br />
were performed for each protein in the nucleus and in<br />
the cytosol.<br />
For FCCS, the cross-correlation function between the GFP and<br />
the RFP signals was calculated and fitted with the same formula<br />
given above. The degree of cross-correlation ratio G was calculated<br />
according to<br />
G x ð0Þ<br />
ratio G ¼ p ffiffiffiffiffiffiffiffiffiffiffiffiffiffiffiffiffiffiffiffiffiffiffiffiffiffiffiffiffiffiffiffiffiffiffiffiffi:<br />
G GFP ð0Þ · G RFP ð0Þ<br />
Here, G x (0) denotes the amplitude of the cross-correlation<br />
function and G GFP (0) and G RFP (0) denote the amplitudes of the<br />
autocorrelation function in the green and the red channel at lag<br />
time τ = 0, respectively. The degree of cross-correlation ratio<br />
G <strong>sample</strong> was normalized using the values for the negative (ratio<br />
G neg ) and positive (ratio G pos ) controls as described previously<br />
(12–14):<br />
r x ¼ ratio G <strong>sample</strong> − ratio G neg<br />
:<br />
ratio G pos − ratio G neg<br />
TetraSpeck 0.1-μm fluorescent microspheres (Invitrogen) were<br />
used as a positive control, and U2OS cells cotransfected with<br />
GFP and RFP were used as a negative control. It is noted that<br />
the formula given above is applicable only if the concentrations<br />
of the green- and the red-labeled proteins are similar to each<br />
other in the negative control as well as in the <strong>sample</strong>, which was<br />
ensured in the experiments presented here. From r x the fraction<br />
θ of protein in the complex was calculated, which depends on the<br />
complex composition and the ratios between labeled (GFP- or<br />
RFP-tagged) and unlabeled (endogenous) protein. For heterodimers<br />
AB of two proteins A and B labeled with different fluorophores,<br />
e.g., A-GFP and B-RFP, the following relation holds:<br />
p<br />
r x;AB ¼<br />
ffiffiffiffiffiffiffiffiffiffiffiffiffiffiffiffiffiffiffiffi<br />
λ A λ B θ A θ B :<br />
Here, λ A and λ B are the labeling degrees of proteins A and B,<br />
i.e., the amount of labeled protein divided by the total amount of<br />
protein of one type, and θ A and θ B are the fractions of monomers<br />
A and B in the complex. For the A 2 B 2 heterotetramer, the degree<br />
of protein in the complex is derived from the normalized crosscorrelation<br />
signal<br />
sffiffiffiffiffiffiffiffiffiffiffiffiffiffiffiffiffiffiffiffiffiffiffiffiffiffiffiffiffiffiffiffiffiffiffiffiffiffiffiffiffiffiffiffi<br />
4λ A λ B θ A θ B<br />
r x;A2B2 ¼<br />
ð1 þ θ A λ A Þð1 þ θ B λ B Þ<br />
2<br />
¼ pffiffiffiffiffiffiffiffiffiffiffiffiffiffiffiffiffiffiffiffiffiffiffiffiffiffiffiffiffiffiffiffiffiffiffiffiffiffiffiffiffiffiffiffi<br />
r x;AB :<br />
ð1 þ θ A λ A Þð1 þ θ B λ B Þ<br />
The maximum value of r x is higher for the A 2 B 2 than for the AB<br />
complex because in the heterotetramer the probability to have<br />
<strong>complexes</strong> that carry only red or only green labels is lower.<br />
To study self-association a protein can be labeled with two<br />
different fluorophores, e.g., A-GFP and A-RFP. For a homodimer<br />
A 2 (or a heterotetramer A 2 B 2 , which is equivalent if B is<br />
not labeled), the degree of cross-correlation is given by<br />
sffiffiffiffiffiffiffiffiffiffiffiffiffiffiffiffiffiffiffiffiffiffiffiffiffiffiffiffiffiffiffiffiffiffiffiffiffiffiffiffiffiffiffiffi<br />
λ A λ B θ A θ B<br />
r x;A2 ¼<br />
:<br />
ð1 þ θ A λ A Þð1 þ θ B λ B Þ<br />
Here, the labeling degrees λ A and λ B equal the amount of protein<br />
A labeled with one fluorophore divided by the total amount of A.<br />
Thus, in contrast to the case of heteromultimerization, the sum<br />
of the two labeling degrees λ A + λ B cannot be >1. In the absence<br />
of unlabeled protein and a 1:1 ratio of both fluorophores, λ A =<br />
λ B = 0.5.<br />
Calculation of Remodeler–Nucleosome Sampling Rates. On the basis<br />
of the parameters measured, the sampling rate for remodeler–<br />
Erdel et al. www.pnas.org/cgi/content/short/1003438107<br />
2of7
nucleosome contacts was determined. The time that a remodeler<br />
spends in the <strong>chromatin</strong>-bound state is τ bound =1/k off , and the<br />
time in the freely diffusible state is τ free = 1/(k on c N ), with k off<br />
and k on being the dissociation/association rates and c N the<br />
nucleosome concentration. Because the concentration of nucleosomes<br />
as potential binding sites is much larger than the remodeler<br />
concentration, the binding process can be described<br />
by a pseudo-first-order reaction. To probe one nucleosome, the<br />
remodeler requires τ search = τ bound + τ free .Forc R being the remodeler<br />
concentration, c R nucleosomes are probed within τ search .<br />
Thus, the minimum sampling time is τ <strong>sample</strong>,min =(c N /c R )τ search =<br />
(c N /c R )·(τ bound + τ free ) if every nucleosome is probed exactly once.<br />
This expression can be reformulated in terms of the pseudoaffinity<br />
K* bin =(k on c N )/k off :<br />
τ <strong>sample</strong>; min ¼<br />
c <br />
N<br />
1 þ 1 <br />
c R k off Kbin<br />
∗ :<br />
Because the concentration of nucleosomes in the cell nucleus has<br />
been measured to be c N = 140 μM (15), the sampling time can be<br />
calculated using the values for the dissociation rate (estimated<br />
from the FRAP analyses, Table 2), the pseudoaffinity (determined<br />
by FCS measurement, Table 3), and the endogenous<br />
remodeler concentration (determined by FCS and Western<br />
blotting, Table S1). Considering that not every nucleosome is<br />
probed exactly once, the actual sampling time turns out to be<br />
larger than the minimum sampling time τ <strong>sample</strong>,min . The remodelers’<br />
mode of action can be regarded as sequential cycles of<br />
searching and binding, each cycle requiring the time τ search . The<br />
fraction of probed remodelers in each cycle is c R /c N . After the<br />
first cycle, p 1 = c R /c N nucleosomes are probed, and after n cycles,<br />
the number of probed nucleosomes can be expressed according<br />
to the binomial distribution:<br />
p n ¼ ∑ n<br />
k¼1<br />
n!<br />
k!ðn − kÞ!<br />
<br />
cR<br />
c N<br />
k <br />
1<br />
<br />
c n − k <br />
R<br />
¼ 1− 1− c n<br />
R<br />
:<br />
c N c N<br />
By inverting this relation, the number of cycles n required for<br />
a given coverage p n equals<br />
n ¼ lnð1 <br />
− p nÞ<br />
:<br />
ln 1− cR<br />
c N<br />
The corresponding sampling time τ <strong>sample</strong>, coverage is the product of<br />
the required cycles n and the search time τ search calculated<br />
above:<br />
τ <strong>sample</strong>; coverage ¼ n <br />
1 þ 1 <br />
k off Kbin<br />
¼<br />
lnð1 − p <br />
<br />
nÞ<br />
1 þ 1 <br />
ln 1 − cR<br />
k off<br />
Kbin<br />
:<br />
The resulting sampling times for 99% nucleosome coverage are<br />
summarized in Table S2. The minimum sampling time τ <strong>sample</strong>, min<br />
corresponds to 63% nucleosome coverage.<br />
c N<br />
<br />
1. Collins N, et al. (2002) An ACF1-<strong>ISWI</strong> <strong>chromatin</strong>-<strong>remodeling</strong> complex is required for<br />
DNA replication through hetero<strong>chromatin</strong>. Nat Genet 32:627–632.<br />
2. Barak O, Lazzaro MA, Cooch NS, Picketts DJ, Shiekhattar R (2004) A tissue-specific,<br />
naturally occurring human SNF2L variant inactivates <strong>chromatin</strong> <strong>remodeling</strong>. J Biol<br />
Chem 279:45130–45138.<br />
3. Barak O, et al. (2003) Isolation of human NURF: A regulator of Engrailed gene<br />
expression. EMBO J 22:6089–6100.<br />
4. Jegou T, et al. (2009) Dynamics of telomeres and promyelocytic leukemia nuclear<br />
bodies in a telomerase-negative human cell line. Mol Biol Cell 20:2070–2082.<br />
5. Gunkel M, et al. (2009) Dual color localization microscopy of cellular nanostructures.<br />
Biotechnol J 4:927–938.<br />
6. Görisch SM, et al. (2004) Nuclear body movement is determined by <strong>chromatin</strong><br />
accessibility and dynamics. Proc Natl Acad Sci USA 101:13221–13226.<br />
7. Längst G, Bonte EJ, Corona DF, Becker PB (1999) Nucleosome movement by CHRAC<br />
and <strong>ISWI</strong> without disruption or trans-displacement of the histone octamer. Cell 97:<br />
843–852.<br />
8. Wachsmuth M, et al. (2003) Analyzing intracellular binding and diffusion with<br />
continuous fluorescence photobleaching. Biophys J 84:3353–3363.<br />
9. Müller KP, et al. (2009) Multiscale analysis of dynamics and interactions of hetero<strong>chromatin</strong><br />
protein 1 by fluorescence fluctuation microscopy. Biophys J 97:2876–2885.<br />
10. Sprague BL, Pego RL, Stavreva DA, McNally JG (2004) Analysis of binding reactions by<br />
fluorescence recovery after photobleaching. Biophys J 86:3473–3495.<br />
11. Pack C, Saito K, Tamura M, Kinjo M (2006) Microenvironment and effect of energy<br />
depletion in the nucleus analyzed by mobility of multiple oligomeric EGFPs. Biophys J<br />
91:3921–3936.<br />
12. Rippe K (2000) Simultaneous binding of two DNA duplexes to the NtrC-enhancer complex<br />
studied by two-color fluorescence cross-correlation spectroscopy. Biochemistry 39:<br />
2131–2139.<br />
13. Strohner R, et al. (2005) A ‘loop recapture’ mechanism for ACF-dependent<br />
nucleosome <strong>remodeling</strong>. Nat Struct Mol Biol 12:683–690.<br />
14. Weidemann T, Wachsmuth M, Tewes M, Rippe K, Langowski J (2002) Analysis of<br />
ligand binding by two-colour fluorescence cross-correlation spectroscopy. Single Mol<br />
3:49–61.<br />
15. Weidemann T, et al. (2003) Counting nucleosomes in living cells with a combination<br />
of fluorescence correlation spectroscopy and confocal imaging. J Mol Biol 334:<br />
229–240.<br />
Erdel et al. www.pnas.org/cgi/content/short/1003438107<br />
3of7
A<br />
Colocalization<br />
Snf2H-GFP<br />
B<br />
GFP-Snf2L<br />
C<br />
H2A-mRFP<br />
H2A-mRFP<br />
Frequency Frequency Frequency<br />
Ratio Snf2H/H2A<br />
Ratio Snf2L/H2A<br />
GFP-Snf2L+13<br />
D<br />
H2A-mRFP<br />
Frequency<br />
Ratio Snf2L+13/H2A<br />
Acf1-GFP<br />
H2A-mRFP<br />
Ratio Acf1/H2A<br />
Fig. S1. Snf2H, Snf2L, Snf2L+13, and Acf1 bind <strong>chromatin</strong> in 3T3 cells. (A–D) Snf2H-GFP, GFP-Snf2L, GFP-Snf2L+13, and Acf1-GFP were transiently transfected<br />
into NIH 3T3 cells stably expressing H2A-RFP. In all cases, colocalization of the GFP-tagged proteins with H2A-RFP was observed, reflecting their ability to bind<br />
<strong>chromatin</strong>. To determine if the proteins were enriched in the dense hetero<strong>chromatin</strong> foci of 3T3 cells, the ratio between the GFP and the RFP signal was<br />
calculated for each pixel and plotted into a histogram. Because the ratio was similar throughout the cell, there was no specific enrichment in hetero<strong>chromatin</strong>.<br />
However, loci with decreased remodeler density were present (white arrows).<br />
Antibody: Snf2H Snf2L+13 Snf2L<br />
GFP protein<br />
transfected: Snf2H — Snf2L+13 — Snf2L — Snf2L+13<br />
MW (kDa)<br />
Fig. S2. Expression level of endogenous remodelers. Quantitative Western blotting was used to determine the relative expression levels of the GFP-tagged<br />
remodelers in the stable U2OS cell lines. (Lanes 1 and 2) U2OS/Snf2H-GFP and U2OS-WT incubated with anti-Snf2H; (lanes 3 and 4) U2OS/GFP-Snf2L+13 and<br />
U2OS-WT incubated with anti-Snf2L+13; (lanes 5 and 6) U2OS/GFP-Snf2L and U2OS-WT incubated with anti-Snf2L; (lane 7) U2OS/GFP-Snf2L+13 incubated with<br />
anti-Snf2L. Ratios between GFP-tagged and endogenous proteins of 2.4 ± 0.3 (lane 1), 1.8 ± 0.1 (lane 3), 0.8 ± 0.1 (lane 5), and 1.8 ± 0.1 (lane 7) were determined.<br />
The predicted molecular weight for Snf2H and Snf2L is 125 kDa, and the predicted molecular weight for GFP-tagged Snf2H/Snf2L is 152 kDa.<br />
Erdel et al. www.pnas.org/cgi/content/short/1003438107<br />
4of7
A<br />
Marker<br />
GFP-Snf2L+13<br />
GFP-Snf2L<br />
Snf2H-GFP<br />
His-Snf2H<br />
His-Snf2L<br />
250 kDa<br />
130 kDa<br />
B<br />
Remodeler<br />
+ATP<br />
His-Snf2H His-Snf2L<br />
ATPase -<br />
ATP + - + + + + + + -<br />
1 2 3 4 5 6 7 8 9<br />
C<br />
Remodelers coupled to beads<br />
His-Snf2H His-Snf2L Snf2H-GFP GFP-Snf2L<br />
ATPase -<br />
-<br />
-<br />
ATP + - + + + + + - + + + - + +<br />
1 2 3 4 5 6 7 8 9 10 11 12 13 14<br />
D<br />
His-Snf2L<br />
-<br />
ATP + + + -<br />
ATPase<br />
GFP-Snf2L<br />
-<br />
+ + + -<br />
GFP-Snf2L+13<br />
-<br />
+ + + -<br />
1 2 3 4 5 6 7 8 9 10 11 12<br />
Fig. S3. Snf2H-GFP and GFP-Snf2L are catalytically active <strong>chromatin</strong> remodelers. (A) Remodeling ATPases were purified from baculovirus-infected Sf9 cells<br />
(His-Snf2H and His-Snf2L) or purified from transiently transfected HEK293T cells (Snf2H-GFP, GFP-Snf2L, and GFP-Snf2L+13). Purified proteins were analyzed by<br />
6% SDS/PAGE and Coomassie blue staining. (B) Snf2H and Snf2L efficiently move nucleosomes from the center to more lateral positions of the nucleosomal 601<br />
DNA containing 40 bp of DNA linkers on each side of the 601 sequence. Nucleosomes were incubated with increasing concentrations of Snf2H and Snf2L, in the<br />
presence (lanes 3–8) or in the absence of ATP (lanes 2 and 9). Nucleosome positions are indicated. (C) Bead-bound Snf2H and Snf2L exhibit reduced <strong>remodeling</strong><br />
activity. His-tagged Snf2H and Snf2L coupled to beads were used in <strong>remodeling</strong> reactions as described in B. Nucleosome <strong>remodeling</strong> activities of the recombinant<br />
ATPases were significantly reduced (lanes 1–6) and comparable to the activity of the purified GFP-tagged, bead-bound Snf2H and Snf2L proteins<br />
(lanes 7–14). Similar protein levels were used and nucleosome <strong>remodeling</strong> was analyzed on 6% polyacrylamide gels. (D) The activities of the three Snf2L<br />
ATPases (His-Snf2L, GFP-Snf2L, and GFP-Snf2L+13) were compared on the nucleosomal 601 DNA, placing the nucleosome at the border of a 208-bp-long DNA<br />
fragment (lanes 1, 5, and 9). The 601 nucleosome was incubated with the indicated remodelers in the absence or the presence of ATP and the <strong>remodeling</strong><br />
reaction was analyzed as in C.<br />
GFP<br />
pre UV<br />
post UV<br />
PCNA-RFP<br />
5 µm<br />
Fig. S4. GFP control for microirradiation experiments. Confocal images of the distribution of the isolated GFP protein are shown for the case of DNA damage.<br />
No GFP enrichment was observed at the DNA repair site where PCNA accumulated.<br />
Erdel et al. www.pnas.org/cgi/content/short/1003438107<br />
5of7
A<br />
Snf2H-GFP RFP-Snf2H Merge<br />
B<br />
1.0<br />
RFP-Snf2H<br />
C<br />
1.0<br />
RFP-Snf2H<br />
intensity (%)<br />
0.8<br />
0.6<br />
0.4<br />
N ormalized G( )<br />
0.8<br />
0.6<br />
0.4<br />
0.2<br />
D eff = 1.6 ± 0.2 µm2/s<br />
0.2<br />
D eff = 2.6 ± 0.4 µm2/s<br />
5 10 15 20 25 30 35 40<br />
t (s)<br />
10 2 10 3 10 4 10 5 10 6<br />
(µs)<br />
Fig. S5. RFP-Snf2H and Snf2H-GFP were indistinguishable. To verify that the GFP tag did not have a strong impact on Snf2H localization or dynamics, RFP-Snf2H<br />
was compared with Snf2H-GFP. (A) RFP-Snf2H and Snf2H-GFP colocalized in murine 3T3 cells. (B) RFP-Snf2H displayed an effective diffusion behavior in FRAP<br />
experiments, and virtually no immobile fraction was detected. (C) RFP-Snf2H behaved similarly to Snf2H-GFP in FCS experiments; for small lag times subtle differences<br />
between the autocorrelation functions of GFP- or RFP-tagged Snf2H were present, which arise from different photophysics (dark states in TagRFP).<br />
A<br />
intensity (%)<br />
1.0<br />
0.8<br />
0.6<br />
0.4<br />
GFP-Snf2L+13<br />
GFP-Snf2L<br />
B<br />
N ormalized G( )<br />
1.0<br />
0.8<br />
0.6<br />
0.4<br />
GFP-Snf2L<br />
0.2<br />
0.2<br />
GFP-Snf2L+13<br />
0 5 10 15 20 25 30 35<br />
t (s)<br />
10 2 10 3 10 4 10 5<br />
(µs)<br />
10 6<br />
Fig. S6. Snf2H-GFP and GFP-Snf2L behave in HEK293T cells as in U2OS cells. The dynamics of GFP-Snf2L and GFP-Snf2L+13 were analyzed in HEK293T cells<br />
using FRAP (A) and FCS (B). In contrast to U2OS cells, HEK293T cells express active Snf2L. The two proteins displayed the same mobility in the two cell lines.<br />
Erdel et al. www.pnas.org/cgi/content/short/1003438107<br />
6of7
Table S1.<br />
Nuclear concentrations of GFP-tagged and endogenous proteins in U2OS cells<br />
Protein GFP-tagged protein, μM Ratio GFP-tagged/ endogenous protein Endogenous protein, μM<br />
Snf2H-GFP 2.0 ± 0.1 2.4 ± 0.3 0.83 ± 0.13<br />
GFP-Snf2L 0.5 ± 0.1 >10 0.15 ± 0.03