- Page 2 and 3: Econometric Analysis of Cross Secti
- Page 4 and 5: vi Contents II LINEAR MODELS 47 4 T
- Page 6 and 7: viii Contents 7.8 The Linear Panel
- Page 8 and 9: x Contents 10.6.3 Testing for Seria
- Page 10 and 11: xii Contents 13.9 Panel Data Models
- Page 12 and 13: xiv Contents 16.8.3 Dynamic Unobser
- Page 14 and 15: xvi Contents 20 Duration Analysis 6
- Page 16 and 17: Preface This book is intended prima
- Page 18 and 19: Preface xix siderably with methods
- Page 20 and 21: Preface xxi On an organizational no
- Page 22 and 23: 1 Introduction 1.1 Causal Relations
- Page 24 and 25: Introduction 5 interpreting assumpt
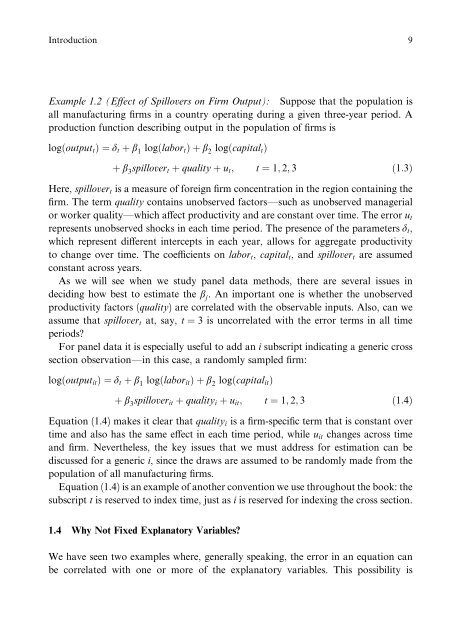
- Page 26 and 27: Introduction 7 section dimension. T
- Page 30 and 31: Introduction 11 does it depend on x
- Page 32 and 33: 14 Chapter 2 conditional expectatio
- Page 34 and 35: 16 Chapter 2 Example 2.1 (continued
- Page 36 and 37: 18 Chapter 2 q log½Eðy j xÞŠ 10
- Page 38 and 39: 20 Chapter 2 For many purposes we n
- Page 40 and 41: 22 Chapter 2 This equation shows th
- Page 42 and 43: 24 Chapter 2 because we assume that
- Page 44 and 45: 26 Chapter 2 The linear projection
- Page 46 and 47: 28 Chapter 2 c. Suppose that x has
- Page 48 and 49: 30 Chapter 2 property CE.4: If fðx
- Page 50 and 51: 32 Chapter 2 2.A.3 Properties of Li
- Page 52 and 53: 34 Chapter 2 Define the 1 K vector
- Page 54 and 55: 36 Chapter 3 3.2 Convergence in Pro
- Page 56 and 57: 38 Chapter 3 (1) Z 1 N exists w.p.a
- Page 58 and 59: 40 Chapter 3 theorem 3.2 (Lindeberg
- Page 60 and 61: 42 Chapter 3 consistency certainly
- Page 62 and 63: 44 Chapter 3 For testing the null h
- Page 64 and 65: 46 Chapter 3 pffiffiffiffi p b. ffi
- Page 66 and 67: 4 The Single-Equation Linear Model
- Page 68 and 69: The Single-Equation Linear Model an
- Page 70 and 71: The Single-Equation Linear Model an
- Page 72 and 73: The Single-Equation Linear Model an
- Page 74 and 75: The Single-Equation Linear Model an
- Page 76 and 77: The Single-Equation Linear Model an
- Page 78 and 79:
The Single-Equation Linear Model an
- Page 80 and 81:
The Single-Equation Linear Model an
- Page 82 and 83:
The Single-Equation Linear Model an
- Page 84 and 85:
The Single-Equation Linear Model an
- Page 86 and 87:
The Single-Equation Linear Model an
- Page 88 and 89:
The Single-Equation Linear Model an
- Page 90 and 91:
The Single-Equation Linear Model an
- Page 92 and 93:
The Single-Equation Linear Model an
- Page 94 and 95:
The Single-Equation Linear Model an
- Page 96 and 97:
The Single-Equation Linear Model an
- Page 98 and 99:
The Single-Equation Linear Model an
- Page 100 and 101:
84 Chapter 5 coe‰cient on z 1 is
- Page 102 and 103:
86 Chapter 5 collinearity in z in t
- Page 104 and 105:
88 Chapter 5 two di¤erent, often c
- Page 106 and 107:
90 Chapter 5 5.1.2 Multiple Instrum
- Page 108 and 109:
92 Chapter 5 What is the analogue o
- Page 110 and 111:
94 Chapter 5 equation (5.7) by x 0
- Page 112 and 113:
96 Chapter 5 Example 5.3 (Parents
- Page 114 and 115:
98 Chapter 5 aware that the normal
- Page 116 and 117:
100 Chapter 5 typical case. Under H
- Page 118 and 119:
102 Chapter 5 where Corrð ; Þ den
- Page 120 and 121:
104 Chapter 5 large. This is anothe
- Page 122 and 123:
106 Chapter 5 This assumption conta
- Page 124 and 125:
108 Chapter 5 y 1 ¼ z 1 d 1 þ a 1
- Page 126 and 127:
110 Chapter 5 5.5. One occasionally
- Page 128 and 129:
112 Chapter 5 pffiffiffiffi a. Unde
- Page 130 and 131:
6 Additional Single-Equation Topics
- Page 132 and 133:
Additional Single-Equation Topics 1
- Page 134 and 135:
Additional Single-Equation Topics 1
- Page 136 and 137:
Additional Single-Equation Topics 1
- Page 138 and 139:
Additional Single-Equation Topics 1
- Page 140 and 141:
Additional Single-Equation Topics 1
- Page 142 and 143:
Additional Single-Equation Topics 1
- Page 144 and 145:
Additional Single-Equation Topics 1
- Page 146 and 147:
Additional Single-Equation Topics 1
- Page 148 and 149:
Additional Single-Equation Topics 1
- Page 150 and 151:
Additional Single-Equation Topics 1
- Page 152 and 153:
Additional Single-Equation Topics 1
- Page 154 and 155:
Additional Single-Equation Topics 1
- Page 156 and 157:
Additional Single-Equation Topics 1
- Page 158 and 159:
144 Chapter 7 y 1 ¼ x 1 b 1 þ u 1
- Page 160 and 161:
146 Chapter 7 section unit. Here we
- Page 162 and 163:
148 Chapter 7 Note that the dimensi
- Page 164 and 165:
150 Chapter 7 X N i¼1 0 xi1 0 x i1
- Page 166 and 167:
152 Chapter 7 The asymptotic varian
- Page 168 and 169:
154 Chapter 7 assumption SGLS.1: E
- Page 170 and 171:
156 Chapter 7 where we have also us
- Page 172 and 173:
158 Chapter 7 where ^u^u i 1 y i X
- Page 174 and 175:
160 Chapter 7 But if N is small rel
- Page 176 and 177:
162 Chapter 7 We obtain an estimato
- Page 178 and 179:
164 Chapter 7 e‰cient as system O
- Page 180 and 181:
166 Chapter 7 Table 7.1 An Estimate
- Page 182 and 183:
168 Chapter 7 Because of regional v
- Page 184 and 185:
170 Chapter 7 7.8.1 Assumptions for
- Page 186 and 187:
172 Chapter 7 y it on x it ; t ¼ 1
- Page 188 and 189:
174 Chapter 7 The variable cumgpa i
- Page 190 and 191:
176 Chapter 7 unconditional). The r
- Page 192 and 193:
178 Chapter 7 The test statistic is
- Page 194 and 195:
180 Chapter 7 pffiffiffiffi 7.4. Us
- Page 196 and 197:
182 Chapter 7 b. Add a one-year lag
- Page 198 and 199:
184 Chapter 8 A wage o¤er function
- Page 200 and 201:
186 Chapter 8 that is, by using a s
- Page 202 and 203:
188 Chapter 8 which has dimension G
- Page 204 and 205:
190 Chapter 8 " X # " # N 0 min Zi
- Page 206 and 207:
192 Chapter 8 When we plug equation
- Page 208 and 209:
194 Chapter 8 where ^u i 1 y i X i
- Page 210 and 211:
196 Chapter 8 theorem 8.4 (Optimali
- Page 212 and 213:
198 Chapter 8 exogenous in all equa
- Page 214 and 215:
200 Chapter 8 Let ^b again be the G
- Page 216 and 217:
202 Chapter 8 to the statistical si
- Page 218 and 219:
204 Chapter 8 Under homoskedasticit
- Page 220 and 221:
206 Chapter 8 a. Suppose that Eðx
- Page 222 and 223:
208 Chapter 8 e¤ectively the null
- Page 224 and 225:
210 Chapter 9 absence of omitted va
- Page 226 and 227:
212 Chapter 9 across di¤erent equa
- Page 228 and 229:
214 Chapter 9 The condition for ide
- Page 230 and 231:
216 Chapter 9 where u 1 ðu 1 ; ...
- Page 232 and 233:
218 Chapter 9 Given the linear rest
- Page 234 and 235:
220 Chapter 9 R 1 ¼ 0 0 0 0 1 0 0
- Page 236 and 237:
222 Chapter 9 When estimating a sim
- Page 238 and 239:
224 Chapter 9 It would be more e‰
- Page 240 and 241:
226 Chapter 9 where each z j is unc
- Page 242 and 243:
228 Chapter 9 where the notation u
- Page 244 and 245:
230 Chapter 9 system. Technically,
- Page 246 and 247:
232 Chapter 9 Before considering eq
- Page 248 and 249:
234 Chapter 9 2. Apply the rank con
- Page 250 and 251:
236 Chapter 9 where we have dropped
- Page 252 and 253:
238 Chapter 9 Equation (9.28) is st
- Page 254 and 255:
240 Chapter 9 e. For a family, y 1
- Page 256 and 257:
242 Chapter 9 d. Argue that, under
- Page 258 and 259:
244 Chapter 9 9.11. Consider a two-
- Page 260 and 261:
10 Basic Linear Unobserved E¤ects
- Page 262 and 263:
Basic Linear Unobserved E¤ects Pan
- Page 264 and 265:
Basic Linear Unobserved E¤ects Pan
- Page 266 and 267:
Basic Linear Unobserved E¤ects Pan
- Page 268 and 269:
Basic Linear Unobserved E¤ects Pan
- Page 270 and 271:
Basic Linear Unobserved E¤ects Pan
- Page 272 and 273:
Basic Linear Unobserved E¤ects Pan
- Page 274 and 275:
Basic Linear Unobserved E¤ects Pan
- Page 276 and 277:
Basic Linear Unobserved E¤ects Pan
- Page 278 and 279:
Basic Linear Unobserved E¤ects Pan
- Page 280 and 281:
Basic Linear Unobserved E¤ects Pan
- Page 282 and 283:
Basic Linear Unobserved E¤ects Pan
- Page 284 and 285:
Basic Linear Unobserved E¤ects Pan
- Page 286 and 287:
Basic Linear Unobserved E¤ects Pan
- Page 288 and 289:
Basic Linear Unobserved E¤ects Pan
- Page 290 and 291:
Basic Linear Unobserved E¤ects Pan
- Page 292 and 293:
Basic Linear Unobserved E¤ects Pan
- Page 294 and 295:
Basic Linear Unobserved E¤ects Pan
- Page 296 and 297:
Basic Linear Unobserved E¤ects Pan
- Page 298 and 299:
Basic Linear Unobserved E¤ects Pan
- Page 300 and 301:
Basic Linear Unobserved E¤ects Pan
- Page 302 and 303:
Basic Linear Unobserved E¤ects Pan
- Page 304 and 305:
Basic Linear Unobserved E¤ects Pan
- Page 306 and 307:
Basic Linear Unobserved E¤ects Pan
- Page 308 and 309:
Basic Linear Unobserved E¤ects Pan
- Page 310 and 311:
Basic Linear Unobserved E¤ects Pan
- Page 312 and 313:
300 Chapter 11 Given model (11.1),
- Page 314 and 315:
302 Chapter 11 Cauchy-Schwartz ineq
- Page 316 and 317:
304 Chapter 11 Even with large T, t
- Page 318 and 319:
306 Chapter 11 w is only for s a t;
- Page 320 and 321:
308 Chapter 11 but where we allow w
- Page 322 and 323:
310 Chapter 11 where y t denotes di
- Page 324 and 325:
312 Chapter 11 plim N!y ^b POLS ¼
- Page 326 and 327:
314 Chapter 11 Assumption (11.37) o
- Page 328 and 329:
316 Chapter 11 One approach to esti
- Page 330 and 331:
318 Chapter 11 y it ¼ z it a i þ
- Page 332 and 333:
320 Chapter 11 Under Assumption FE.
- Page 334 and 335:
322 Chapter 11 The estimator ^a in
- Page 336 and 337:
324 Chapter 11 place the unobserved
- Page 338 and 339:
326 Chapter 11 Eðu it j z i ; x i1
- Page 340 and 341:
328 Chapter 11 ð€x it ; z i1 ; x
- Page 342 and 343:
330 Chapter 11 One complication tha
- Page 344 and 345:
332 Chapter 11 Problems 11.1. Let y
- Page 346 and 347:
334 Chapter 11 b. If you apply the
- Page 348 and 349:
336 Chapter 11 Specifically, di¤er
- Page 350 and 351:
338 Chapter 11 Eðc i j w i ; z i ;
- Page 352 and 353:
340 Part III The analysis of maximu
- Page 354 and 355:
342 Chapter 12 y o1 ¼ 4 and y o2
- Page 356 and 357:
344 Chapter 12 where u is defined i
- Page 358 and 359:
346 Chapter 12 would typically hold
- Page 360 and 361:
348 Chapter 12 one solution; identi
- Page 362 and 363:
350 Chapter 12 The notation H € i
- Page 364 and 365:
352 Chapter 12 where ‘ y denotes
- Page 366 and 367:
354 Chapter 12 condition, we need t
- Page 368 and 369:
356 Chapter 12 bias are two-step M-
- Page 370 and 371:
358 Chapter 12 equation (12.4). Und
- Page 372 and 373:
360 Chapter 12 or ^V ¼ ^s 2 X N i
- Page 374 and 375:
362 Chapter 12 ^D 1 N 1 XN ^g i^g i
- Page 376 and 377:
364 Chapter 12 restrictions define
- Page 378 and 379:
366 Chapter 12 a P Q matrix E with
- Page 380 and 381:
368 Chapter 12 probably correlated
- Page 382 and 383:
370 Chapter 12 where H € i is the
- Page 384 and 385:
372 Chapter 12 Consider the Wald st
- Page 386 and 387:
374 Chapter 12 in many cases they a
- Page 388 and 389:
376 Chapter 12 The term multiplying
- Page 390 and 391:
378 Chapter 12 We can also see how
- Page 392 and 393:
380 Chapter 12 where the error u i
- Page 394 and 395:
382 Chapter 12 a. If you apply pool
- Page 396 and 397:
384 Chapter 12 pffiffiffiffi pffiff
- Page 398 and 399:
386 Chapter 13 density, we would ha
- Page 400 and 401:
388 Chapter 13 We can easily obtain
- Page 402 and 403:
390 Chapter 13 We can apply inequal
- Page 404 and 405:
392 Chapter 13 relaxed, but doing s
- Page 406 and 407:
394 Chapter 13 Example 13.2 (contin
- Page 408 and 409:
396 Chapter 13 Thus, Avârð^yÞ ca
- Page 410 and 411:
398 Chapter 13 evaluate this vector
- Page 412 and 413:
400 Chapter 13 or E y ½‘ y g i
- Page 414 and 415:
402 Chapter 13 slight notational ch
- Page 416 and 417:
404 Chapter 13 tained, often implic
- Page 418 and 419:
406 Chapter 13 This situation is en
- Page 420 and 421:
408 Chapter 13 discuss a su‰cient
- Page 422 and 423:
410 Chapter 13 be correlated within
- Page 424 and 425:
412 Chapter 13 Now the problem beco
- Page 426 and 427:
414 Chapter 13 focus on the former
- Page 428 and 429:
416 Chapter 13 a. What is the joint
- Page 430 and 431:
418 Chapter 13 c. Under the same as
- Page 432 and 433:
420 Chapter 13 property CD.3: For r
- Page 434 and 435:
422 Chapter 14 " # 0 " # Q N ðyÞ
- Page 436 and 437:
424 Chapter 14 As in the linear cas
- Page 438 and 439:
426 Chapter 14 additional moment co
- Page 440 and 441:
428 Chapter 14 3SLS estimator in li
- Page 442 and 443:
430 Chapter 14 " X # ! N 0 1 " # mi
- Page 444 and 445:
432 Chapter 14 where w ¼ðw 1 ; ..
- Page 446 and 447:
434 Chapter 14 along with equation
- Page 448 and 449:
436 Chapter 14 models with unobserv
- Page 450 and 451:
438 Chapter 14 for some t A T and
- Page 452 and 453:
440 Chapter 14 where x i A R K is a
- Page 454 and 455:
442 Chapter 14 portant example wher
- Page 456 and 457:
444 Chapter 14 The proof that ^X 1
- Page 458 and 459:
446 Chapter 14 regressors appear in
- Page 460 and 461:
448 Chapter 14 the CMD estimator ba
- Page 462 and 463:
IV NONLINEAR MODELS AND RELATED TOP
- Page 464 and 465:
454 Chapter 15 and that in basic st
- Page 466 and 467:
456 Chapter 15 inclusive (kidsge6);
- Page 468 and 469:
458 Chapter 15 There is no particul
- Page 470 and 471:
460 Chapter 15 15.4 Maximum Likelih
- Page 472 and 473:
462 Chapter 15 where x is 1 K and
- Page 474 and 475:
464 Chapter 15 Pðy ¼ 1 j xÞ ¼P
- Page 476 and 477:
466 Chapter 15 Often we want to est
- Page 478 and 479:
468 Chapter 15 Table 15.1 LPM, Logi
- Page 480 and 481:
470 Chapter 15 15.7 Specification I
- Page 482 and 483:
472 Chapter 15 when it is independe
- Page 484 and 485:
474 Chapter 15 distributed with Eð
- Page 486 and 487:
476 Chapter 15 conditional on z, re
- Page 488 and 489:
478 Chapter 15 Pðy 1 ¼ 1 j y 2 ¼
- Page 490 and 491:
480 Chapter 15 Relaxing distributio
- Page 492 and 493:
482 Chapter 15 tains some recent re
- Page 494 and 495:
484 Chapter 15 second equality is t
- Page 496 and 497:
486 Chapter 15 approximating the in
- Page 498 and 499:
488 Chapter 15 As in the linear cas
- Page 500 and 501:
490 Chapter 15 lagged dependent var
- Page 502 and 503:
492 Chapter 15 (1997), the MLE of b
- Page 504 and 505:
494 Chapter 15 c i as parameters to
- Page 506 and 507:
496 Chapter 15 model (15.66) are id
- Page 508 and 509:
498 Chapter 15 (15.77) shows that e
- Page 510 and 511:
500 Chapter 15 15.9.2 Probabilistic
- Page 512 and 513:
502 Chapter 15 tives. A well-known
- Page 514 and 515:
504 Chapter 15 conditions, but the
- Page 516 and 517:
506 Chapter 15 itself, is of limite
- Page 518 and 519:
508 Chapter 15 hood estimation is p
- Page 520 and 521:
510 Chapter 15 b. What happens if y
- Page 522 and 523:
512 Chapter 15 15.7. Use the data i
- Page 524 and 525:
514 Chapter 15 correlation within f
- Page 526 and 527:
516 Chapter 15 d. Now estimate a dy
- Page 528 and 529:
518 Chapter 16 Data censoring also
- Page 530 and 531:
520 Chapter 16 The wealth example c
- Page 532 and 533:
522 Chapter 16 where fðÞ is the s
- Page 534 and 535:
524 Chapter 16 probability of obser
- Page 536 and 537:
526 Chapter 16 (As in recent chapte
- Page 538 and 539:
528 Chapter 16 Table 16.1 OLS and T
- Page 540 and 541:
530 Chapter 16 where q is an unobse
- Page 542 and 543:
532 Chapter 16 equation, and so the
- Page 544 and 545:
534 Chapter 16 the latent variable
- Page 546 and 547:
536 Chapter 16 Powell’s method al
- Page 548 and 549:
538 Chapter 16 f ðy j x; y > 0Þ
- Page 550 and 551:
540 Chapter 16 does not a¤ect the
- Page 552 and 553:
542 Chapter 16 Normalð0; sa 2Þ di
- Page 554 and 555:
544 Chapter 16 assumptions are made
- Page 556 and 557:
546 Chapter 16 a. Using only the da
- Page 558 and 559:
548 Chapter 16 and regular apples.
- Page 560 and 561:
17 Sample Selection, Attrition, and
- Page 562 and 563:
Sample Selection, Attrition, and St
- Page 564 and 565:
Sample Selection, Attrition, and St
- Page 566 and 567:
Sample Selection, Attrition, and St
- Page 568 and 569:
Sample Selection, Attrition, and St
- Page 570 and 571:
Sample Selection, Attrition, and St
- Page 572 and 573:
Sample Selection, Attrition, and St
- Page 574 and 575:
Sample Selection, Attrition, and St
- Page 576 and 577:
Sample Selection, Attrition, and St
- Page 578 and 579:
Sample Selection, Attrition, and St
- Page 580 and 581:
Sample Selection, Attrition, and St
- Page 582 and 583:
Sample Selection, Attrition, and St
- Page 584 and 585:
Sample Selection, Attrition, and St
- Page 586 and 587:
Sample Selection, Attrition, and St
- Page 588 and 589:
Sample Selection, Attrition, and St
- Page 590 and 591:
Sample Selection, Attrition, and St
- Page 592 and 593:
Sample Selection, Attrition, and St
- Page 594 and 595:
Sample Selection, Attrition, and St
- Page 596 and 597:
Sample Selection, Attrition, and St
- Page 598 and 599:
Sample Selection, Attrition, and St
- Page 600 and 601:
Sample Selection, Attrition, and St
- Page 602 and 603:
Sample Selection, Attrition, and St
- Page 604 and 605:
Sample Selection, Attrition, and St
- Page 606 and 607:
Sample Selection, Attrition, and St
- Page 608 and 609:
Sample Selection, Attrition, and St
- Page 610 and 611:
Sample Selection, Attrition, and St
- Page 612 and 613:
604 Chapter 18 ‘‘treatment’
- Page 614 and 615:
606 Chapter 18 ATE is simple. Using
- Page 616 and 617:
608 Chapter 18 17.7.3 in the contex
- Page 618 and 619:
610 Chapter 18 Nevertheless, we wil
- Page 620 and 621:
612 Chapter 18 Therefore, by iterat
- Page 622 and 623:
614 Chapter 18 Obtaining a standard
- Page 624 and 625:
616 Chapter 18 E½wðy 1 y 0 ÞŠ
- Page 626 and 627:
618 Chapter 18 pffiffiffiffi w from
- Page 628 and 629:
620 Chapter 18 Example 18.2, we hav
- Page 630 and 631:
622 Chapter 18 Under parts a and b
- Page 632 and 633:
624 Chapter 18 model to be correct.
- Page 634 and 635:
626 Chapter 18 where a is the ATE a
- Page 636 and 637:
628 Chapter 18 Even if Assumption A
- Page 638 and 639:
630 Chapter 18 The term ^f i 1 fð^
- Page 640 and 641:
632 Chapter 18 along with the assum
- Page 642 and 643:
634 Chapter 18 statuses we would ob
- Page 644 and 645:
636 Chapter 18 where the second-to-
- Page 646 and 647:
638 Chapter 18 If the treatment is
- Page 648 and 649:
640 Chapter 18 functions of x and V
- Page 650 and 651:
642 Chapter 18 Heckman and Vytlacil
- Page 652 and 653:
644 Chapter 18 b. If w given ðx; z
- Page 654 and 655:
646 Chapter 19 assumption in count
- Page 656 and 657:
648 Chapter 19 where x is 1 K and
- Page 658 and 659:
650 Chapter 19 It is easily seen th
- Page 660 and 661:
652 Chapter 19 Table 19.1 OLS and P
- Page 662 and 663:
654 Chapter 19 the restricted estim
- Page 664 and 665:
656 Chapter 19 (1991b) that p remov
- Page 666 and 667:
658 Chapter 19 implies overdispersi
- Page 668 and 669:
660 Chapter 19 As in the case of un
- Page 670 and 671:
662 Chapter 19 Given explanatory va
- Page 672 and 673:
664 Chapter 19 and that e 1 is unco
- Page 674 and 675:
666 Chapter 19 If we assume that c
- Page 676 and 677:
668 Chapter 19 in the selected samp
- Page 678 and 679:
670 Chapter 19 ^B ¼ N 1 XN s i ð
- Page 680 and 681:
672 Chapter 19 exogeneity assumptio
- Page 682 and 683:
674 Chapter 19 the pooled Poisson e
- Page 684 and 685:
676 Chapter 19 s i ðbÞ 1 ‘ b l
- Page 686 and 687:
678 Chapter 19 e¤ects Poisson soft
- Page 688 and 689:
680 Chapter 19 b. If Varðy i j x i
- Page 690 and 691:
682 Chapter 19 19.9. Use the data i
- Page 692 and 693:
20 Duration Analysis 20.1 Introduct
- Page 694 and 695:
Duration Analysis 687 The survivor
- Page 696 and 697:
Duration Analysis 689 which is the
- Page 698 and 699:
Duration Analysis 691 Typically, k
- Page 700 and 701:
Duration Analysis 693 The definitio
- Page 702 and 703:
Duration Analysis 695 unemployed du
- Page 704 and 705:
Duration Analysis 697 Because the h
- Page 706 and 707:
Duration Analysis 699 log of the du
- Page 708 and 709:
Duration Analysis 701 Under the ass
- Page 710 and 711:
Duration Analysis 703 x i and has a
- Page 712 and 713:
Duration Analysis 705 GðÞ is the
- Page 714 and 715:
Duration Analysis 707 with covariat
- Page 716 and 717:
Duration Analysis 709 at most depen
- Page 718 and 719:
Duration Analysis 711 survivor func
- Page 720 and 721:
Duration Analysis 713 m ¼ 1; ...;
- Page 722 and 723:
Duration Analysis 715 unemployment
- Page 724 and 725:
Duration Analysis 717 20.5. In this
- Page 726 and 727:
Duration Analysis 719 respectively,
- Page 728 and 729:
722 References Ashenfelter, O., and
- Page 730 and 731:
724 References Cox, D. R. (1972),
- Page 732 and 733:
726 References Gurmu, S., and P. K.
- Page 734 and 735:
728 References Horowitz, J. L. (199
- Page 736 and 737:
730 References Maloney, M. T., and
- Page 738 and 739:
732 References Phillips, P. C. B.,
- Page 740 and 741:
734 References Vella, F., and M. Ve