Effects of Surface Geology on Seismic Motion - ESG4 Conference ...
Effects of Surface Geology on Seismic Motion - ESG4 Conference ...
Effects of Surface Geology on Seismic Motion - ESG4 Conference ...

Create successful ePaper yourself
Turn your PDF publications into a flip-book with our unique Google optimized e-Paper software.
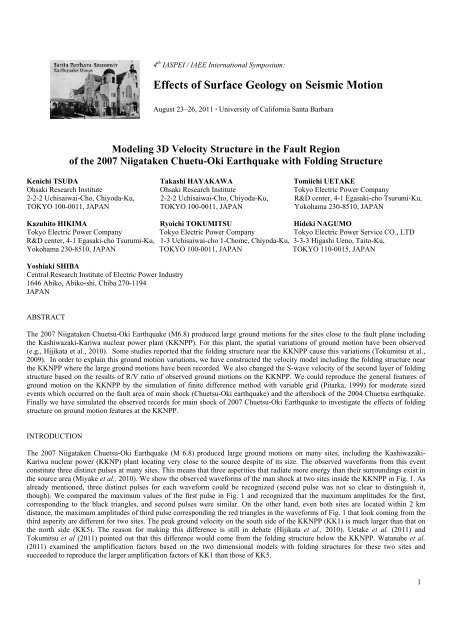
4 th IASPEI / IAEE Internati<strong>on</strong>al Symposium:<br />
<str<strong>on</strong>g>Effects</str<strong>on</strong>g> <str<strong>on</strong>g>of</str<strong>on</strong>g> <str<strong>on</strong>g>Surface</str<strong>on</strong>g> <str<strong>on</strong>g>Geology</str<strong>on</strong>g> <strong>on</strong> <strong>Seismic</strong> Moti<strong>on</strong><br />
August 23–26, 2011 · University <str<strong>on</strong>g>of</str<strong>on</strong>g> California Santa Barbara<br />
Modeling 3D Velocity Structure in the Fault Regi<strong>on</strong><br />
<str<strong>on</strong>g>of</str<strong>on</strong>g> the 2007 Niigataken Chuetu-Oki Earthquake with Folding Structure<br />
Kenichi TSUDA Takashi HAYAKAWA Tomiichi UETAKE<br />
Ohsaki Research Institute Ohsaki Research Institute Tokyo Electric Power Company<br />
2-2-2 Uchisaiwai-Cho, Chiyoda-Ku, 2-2-2 Uchisaiwai-Cho, Chiyoda-Ku, R&D center, 4-1 Egasaki-cho Tsurumi-Ku,<br />
TOKYO 100-0011, JAPAN TOKYO 100-0011, JAPAN Yokohama 230-8510, JAPAN<br />
Kazuhito HIKIMA Ryoichi TOKUMITSU Hideki NAGUMO<br />
Tokyo Electric Power Company Tokyo Electric Power Company Tokyo Electric Power Service CO., LTD<br />
R&D center, 4-1 Egasaki-cho Tsurumi-Ku, 1-3 Uchisaiwai-cho 1-Chome, Chiyoda-Ku, 3-3-3 Higashi Ueno, Taito-Ku,<br />
Yokohama 230-8510, JAPAN TOKYO 100-0011, JAPAN TOKYO 110-0015, JAPAN<br />
Yoshiaki SHIBA<br />
Central Research Institute <str<strong>on</strong>g>of</str<strong>on</strong>g> Electric Power Industry<br />
1646 Abiko, Abiko-shi, Chiba 270-1194<br />
JAPAN<br />
ABSTRACT<br />
The 2007 Niigataken Chuetsu-Oki Earthquake (M6.8) produced large ground moti<strong>on</strong>s for the sites close to the fault plane including<br />
the Kashiwazaki-Kariwa nuclear power plant (KKNPP). For this plant, the spatial variati<strong>on</strong>s <str<strong>on</strong>g>of</str<strong>on</strong>g> ground moti<strong>on</strong> have been observed<br />
(e.g., Hijikata et al., 2010). Some studies reported that the folding structure near the KKNPP cause this variati<strong>on</strong>s (Tokumitsu et al.,<br />
2009). In order to explain this ground moti<strong>on</strong> variati<strong>on</strong>s, we have c<strong>on</strong>structed the velocity model including the folding structure near<br />
the KKNPP where the large ground moti<strong>on</strong>s have been recorded. We also changed the S-wave velocity <str<strong>on</strong>g>of</str<strong>on</strong>g> the sec<strong>on</strong>d layer <str<strong>on</strong>g>of</str<strong>on</strong>g> folding<br />
structure based <strong>on</strong> the results <str<strong>on</strong>g>of</str<strong>on</strong>g> R/V ratio <str<strong>on</strong>g>of</str<strong>on</strong>g> observed ground moti<strong>on</strong>s <strong>on</strong> the KKNPP. We could reproduce the general features <str<strong>on</strong>g>of</str<strong>on</strong>g><br />
ground moti<strong>on</strong> <strong>on</strong> the KKNPP by the simulati<strong>on</strong> <str<strong>on</strong>g>of</str<strong>on</strong>g> finite difference method with variable grid (Pitarka, 1999) for moderate sized<br />
events which occurred <strong>on</strong> the fault area <str<strong>on</strong>g>of</str<strong>on</strong>g> main shock (Chuetsu-Oki earthquake) and the aftershock <str<strong>on</strong>g>of</str<strong>on</strong>g> the 2004 Chuetsu earthquake.<br />
Finally we have simulated the observed records for main shock <str<strong>on</strong>g>of</str<strong>on</strong>g> 2007 Chuetsu-Oki Earthquake to investigate the effects <str<strong>on</strong>g>of</str<strong>on</strong>g> folding<br />
structure <strong>on</strong> ground moti<strong>on</strong> features at the KKNPP.<br />
INTRODUCTION<br />
The 2007 Niigataken Chuetsu-Oki Earthquake (M 6.8) produced large ground moti<strong>on</strong>s <strong>on</strong> many sites, including the Kashiwazaki-<br />
Kariwa nuclear power (KKNP) plant locating very close to the source despite <str<strong>on</strong>g>of</str<strong>on</strong>g> its size. The observed waveforms from this event<br />
c<strong>on</strong>stitute three distinct pulses at many sites. This means that three asperities that radiate more energy than their surroundings exist in<br />
the source area (Miyake et al., 2010). We show the observed waveforms <str<strong>on</strong>g>of</str<strong>on</strong>g> the man shock at two sites inside the KKNPP in Fig. 1. As<br />
already menti<strong>on</strong>ed, three distinct pulses for each waveform could be recognized (sec<strong>on</strong>d pulse was not so clear to distinguish it,<br />
though). We compared the maximum values <str<strong>on</strong>g>of</str<strong>on</strong>g> the first pulse in Fig. 1 and recognized that the maximum amplitudes for the first,<br />
corresp<strong>on</strong>ding to the black triangles, and sec<strong>on</strong>d pulses were similar. On the other hand, even both sites are located within 2 km<br />
distance, the maximum amplitudes <str<strong>on</strong>g>of</str<strong>on</strong>g> third pulse corresp<strong>on</strong>ding the red triangles in the waveforms <str<strong>on</strong>g>of</str<strong>on</strong>g> Fig. 1 that look coming from the<br />
third asperity are different for two sites. The peak ground velocity <strong>on</strong> the south side <str<strong>on</strong>g>of</str<strong>on</strong>g> the KKNPP (KK1) is much larger than that <strong>on</strong><br />
the north side (KK5). The reas<strong>on</strong> for making this difference is still in debate (Hijikata et al., 2010). Uetake et al. (2011) and<br />
Tokumitsu et al (2011) pointed out that this difference would come from the folding structure below the KKNPP. Watanabe et al.<br />
(2011) examined the amplificati<strong>on</strong> factors based <strong>on</strong> the two dimensi<strong>on</strong>al models with folding structures for these two sites and<br />
succeeded to reproduce the larger amplificati<strong>on</strong> factors <str<strong>on</strong>g>of</str<strong>on</strong>g> KK1 than those <str<strong>on</strong>g>of</str<strong>on</strong>g> KK5.<br />
1
In this study, we have tried to estimate the effects <str<strong>on</strong>g>of</str<strong>on</strong>g> folding structures below the KKNPP <strong>on</strong> ground moti<strong>on</strong>s. We first incorporated<br />
the folding structure into the three-dimensi<strong>on</strong>al velocity model surrounding the KKNPP by the combinati<strong>on</strong> <str<strong>on</strong>g>of</str<strong>on</strong>g> two different velocity<br />
models and c<strong>on</strong>structed the three-dimensi<strong>on</strong>al velocity model. The results <str<strong>on</strong>g>of</str<strong>on</strong>g> ground moti<strong>on</strong> simulati<strong>on</strong>s for the moderate sized event<br />
shows that this model worked well for the simulati<strong>on</strong>s for the events that occurred around the source regi<strong>on</strong> <str<strong>on</strong>g>of</str<strong>on</strong>g> Chuetsu-Oki<br />
earthquake.<br />
Finally, we simulated the main shock <str<strong>on</strong>g>of</str<strong>on</strong>g> Chuetsu-Oki earthquake by using the c<strong>on</strong>structed velocity model including folding structure<br />
and the source model (Shiba et al., 2011). We compared how the waves are propagated from first and third asperity that produced<br />
ground moti<strong>on</strong> variati<strong>on</strong>s between KK1 and KK5 site. The results <str<strong>on</strong>g>of</str<strong>on</strong>g> simulati<strong>on</strong> indicate that the c<strong>on</strong>structed velocity model worked<br />
well and that the folding structure beneath the KKNPP played an important role during the main shock <str<strong>on</strong>g>of</str<strong>on</strong>g> Chuetsu-Oki earthquake.<br />
Fig. 1 Observed seismograms at the KKNPP from the main shock <str<strong>on</strong>g>of</str<strong>on</strong>g> the 2007 Niigataken Chuetu-Oki Earthquake<br />
(PN: Plant- North Comp<strong>on</strong>ent, PE: Plant-East Comp<strong>on</strong>ent)<br />
CONSTRUCTION OF THE THREE-DIMENSIONAL VELOCITY MODEL<br />
The velocity model used in this study is made by the combinati<strong>on</strong> <str<strong>on</strong>g>of</str<strong>on</strong>g> two models. First <strong>on</strong>e is the three-dimensi<strong>on</strong>al velocity model<br />
built by the Japan Nuclear Energy Safety Organizati<strong>on</strong> (JNES), which covers broad area including Chuetsu area (JNES, 2008). We<br />
call this model ‘Broad model’, hear after. This model has 7 geological layers, such as U<strong>on</strong>uma+Haizume, Nishiyama, Shiiya, Upper-<br />
Teradomari, Lower-Teradomari, Nanaya+Green Tuff and Basement. Each layer us subdivide into some small layers based <strong>on</strong> the<br />
material parameters shown in Table 1. JNES (2008) c<strong>on</strong>firmed that this model generally worked well for the ground moti<strong>on</strong><br />
simulati<strong>on</strong>, however, the folding structure below the KKNPP is no included.<br />
The other model includes the folding structure. This model is based <strong>on</strong> the modificati<strong>on</strong> <str<strong>on</strong>g>of</str<strong>on</strong>g> two-dimensi<strong>on</strong>al model established by<br />
Tokumitsu et al. (2009). They precisely modeled the folding structures below the KKNPP based <strong>on</strong> the results <str<strong>on</strong>g>of</str<strong>on</strong>g> geophysical surveys.<br />
They got seven two-dimensi<strong>on</strong>al secti<strong>on</strong>s, S1 to S7 in Fig. 2. We interpolate between them and c<strong>on</strong>struct three dimensi<strong>on</strong>al models <strong>on</strong><br />
the squares shown in Fig. 2. As for the outside <str<strong>on</strong>g>of</str<strong>on</strong>g> this model, we expanded the most outer secti<strong>on</strong> (S1 and S7) to the lines <str<strong>on</strong>g>of</str<strong>on</strong>g> S1’ and<br />
S7’, respectively. We call this model ‘Local Folding model’ hear after.<br />
Before we combine these two models, we tuned the S-wave velocity <str<strong>on</strong>g>of</str<strong>on</strong>g> local folding model. We have tried to match the predominant<br />
periods <str<strong>on</strong>g>of</str<strong>on</strong>g> theoretical R/V ratio or H/V ratio with those <str<strong>on</strong>g>of</str<strong>on</strong>g> the observed records for some sites <strong>on</strong> the KKNPP. We picked KK1 site as<br />
the southern part <str<strong>on</strong>g>of</str<strong>on</strong>g> the plant and KK5 site as the northern part <str<strong>on</strong>g>of</str<strong>on</strong>g> the plant based <strong>on</strong> Uetake (2010). The observed H/V ratios are<br />
calculated by using the records <str<strong>on</strong>g>of</str<strong>on</strong>g> the Off-Ibaragi earthquake (M j 7.0) <strong>on</strong> May 8 2008. In order to match the predominant frequencies<br />
2
<str<strong>on</strong>g>of</str<strong>on</strong>g> the observed records, we changed the S-wave velocity <str<strong>on</strong>g>of</str<strong>on</strong>g> the Shiiya layer to 1.2 km/s from 1.0 km/s shown as the Table 1(b). We<br />
show the comparis<strong>on</strong> <str<strong>on</strong>g>of</str<strong>on</strong>g> H/V ratio based <strong>on</strong> the observed records with the theoretical <strong>on</strong>es in Fig. 3. Modified models (Vs 1.2 km/s for<br />
the Shiiya layer) show good agreement <str<strong>on</strong>g>of</str<strong>on</strong>g> the predominant frequencies around 0.3 Hz. After we made the local folding model based<br />
<strong>on</strong> the procedure menti<strong>on</strong>ed above, we substituted the area surrounding the KKNPP <str<strong>on</strong>g>of</str<strong>on</strong>g> the broad model above the lower-Teradomari<br />
layer into the local folding model. The lower-Teradomari layer in broad model is located deeper than that in local folding model<br />
around the KKNPP. This holds the folding structure <strong>on</strong> the upper surface <str<strong>on</strong>g>of</str<strong>on</strong>g> the lower-Teradomari and above layers <str<strong>on</strong>g>of</str<strong>on</strong>g> local folding<br />
model.<br />
Table 1: Material parameters <str<strong>on</strong>g>of</str<strong>on</strong>g> the velocity model<br />
(a) Material parameters for broad model<br />
No. Geological Layer Vs [km/s] Vp [km/s] ρ [g/cm^3]<br />
1 U<strong>on</strong>uma+Haizume 1 0.70 1.7 1.86<br />
2 U<strong>on</strong>uma+Haizume 2 0.98 2.0 1.98<br />
3 U<strong>on</strong>uma+Haizume 3 1.08 2.5 2.13<br />
4 Nishiyama 1 0.70 1.7 1.86<br />
5 Nishiyama 2 0.98 2.0 1.98<br />
6 Nishiyama 3 1.08 2.5 2.13<br />
7 Shiiya 1 0.84 1.9 1.94<br />
8 Shiiya 2 0.98 2.5 2.13<br />
9 Shiiya 3 1.68 3.3 2.30<br />
10 Upper-Teradomari 1.87 3.7 2.30<br />
11 Lower-Teradomari 2.20 4.1 2.40<br />
12 Nanaya+Green Tuff 2.64 4.7 2.50<br />
13 Basement 3.15 5.5 2.65<br />
(b) Material parameters for local folding model<br />
Geological Layer Vs [km/s] Vp [km/s] ρ [g/cm^3]<br />
Nishiyama 0.7 1.9 1.7<br />
Shiiya 1 -> 1.2 2.2 2.1<br />
Upper-Teradomari 1.7 3.3 2.3<br />
Lower-Teradomari 2 4.2 2.4<br />
Nanaya 2 4.6 2.5<br />
Green Tuff 2.6 4.6 2.5<br />
Basement 3.1 5.2 2.6<br />
S7’<br />
S1’<br />
Fig. 2 Cross secti<strong>on</strong> <str<strong>on</strong>g>of</str<strong>on</strong>g> the two-dimensi<strong>on</strong>al folding structures developed by Tokumitsu et al. (2009)<br />
3
S1’ and S7’ corresp<strong>on</strong>d to the cross secti<strong>on</strong> that we expanded the model <str<strong>on</strong>g>of</str<strong>on</strong>g> S1 and S7, respectively.<br />
However, just substituting local folding model above the upper-Teradomari <str<strong>on</strong>g>of</str<strong>on</strong>g> broad model produce the gaps <str<strong>on</strong>g>of</str<strong>on</strong>g> velocity structure <strong>on</strong><br />
the vertical boundaries <str<strong>on</strong>g>of</str<strong>on</strong>g> the c<strong>on</strong>nected area. Thus, we modified the velocity structure <strong>on</strong> the boundary area <str<strong>on</strong>g>of</str<strong>on</strong>g> broad model<br />
c<strong>on</strong>necting to the area <str<strong>on</strong>g>of</str<strong>on</strong>g> local folding model in order to reduce the artificial refracted waves that are generated around the boundary<br />
area. We show the cross secti<strong>on</strong> <str<strong>on</strong>g>of</str<strong>on</strong>g> the velocity model passing through KK1 with smoothing the boundary between broad model and<br />
local folding model assuming 4 km width for the boundary area in Fig. 4 (KK1 is approximately located 20 (EW directi<strong>on</strong>) and 30<br />
(NS directi<strong>on</strong>). In Fig. 5, we show the comparis<strong>on</strong> <str<strong>on</strong>g>of</str<strong>on</strong>g> the snap shots <str<strong>on</strong>g>of</str<strong>on</strong>g> the propagating wave fr<strong>on</strong>t <str<strong>on</strong>g>of</str<strong>on</strong>g> EW comp<strong>on</strong>ent after 6 sec <str<strong>on</strong>g>of</str<strong>on</strong>g> the<br />
origin time without (1) and with (2) modificati<strong>on</strong> <str<strong>on</strong>g>of</str<strong>on</strong>g> the boundary area. As seen around the circled area in the figures, the reducti<strong>on</strong> <str<strong>on</strong>g>of</str<strong>on</strong>g><br />
the refracted waves from the boundary area could be seen based <strong>on</strong> the modificati<strong>on</strong> <str<strong>on</strong>g>of</str<strong>on</strong>g> boundary area between two models.<br />
Fig. 3 Comparis<strong>on</strong> <str<strong>on</strong>g>of</str<strong>on</strong>g> H/V ratio by the observed records with by the theoretical <strong>on</strong>es based <strong>on</strong> the 1D strucure<br />
Fig. 4 Cross secti<strong>on</strong> <str<strong>on</strong>g>of</str<strong>on</strong>g> the velocity model <strong>on</strong> the KK1 with smoothing the boundary between broad model and local folding model<br />
(Every number is in km)<br />
4
Fig. 5 Comparis<strong>on</strong> <str<strong>on</strong>g>of</str<strong>on</strong>g> the snapshots without (1) and with (2) the modificati<strong>on</strong> <str<strong>on</strong>g>of</str<strong>on</strong>g> the boundary area between two velocity models<br />
VERIFICATION OF THE MODEL AND GROUND MOTION SIMULATION<br />
Ground Moti<strong>on</strong> Simulati<strong>on</strong> <str<strong>on</strong>g>of</str<strong>on</strong>g> Moderate Sized Event<br />
In order to validate the velocity model, we simulated the observed records at the KKNPP for three moderate sized<br />
events. Two are occurred <strong>on</strong> the asperity 1 and 3 determined by Shiba (2008), respectively. First <strong>on</strong>e is occurred <strong>on</strong> the<br />
asperity 1(northern side <str<strong>on</strong>g>of</str<strong>on</strong>g> the asperity) at 21:08 <str<strong>on</strong>g>of</str<strong>on</strong>g> July 16, 2007. We call this event as Aft 1. Sec<strong>on</strong>d <strong>on</strong>e is occurred<br />
<strong>on</strong> the asperity 3 (southern side <str<strong>on</strong>g>of</str<strong>on</strong>g> the asperity) at 17:42 <str<strong>on</strong>g>of</str<strong>on</strong>g> July 16, 2007. This event is called as Aft 2. Last is <strong>on</strong>e <str<strong>on</strong>g>of</str<strong>on</strong>g><br />
the large aftershocks <str<strong>on</strong>g>of</str<strong>on</strong>g> the 2004 Chuetsu-earthquake occurring at 19:46 <str<strong>on</strong>g>of</str<strong>on</strong>g> Oct 23, 2004. We name this event as Land.<br />
We used the finite difference method developed by Pitarka (1999) with variable grid spacing for the simulati<strong>on</strong>. The<br />
target period is 10 sec through 0.25 sec, leading to the minimum size <str<strong>on</strong>g>of</str<strong>on</strong>g> the grid 25m. The total area <str<strong>on</strong>g>of</str<strong>on</strong>g> modeling is 50<br />
km (EW) x 50 km (NS) x 20 km (depth).<br />
We modeled each event as the point source. We first model them based <strong>on</strong> the 1D structure to check whether the<br />
observed amplitude ratio <str<strong>on</strong>g>of</str<strong>on</strong>g> two horiz<strong>on</strong>tal comp<strong>on</strong>ents at the KKNPP and other adjacent sites, such as K-NET<br />
Kashiwazaki could be reproduced. Based <strong>on</strong> these moldings, we set the focal depth 7 km for Aft2 instead <str<strong>on</strong>g>of</str<strong>on</strong>g> 5 km<br />
determined by JMA. The focal depths by JMA are used for other events (Aft1, Land). We used the focal mechanism and<br />
seismic moment determined by the Broadband Seismograph Network (F-net) (Fukuyama et al., 1998). The locati<strong>on</strong>s <str<strong>on</strong>g>of</str<strong>on</strong>g><br />
epicenter are same as those <str<strong>on</strong>g>of</str<strong>on</strong>g> JMA locati<strong>on</strong>s. The shape <str<strong>on</strong>g>of</str<strong>on</strong>g> source time functi<strong>on</strong>s is assumed to be the isosceles. The<br />
rise time for each event is set based <strong>on</strong> the width <str<strong>on</strong>g>of</str<strong>on</strong>g> S-wave pulse <str<strong>on</strong>g>of</str<strong>on</strong>g> the observed waveforms at rock sites <str<strong>on</strong>g>of</str<strong>on</strong>g> F-net<br />
stati<strong>on</strong>s adjacent to the source. The values <str<strong>on</strong>g>of</str<strong>on</strong>g> rise time are 0.7 s for Aft1, 0.4 s for Aft2, and 1.44 s for Land,<br />
respectively. The source parameters for the simulati<strong>on</strong> are shown in Table 2. We show the locati<strong>on</strong> <str<strong>on</strong>g>of</str<strong>on</strong>g> epicenter and<br />
focal mechanism for each event in Fig. 6. The dashed -rectangle areas in Figure 6 corresp<strong>on</strong>d to the area <str<strong>on</strong>g>of</str<strong>on</strong>g> asperities<br />
determined by Shiba (2008).<br />
Table 2: Source parameters <str<strong>on</strong>g>of</str<strong>on</strong>g> each event used for the simulati<strong>on</strong><br />
Event<br />
Aft1<br />
Aft2<br />
Land<br />
Occurrence<br />
Date<br />
2007/7/16<br />
(21:08)<br />
2007/7/16<br />
(17:42)<br />
2004/10/2<br />
3 (19:46)<br />
Epicenter<br />
Depth<br />
[km]<br />
Mechanism<br />
Strike Dip Rake<br />
<strong>Seismic</strong> Moment<br />
[Nm]<br />
Mechanis<br />
m<br />
Rise Time<br />
[sec]<br />
(138.630,37.509) 13.6 187 54 70 5.21E+15 F-net 0.70<br />
(138.557,37.415) 7.0 309 78 37 2.09E+14 F-net 0.40<br />
(138.875,37.295) 12.0 16 52 73 1.17E+17 F-net 1.44<br />
Fig. 6 Locati<strong>on</strong>s <str<strong>on</strong>g>of</str<strong>on</strong>g> the epicenter for simulated moderate sized event and its mechanism<br />
In Fig. 7, we show the results <str<strong>on</strong>g>of</str<strong>on</strong>g> simulati<strong>on</strong>s for each event. We rotated all waveforms to PE and PN comp<strong>on</strong>ent and<br />
5
and-pass filtered between 0.1 Hz – 4 Hz for all <str<strong>on</strong>g>of</str<strong>on</strong>g> them. Because we tried to compare the records <strong>on</strong> the base mat for<br />
the site, the effects <str<strong>on</strong>g>of</str<strong>on</strong>g> surface geology above it have been removed from the observed record. As shown in Fig. 7 (1),<br />
the synthetic moti<strong>on</strong>s for Aft1 agree well with the observed records <str<strong>on</strong>g>of</str<strong>on</strong>g> body waves for both KK1 and KK5. This trend is<br />
the same as for Land shown in Fig. 7 (3). Except that the reproducti<strong>on</strong>s for the observed records <str<strong>on</strong>g>of</str<strong>on</strong>g> PN comp<strong>on</strong>ents and<br />
following surface waves are insufficient, general features <str<strong>on</strong>g>of</str<strong>on</strong>g> observed records for Aft2 could be reproduced shown in<br />
Fig. 7(2). We also show the comparis<strong>on</strong> <str<strong>on</strong>g>of</str<strong>on</strong>g> ground moti<strong>on</strong>s between KK1 and KK5 for Aft1 and Aft2 <str<strong>on</strong>g>of</str<strong>on</strong>g> the<br />
observati<strong>on</strong>s as well as the synthetic moti<strong>on</strong>s in Fig. 8. The comparis<strong>on</strong> <str<strong>on</strong>g>of</str<strong>on</strong>g> wave field at KK1 and KK5 for Aft1 shows<br />
that the observed wave fields for those sites are very similar and these are reproduce in the synthetic moti<strong>on</strong>s,<br />
represented by the maximum values. On the c<strong>on</strong>trary, the wave field for Aft2 that occurred around the asperity 3 shows<br />
that the observati<strong>on</strong> that amplitudes <str<strong>on</strong>g>of</str<strong>on</strong>g> KK1 site are almost doubled to those <str<strong>on</strong>g>of</str<strong>on</strong>g> KK5 site and this relati<strong>on</strong> could be<br />
reproduced in theoretical calculati<strong>on</strong>s. These results mean that the c<strong>on</strong>structed three-dimensi<strong>on</strong>al velocity model<br />
worked well for the ground moti<strong>on</strong> simulati<strong>on</strong>s for these moderate sized events.<br />
Hayakawa et al. (2011) showed that the large amplitude <str<strong>on</strong>g>of</str<strong>on</strong>g> KK1 site comes from the folding structure where KK1 is<br />
located <strong>on</strong> the synclinal axis. They also showed that the wave field from Aft1 whose epicenter is located close to the<br />
asperity 1 produced similar ground moti<strong>on</strong>s, because the seismic wave fields are propagated around the regi<strong>on</strong> that is<br />
not affected by the folding structure. This indicates that the folding structures can be very important role for ground<br />
moti<strong>on</strong> features if the wave field is propagated through that regi<strong>on</strong>.<br />
Fig.7 Comparis<strong>on</strong> <str<strong>on</strong>g>of</str<strong>on</strong>g> the observed waveform at KK1 and KK5 sites for simulated moderate sized events<br />
Fig. 8 Comparis<strong>on</strong> <str<strong>on</strong>g>of</str<strong>on</strong>g> the wave field at KK1 and KK5 sites for Aft1and Aft2<br />
Ground moti<strong>on</strong> simulati<strong>on</strong>s <str<strong>on</strong>g>of</str<strong>on</strong>g> main shock <str<strong>on</strong>g>of</str<strong>on</strong>g> the 2007 Chuetsu-Oki earthquake<br />
Finally, we tried to simulate the observed records <str<strong>on</strong>g>of</str<strong>on</strong>g> main shock <str<strong>on</strong>g>of</str<strong>on</strong>g> the 2007 Chuetsu-Oki earthquake to investigate the effects <str<strong>on</strong>g>of</str<strong>on</strong>g><br />
folding structures <strong>on</strong> ground moti<strong>on</strong>s seen as the ground moti<strong>on</strong> simulati<strong>on</strong>s for moderate sized events. We have used the<br />
6
characterized source model by Shiba et al. (2011). Shiba et al. (2011) recently updated the model determined from their previous<br />
model (Shiba, 2008) by using the empirical green’s functi<strong>on</strong>s based <strong>on</strong> the aftershock distributi<strong>on</strong>s newly determined by Shinohara et<br />
al. (2008). As shown in Fig. 9(a), the distributi<strong>on</strong> changes al<strong>on</strong>g the strike directi<strong>on</strong> (39゜) leading to modeling different dip angle<br />
dependent <strong>on</strong> the asperity. After they estimated the slip distributi<strong>on</strong> shown the area by surrounded by the blue lines in Fig. 9(b), three<br />
asperities were extracted from the slip distributi<strong>on</strong> to c<strong>on</strong>struct the characterized source model. The locati<strong>on</strong>s <str<strong>on</strong>g>of</str<strong>on</strong>g> each asperity are<br />
represented by the area with black lines in Fig. 9(b) and source parameters for each asperity is shown in Table 3. We used that<br />
characterized model. Compared to the previous model (Shiba, 2008), the surface <str<strong>on</strong>g>of</str<strong>on</strong>g> the asperity and effective stress have been changed<br />
<strong>on</strong>ly for the asperity 1. This model also changes the dip angle for each asperity unless the strike angle is same as all asperities. The dip<br />
angles are 40゜for asperity 1 and 30 ゜ for asperity 3, respectively. For asperity2, we divided the area into some small rectangular<br />
<strong>on</strong>es with different depth <str<strong>on</strong>g>of</str<strong>on</strong>g> the top and dip angles linearly changing from 40゜(north side, asperity 1) to 30゜(south side, asperity 3).<br />
This model assumes the multi-hypocenter for each asperity (Blue circles in Fig. 9(b)). As for the slip velocity functi<strong>on</strong>s, we used the<br />
model proposed by Nakamura and Miyatake (2000) based <strong>on</strong> the dynamic modeling for our simulati<strong>on</strong>. The results are filtered<br />
between 0.1 to 4.0 Hz same as <str<strong>on</strong>g>of</str<strong>on</strong>g> the simulati<strong>on</strong>s for moderate sized events. In Fig. 10, we compare the results <str<strong>on</strong>g>of</str<strong>on</strong>g> ground moti<strong>on</strong><br />
simulati<strong>on</strong>s for the main shock <str<strong>on</strong>g>of</str<strong>on</strong>g> the 2007 Chuetsu-Oki earthquake. The source model (Shiba et al., 2011) did not specify the<br />
nucleati<strong>on</strong> times for each asperity. Then we set the time shifts for each asperity when we combined the calculated waveforms for each<br />
asperity (top three waveforms <str<strong>on</strong>g>of</str<strong>on</strong>g> each graph in Fig. 10) to achieve the better fitting to the observed data (red lines) shown in the<br />
bottom <str<strong>on</strong>g>of</str<strong>on</strong>g> each graph in Fig.10. Even the amplitudes from asperity 1 are insufficient and there are little differences <str<strong>on</strong>g>of</str<strong>on</strong>g> amplitudes<br />
(peak values) between KK1 and KK5 from asperity 3, the general features <str<strong>on</strong>g>of</str<strong>on</strong>g> observed data could be reproduced.<br />
Table 3: Source Parameters for each asperity determined by Shiba et al. (2011)<br />
Asperity 1 Asperity 2 Asperity 3<br />
Depth <str<strong>on</strong>g>of</str<strong>on</strong>g> the Top [km] 14.0 9.7-10.6 9.5<br />
Length [km] 5.6 5.6 5.6<br />
Width [km] 4.2 7 5.6<br />
Rake Angle [゜] 90 90 90<br />
Effective Stress [Mpa] 23.15 20.84 19.91<br />
<strong>Seismic</strong> Moment [10^19 Nm] 1.09 2.11 1.43<br />
Rise Time [s] 0.4 0.4 0.4<br />
Rupture Velocity [km/s] 3 2.8 3<br />
Fig. 9 Distributi<strong>on</strong> <str<strong>on</strong>g>of</str<strong>on</strong>g> aftershock (a), locati<strong>on</strong> and shape <str<strong>on</strong>g>of</str<strong>on</strong>g> each asperity by Shiba et al. (2011) (b)<br />
(Modified after Shiba etal., 2011)<br />
7
(1) Results <str<strong>on</strong>g>of</str<strong>on</strong>g> ground moti<strong>on</strong> simulati<strong>on</strong> for the KK1 site<br />
(2) Results <str<strong>on</strong>g>of</str<strong>on</strong>g> ground moti<strong>on</strong> simulati<strong>on</strong> for the KK5 site<br />
Fig. 10 Results <str<strong>on</strong>g>of</str<strong>on</strong>g> Ground moti<strong>on</strong> simulati<strong>on</strong>s for the main shock <str<strong>on</strong>g>of</str<strong>on</strong>g> 2007 Chuetsu-Oki Earthquake<br />
DISCUSSION: MECHANISM OF WAVEPROPAGATION THROUGH THE FOLDING STRUCTURE<br />
The better agreement <str<strong>on</strong>g>of</str<strong>on</strong>g> the observed data with the simulated ground moti<strong>on</strong>s indicates that the source model as well as the<br />
c<strong>on</strong>structed velocity model worked well. In order to get the better understands <str<strong>on</strong>g>of</str<strong>on</strong>g> the mechanism <str<strong>on</strong>g>of</str<strong>on</strong>g> wave propagati<strong>on</strong> through folding<br />
structure, that might produce large ground moti<strong>on</strong>s from the asperity 3, we compared the snapshots <str<strong>on</strong>g>of</str<strong>on</strong>g> wave propagati<strong>on</strong> from asperity<br />
1 with those from asperity 3. The locati<strong>on</strong>s <str<strong>on</strong>g>of</str<strong>on</strong>g> the cross secti<strong>on</strong> for each asperity with folding structure are shown as the red lines in<br />
Fig. 10 (a) and Fig. 11 (a), respectively.<br />
The snapshots <str<strong>on</strong>g>of</str<strong>on</strong>g> how waves are propagated from asperity1 are shown in Fig. 11 with <strong>on</strong>e sec<strong>on</strong>d interval. We plotted the snapshot as<br />
the plan view (b), (e) and the cross secti<strong>on</strong> c<strong>on</strong>necting from center <str<strong>on</strong>g>of</str<strong>on</strong>g> asperity 1 and KK1 ((c), (f)) and for KK5 ((d), (g)), respectively.<br />
The snapshots show that the waves propagate relatively smooth i.e., the wave field seen <strong>on</strong> the cross secti<strong>on</strong> <str<strong>on</strong>g>of</str<strong>on</strong>g> KK5 could be seen <strong>on</strong><br />
the next snapshots <str<strong>on</strong>g>of</str<strong>on</strong>g> KK1 cross secti<strong>on</strong> and the diffracti<strong>on</strong> or focusing caused by the folding structure have not been seen toward to<br />
8
KK1. This feature agrees with what have seen in the ground moti<strong>on</strong> simulati<strong>on</strong> for Aft1 in moderate sized events. This indicates that<br />
the folding structure is not important for the wave propagati<strong>on</strong> from northern side <str<strong>on</strong>g>of</str<strong>on</strong>g> the KKNPP.<br />
For the wave trains from asperity 3, we show the snapshots in Fig. 11 with <strong>on</strong>e sec<strong>on</strong>d interval as the plan view (b), (e) and the cross<br />
secti<strong>on</strong> c<strong>on</strong>necting from center <str<strong>on</strong>g>of</str<strong>on</strong>g> aspeirty3 and KK1 ((c), (f)) and for KK5 ((d), (g)), respectively. The first snapshots show that the<br />
wave fields look similar for KK1 and KK5. On the other hand, the wave fields <strong>on</strong> the send snapshot produced different features for<br />
KK1 and KK5. Especially to the area with large amplitude corresp<strong>on</strong>ds to the line <str<strong>on</strong>g>of</str<strong>on</strong>g> the synclinal axis (Tokumitsu et al., 2009)<br />
showing inside the squared area and may cause the focusing because <str<strong>on</strong>g>of</str<strong>on</strong>g> this folding structure. This feature agrees with<br />
what have seen in the ground moti<strong>on</strong> simulati<strong>on</strong> for Aft2 in moderate sized events. The wave trains showing that features come<br />
from the asperity 3 and this may cause the reas<strong>on</strong> that produced the difference <str<strong>on</strong>g>of</str<strong>on</strong>g> peak amplitude between KK1 and<br />
KK5 during the main shock <str<strong>on</strong>g>of</str<strong>on</strong>g> 2007 Chuetsu-Oki earthquake (Fig. 1). This indicates that the folding structures below the<br />
KKNPP plays important roles for the wave propagated from western side <str<strong>on</strong>g>of</str<strong>on</strong>g> the KKNPP.<br />
Fig. 11 Snapshots <str<strong>on</strong>g>of</str<strong>on</strong>g> the EW-comp<strong>on</strong>ent wave field coming from the asperity 1<br />
(Left hand side corresp<strong>on</strong>ds to the source area <strong>on</strong> cross secti<strong>on</strong>)<br />
SUMMARY<br />
We have c<strong>on</strong>structed the three-dimensi<strong>on</strong>al velocity model that incorporates the precise folding structures around the Kashiwazaki-<br />
Kariwa nuclear power plant, where the large ground moti<strong>on</strong>s have been observed during the 2007 Chuetsu-Oki earthquake. The<br />
c<strong>on</strong>structed model is combined two models, the model including precise folding structures adjacent to the KKNPP and the model<br />
c<strong>on</strong>structed for the more broad area. We c<strong>on</strong>nected these models smoothly to reduce the artificial diffracted waves generating around<br />
the c<strong>on</strong>nected area. During the c<strong>on</strong>structi<strong>on</strong> <str<strong>on</strong>g>of</str<strong>on</strong>g> this model, we tuned the S-wave velocity <str<strong>on</strong>g>of</str<strong>on</strong>g> <strong>on</strong>e layer in the models with folding<br />
structure based <strong>on</strong> the fitting <str<strong>on</strong>g>of</str<strong>on</strong>g> the H/V ratio based <strong>on</strong> observed records to the theoretical <strong>on</strong>es.<br />
9
Fig.12 Snapshots <str<strong>on</strong>g>of</str<strong>on</strong>g> the EW-comp<strong>on</strong>ent wave field coming from the asperity 3<br />
(Left hand side corresp<strong>on</strong>ds to the source area <strong>on</strong> cross secti<strong>on</strong>)<br />
In order to validate this velocity model, we have simulated ground moti<strong>on</strong>s for moderate sized events that occurred around the fault<br />
area <str<strong>on</strong>g>of</str<strong>on</strong>g> Chuetsu-Oki earthquake. The synthetic calculati<strong>on</strong>s could reproduce some distinct observed ground moti<strong>on</strong> features; the<br />
ground moti<strong>on</strong>s at KK1 site produced large ground moti<strong>on</strong>s for Aft that occurred around asperity 3 are larger than that at KK5 site like<br />
main shock <str<strong>on</strong>g>of</str<strong>on</strong>g> Chuetsu-Oki earthquake and the ratio <str<strong>on</strong>g>of</str<strong>on</strong>g> peak values between KK1 and KK5 for aft1. This indicates that the observed<br />
ground moti<strong>on</strong> variati<strong>on</strong>s at KKNPP might cause the folding structures adjacent to the KKNPP.<br />
Finally we did the ground moti<strong>on</strong> simulati<strong>on</strong> for the main shock <str<strong>on</strong>g>of</str<strong>on</strong>g> the 2007 Chuetsu-Oki earthquake. We used the source model by<br />
Shiba et al. (2011) with assuming n<strong>on</strong>-planar fault planes. We combined the synthetic waveforms for each asperity with delay <str<strong>on</strong>g>of</str<strong>on</strong>g><br />
nucleati<strong>on</strong> time to get better fitting <str<strong>on</strong>g>of</str<strong>on</strong>g> the observed data. We could reproduce the general features <str<strong>on</strong>g>of</str<strong>on</strong>g> observed data from the main<br />
shock <str<strong>on</strong>g>of</str<strong>on</strong>g> 2007 Chuetsu-Oki earthquake. Snapshots <str<strong>on</strong>g>of</str<strong>on</strong>g> how the waves are propagated indicate that the waves from northern side<br />
(asperity 1) are not affected by the folding structure so much, i.e., ground moti<strong>on</strong>s features look same as KK1 with KK5. On the other<br />
hand, the folding structures below KKNPP have very important roles for the wave propagati<strong>on</strong> from southern side (asperity 3). The<br />
results <str<strong>on</strong>g>of</str<strong>on</strong>g> simulati<strong>on</strong> show that the folding structure might cause the ground moti<strong>on</strong> variati<strong>on</strong>s during the main shock <str<strong>on</strong>g>of</str<strong>on</strong>g> the 2007<br />
Chuetsu-Oki earthquake.<br />
ACKNOWLEDGEMENTS<br />
The observed data have been obtained by the seismic array <str<strong>on</strong>g>of</str<strong>on</strong>g> Kashiwazaki-Kariwa nuclear power plant managed by Tokyo Electric<br />
Power Company.<br />
10
REFERENCES<br />
Fukuyama, E., M. Ishida, D. Dreger, and H. Kawai [1998] ”Automated <strong>Seismic</strong>Moment Tensor Determinati<strong>on</strong> by Using On-line<br />
Broadband <strong>Seismic</strong> Waveforms,Zishin”, V. 51, 149-156 (in Japanese with English abstract).<br />
Hijikata, K., I. Nishimura, H. Mizutani, R. Tokumitsu, M. Mashimo, S. Tanaka [2010] “Ground moti<strong>on</strong> characteristics <str<strong>on</strong>g>of</str<strong>on</strong>g> 2007<br />
Niigata-ken Chuetsu-oki earthquake”, J. Struct. C<strong>on</strong>str. Eng., AIJ, Vol 75, No.653, pp.1279-1288.<br />
Hayakawa, T., K. Tsuda, T. Uetake, K. Hikima, R. Tokumitsu, H. Nagumo [2011] “ Modeling 3D velocity structure in the fault regi<strong>on</strong><br />
<str<strong>on</strong>g>of</str<strong>on</strong>g> the 2007 Niigataken Chuetu-oki Earthquake - Incorporating the 3D fold geological structure beneath the Kashiwazaki-Kariwa<br />
nuclear power plant –“ Japan Geoscience Uni<strong>on</strong> meeting, SSS023-P14.<br />
Japan Nuclear Energy Safety Organizati<strong>on</strong> [2008]“C<strong>on</strong>structi<strong>on</strong> <str<strong>on</strong>g>of</str<strong>on</strong>g> the subsurface structure around the source area <str<strong>on</strong>g>of</str<strong>on</strong>g> 2007 Niigata<br />
Ken Chuetsu-Oki earthquake”, Technical Report (Extracted versi<strong>on</strong>).<br />
Miyake, H., K. Koketsu, K. Hikima, M. Shinohara, and T. Kanazawa [2010] “Source fault <str<strong>on</strong>g>of</str<strong>on</strong>g> the 2007 Chuetsu-oki, Japan,<br />
earthquake”, Bull. Seismol. Soc. Am., V 100, 384-391.<br />
Nakamura, H, and T. Miyatake [2000] “An approximate expressi<strong>on</strong>s <str<strong>on</strong>g>of</str<strong>on</strong>g> slip velocity time functi<strong>on</strong> for simulati<strong>on</strong> <str<strong>on</strong>g>of</str<strong>on</strong>g> near-field str<strong>on</strong>g<br />
ground moti<strong>on</strong>” , Zisin, 2 nd , V53, 1-9.<br />
Pitarka, A [1999] “3D Elastic Finite-Difference Modeling <str<strong>on</strong>g>of</str<strong>on</strong>g> <strong>Seismic</strong> Moti<strong>on</strong> Using Staggered Grids with N<strong>on</strong>uniform Spacing”, Bull.<br />
Seism. Soc. Am., V. 89, pp.54-68.<br />
Shiba, Y., K. Hikima, T. Uetake, H. Mizutani, K. Tsuda, T. Hayakawa, and S. Tanaka [2011] “Source model <str<strong>on</strong>g>of</str<strong>on</strong>g> the 2007 Chuetsu-Oki<br />
earthquake based <strong>on</strong> precise aftershock distributi<strong>on</strong> and 3-D velocity structure”, Japan Geoscience Uni<strong>on</strong> meeting, SSS023-P13.<br />
Shiba, Y. [2008] “Source Process and Broadband Str<strong>on</strong>g Moti<strong>on</strong>s during the Niigata-ken Chuetsu-Oki Earthquake in 2007”, Report <str<strong>on</strong>g>of</str<strong>on</strong>g><br />
Central Research Institute <str<strong>on</strong>g>of</str<strong>on</strong>g> Electric Power Industry. (Japanese with English abstract)<br />
Shinohara, M., T. Kanazawa, T. Yamada, K. Nakahigashi, S. Sakai, R. Hino, Y. Murai, A. Yamazaki, K. Obana, Y. Ito, K. Iwakiri, R.<br />
Miura, Y. Machida, K. Mochizuki, K. Uehira, M. Tahara, A. Kuwano, S. Amamiya, S. Kodaira, T. Takanami, Y. Kaneda, T.<br />
Iwasaki. [2008] “Precise aftershock distributi<strong>on</strong> <str<strong>on</strong>g>of</str<strong>on</strong>g> the 2007 Chuetsu-oki Earthquake obtained by using an ocean bottom<br />
seismometer network”, Earth Planets Space, 60, pp1121-1126.<br />
Tokumitsu, R., I. Nishimura, K. Hijikata, M. H<strong>on</strong>da, Y. Yokota, T. Watanabe [2009]. “The Relati<strong>on</strong>ship between the <strong>Seismic</strong> Ground<br />
Moti<strong>on</strong> Characteristics and the Geological Structure in the Kashiwazaki-Kariwa Nuclear Power Plant <strong>on</strong> the 2007 Niigataken<br />
Chuetsu-oki Earthquake” Proceedings <str<strong>on</strong>g>of</str<strong>on</strong>g> Society <str<strong>on</strong>g>of</str<strong>on</strong>g> Explorati<strong>on</strong> Geophysics <str<strong>on</strong>g>of</str<strong>on</strong>g> Japan for 121th meeting. (Japanese with<br />
English abstract)<br />
Uetake, T., R. Tokumitsu, I. Nishimura, K. Hijikata [2011] “<str<strong>on</strong>g>Effects</str<strong>on</strong>g> <str<strong>on</strong>g>of</str<strong>on</strong>g> fold structure in the Kashiwazaki-Kariwa Nuclear Power<br />
Stati<strong>on</strong> <strong>on</strong> the ground moti<strong>on</strong> characteristics <str<strong>on</strong>g>of</str<strong>on</strong>g> Niigataken Chuetsu-oki earthquake: modeling <str<strong>on</strong>g>of</str<strong>on</strong>g> sub-surface structure and wave<br />
propagati<strong>on</strong> study using a finite difference method-”, J. Struct. C<strong>on</strong>str. Eng., AIJ, Vol 76, No.660, pp.311-318. (Japanese with<br />
English abstract)<br />
Uetake, T. [2010] “Propagati<strong>on</strong> and Amplificati<strong>on</strong> <str<strong>on</strong>g>of</str<strong>on</strong>g> Short-Periods Ground Moti<strong>on</strong> in Sedimentary Layeres”, in the 38 th Symposium<br />
<str<strong>on</strong>g>of</str<strong>on</strong>g> Earthquake Ground Moti<strong>on</strong>, pp.33-40. (Japanese with English abstract)<br />
Watanabe T., T. Moroi, R. Tokumitsu, I. Nishimura., and K. Hijikata, (2011) , Examinati<strong>on</strong> <str<strong>on</strong>g>of</str<strong>on</strong>g> relati<strong>on</strong> between locati<strong>on</strong>s <str<strong>on</strong>g>of</str<strong>on</strong>g> asperities<br />
and site amplificati<strong>on</strong> characteristics <str<strong>on</strong>g>of</str<strong>on</strong>g> ground moti<strong>on</strong>s by analysis c<strong>on</strong>sidering the folded structure.- Estimati<strong>on</strong> based <strong>on</strong> the<br />
str<strong>on</strong>g moti<strong>on</strong> records obtained from the 2007 Niigataken Chuetsu-Oki earthquake in the Kashiwazaki-Kariwa nuclear power<br />
stati<strong>on</strong> - J. Struct. C<strong>on</strong>str. Eng., AIJ, Vol 76, pp71-78. (Japanese with English abstract)<br />
11