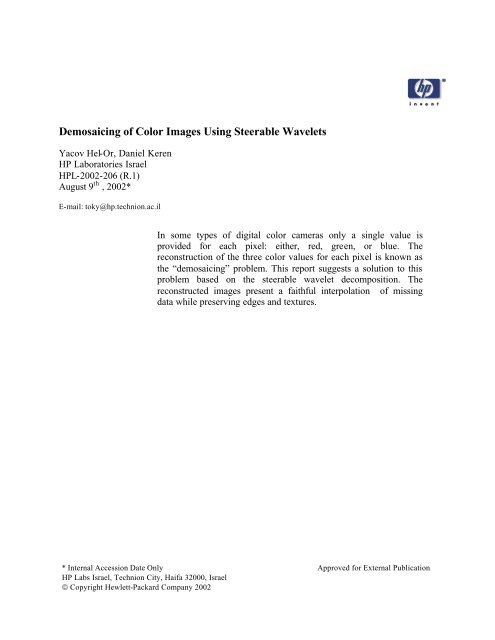
Demosaicing of Color Images Using Steerable Wavelets
Demosaicing of Color Images Using Steerable Wavelets
Demosaicing of Color Images Using Steerable Wavelets

Create successful ePaper yourself
Turn your PDF publications into a flip-book with our unique Google optimized e-Paper software.
<strong>Demosaicing</strong> <strong>of</strong> <strong>Color</strong> <strong>Images</strong> <strong>Using</strong> <strong>Steerable</strong> <strong>Wavelets</strong><br />
Yacov Hel-Or, Daniel Keren<br />
HP Laboratories Israel<br />
HPL-2002-206 (R.1)<br />
August 9 th , 2002*<br />
E-mail: toky@hp.technion.ac.il<br />
In some types <strong>of</strong> digital color cameras only a single value is<br />
provided for each pixel: either, red, green, or blue. The<br />
reconstruction <strong>of</strong> the three color values for each pixel is known as<br />
the “demosaicing” problem. This report suggests a solution to this<br />
problem based on the steerable wavelet decomposition. The<br />
reconstructed images present a faithful interpolation <strong>of</strong> missing<br />
data while preserving edges and textures.<br />
* Internal Accession Date Only Approved for External Publication<br />
HP Labs Israel, Technion City, Haifa 32000, Israel<br />
© Copyright Hewlett-Packard Company 2002
<strong>Demosaicing</strong> <strong>of</strong> <strong>Color</strong> <strong>Images</strong> <strong>Using</strong> <strong>Steerable</strong> <strong>Wavelets</strong><br />
Yacov Hel-Or and Daniel Keren<br />
Hewlett-Packard Labs Israel ∗<br />
Abstract<br />
In some types <strong>of</strong> digital color cameras only a single value is provided for each pixel:<br />
either, red, green, or blue. The reconstruction <strong>of</strong> the three color values for each pixel is<br />
known as the “demosaicing” problem. This report suggests a solution to this problem<br />
based on the steerable wavelet decomposition. The reconstructed images present a<br />
faithful interpolation <strong>of</strong> missing data while preserving edges and textures.<br />
1 Introduction<br />
A color image is typically represented by three bands each <strong>of</strong> which is a matrix <strong>of</strong> values<br />
representing the responses <strong>of</strong> an array <strong>of</strong> photo-sensors to the viewed scene. The three bands<br />
are <strong>of</strong>ten referred to as red (R), green (G), and blue (B) according to their spectral sensitivity.<br />
Thus, three numbers are given at each matrix location composing a pixel value. Some CCD<br />
cameras, however, provide only a single value for each pixel due to their inability to position<br />
three photo-sensors at the same location. In these cases, the captured image is composed <strong>of</strong><br />
three bands whose pixel values are partially sampled. An example <strong>of</strong> a CCD array with a<br />
typical photo-sensor arrangement is given in Figure 1.<br />
The demosicing problem deals with the reconstruction <strong>of</strong> a color image I from a partial<br />
sampling D <strong>of</strong> its pixel values. This inverse problem is, <strong>of</strong> course, under-determine since<br />
the solution space includes infinite images satisfying D. To obtain a single solution, a quality<br />
criterion should be defined over the solution space so that the best image according to that<br />
∗ Address: HP Labs Israel, Technion City, Haifa 32000, Israel. Email: toky@hp.technion.ac.il<br />
1
R<br />
R<br />
R<br />
R<br />
G R G R G<br />
B<br />
G<br />
G<br />
R<br />
B<br />
G<br />
G<br />
R<br />
B<br />
G<br />
B G B G B<br />
G G G<br />
G G<br />
G G G<br />
G G<br />
B B B<br />
B B B<br />
Figure 1: A typical arrangement <strong>of</strong> photo-sensors in a CCD array (left). This arrangement<br />
provides three color bands whose pixel values are partially sampled (right). Note that in this<br />
example, the number <strong>of</strong> green samples is twice that <strong>of</strong> the red and the blue. This corresponds<br />
to the varying spatial resolution <strong>of</strong> the human visual system at different spectral wavelength.<br />
criterion will be chosen. Assuming P (I) specifies the probability that an image I is the<br />
acquired image, the maximum a posteriori (MAP) criterion defines the desired solution as<br />
the image Î that maximizes the a posteriori conditional probability:<br />
Î = arg max P (I|D) (1)<br />
I<br />
In general it is difficult to evaluate P (I|D) and the Bayes rule is applied to this end:<br />
P (D|I)P (I)<br />
P (I|D) = (2)<br />
P (D)<br />
Since D is already given, P (D) is constant and can be disregarded. As a result, estimating<br />
the a posteriori probability P (I|D) requires the evaluation <strong>of</strong> P (D|I) andP (I). The first<br />
term is typically easy to define and depends on the noise characteristics <strong>of</strong> the measured<br />
samples. On the other hand, modeling the a priori probability P (I) is a complicated task<br />
and can be critical for any reconstruction approach.<br />
2
Previous studies dealing with the demosaic problem suggested several alternatives to specify<br />
an image prior P (I). Brainard and Sherman [BS95, Bra94] use the spectral characteristics<br />
<strong>of</strong> natural images and the correlation between color bands to define a prior over the image<br />
population. With their approach the prior function is image independent and is calculated<br />
once and for all natural images. Keren [Ker96] suggested the use <strong>of</strong> an adaptive prior that<br />
is calculated for each specific image and changes over the location in the image based on the<br />
partial information available. Both approaches assume the smoothness <strong>of</strong> natural images in<br />
the spatial domain. This smoothness assumption is problematic in textured areas and near<br />
edges or lines where the smoothness assumption is incorrect. Applying the smoothness prior<br />
to these areas will result in blurred edges and a loss <strong>of</strong> high frequency details.<br />
This report suggests a new approach which exploits the correlation between neighboring<br />
information in the “steerable wavelet” representation. The advantage <strong>of</strong> working in the<br />
wavelet domain is that the smoothness assumption is applied in the appropriate scale and<br />
in the appropriate orientation. The demosaic results using this approach provides a faithful<br />
interpolation <strong>of</strong> missing samples while preserving edges and textures in the resulting image.<br />
The report is organized as follows: First, the basic problem and the suggested solution<br />
are presented for a simpler case; the reconstruction <strong>of</strong> a gray-scale images from its partial<br />
sampling. Next, the steerable wavelet decomposition is presented. Finally, the reconstruction<br />
<strong>of</strong> color images using the steerable wavelet decomposition is explained. It should be noted<br />
that though the current paper is written in the the context <strong>of</strong> demosaicing solutions, the<br />
suggested approach is also appropriate for a wide variety <strong>of</strong> reconstruction problems that<br />
can be dealt with using the same framework.<br />
2 Modeling Gray-Scale Natural <strong>Images</strong><br />
Many psychophysical and computational studies show that natural images have special characteristics<br />
forming a non uniform distribution over the image space (see e.g. [Ker87, OF96]).<br />
For example, it is widely assumed that the power spectra <strong>of</strong> natural images tend to be<br />
inversely proportional to their spatial frequencies [Fie93]. Additionally, it is shown that<br />
natural images are spatially and spectrally correlated within neighborhood areas [OF96]. In<br />
3
color images, the correlation is even more restrictive due to the fact that there is a strong<br />
correlation (or anti-correlation) between color bands [Wan95, HK84].<br />
2.1 Isotropic smoothness Model<br />
Previous approaches for the reconstruction <strong>of</strong> a single-band image used the Markov Random<br />
Field (MRF) model for introducing the prior probability P (I) [GG84, MMP87]. With this<br />
model, natural images are assumed to be isotropically “smooth” with probability conforming<br />
to the Gibbs distribution:<br />
P (I) = 1 Z e−Ψ(I)<br />
where Z is a normalization constant and Ψ(I) is a smoothness measure <strong>of</strong> the image I.<br />
Popular smoothness measures are the first order (membrane) and the second order (thin<br />
plate) energy forms:<br />
∫<br />
Ψ 1 (I) = ‖∇I‖ 2 dΩ<br />
Ω<br />
∫<br />
Ψ 2 (I) = ‖∇ 2 I‖ 2 dΩ<br />
where the integral is performed over the image support Ω.<br />
Ω<br />
Assuming the sampled values are D(x i ,y i ) and the measurement noise is a white zero mean<br />
Gaussian process with variance σ 2 , the conditional probability P (D|I) then follows the<br />
Gaussian distribution:<br />
P (D|I) = 1 ∑<br />
Z exp{− i(D(x i ,y i ) − I(x i ,y i ) 2 )<br />
}<br />
′ 2σ 2<br />
<strong>Using</strong>, for example, the second order MRF model, and plugging P (D|I) andP (I) aboveinto<br />
Equation 1 we obtain:<br />
Î = arg max<br />
I<br />
[ { ∑<br />
1<br />
Z exp −<br />
i(D(x i ,y i ) − I(x i ,y i ) 2 ∫<br />
}]<br />
)<br />
− ‖∇ 2 I‖ 2 dΩ<br />
′′ 2σ 2<br />
Ω<br />
It is easy to verify that maximizing the above expression is equivalent to minimizing:<br />
C(I|D) =<br />
∑<br />
i(D(x i ,y i ) − I(x i ,y i ) 2 ∫<br />
)<br />
+ λ ‖∇ 2 I‖ 2 dΩ (3)<br />
2σ 2<br />
Ω<br />
4
This cost function consists <strong>of</strong> two terms: the first term penalizes pixel values not conforming<br />
with the sampled values, and the second term penalizes for a non smooth solution. The<br />
variable λ is a tuning parameter that determines the relative weight <strong>of</strong> the smoothing term<br />
in the total cost.<br />
Minimizing Equation 3 yields a solution that compromises between the sampling values and<br />
the smoothness term. Due to the prior assumption that natural images are isotropically<br />
“smooth”, areas in the image that are indeed “smooth” will be reliably reconstructed. However,<br />
edges, lines, and textured areas in the original image that do not conform with the<br />
prior model will be blurred. Moreover, if the sampling values are assumed to be error free<br />
(i.e. noise variance is zero), oscillating artifacts will appear near edges. This is demonstrated<br />
in Figure 2. The upper figure shows partial sampling <strong>of</strong> the green band as taken by a digital<br />
camera Kodak DCS-200. The lower figure shows the reconstructed image using an iterative<br />
scheme that minimizes Equation 3 where the sampled values are assumed to be error free.<br />
The oscillating artifacts near edges and lines are demonstrated (see, for example, the net<br />
pattern in between the rungs in the chair back).<br />
5
Figure 2: Upper figure: The green band <strong>of</strong> a sampled image taken by a digital camera (Kodak<br />
DCS-200). Lower figure: Reconstructed figure using the isotropic smoothness assumption.<br />
6
2.2 Directional Smoothness Model<br />
As mentioned in the previous section, the main problem with the isotropic smoothness model<br />
is the interpolation near edges and in textured areas where the smoothness assumption is<br />
incorrect. For this end, several alternatives were suggested, all <strong>of</strong> them model a typical image<br />
as a piecewise constant or a piecewise linear function. Anisotropic diffusion [Pm90], robust<br />
statistics [MMRK91], and regularization with line processes [GG84], were developed to treat<br />
image interpolation and reconstruction with discontinuities. In recent studies [BZ87, BR96,<br />
BSmH97] all the above approaches were shown to be theoretically equivalent.<br />
This work is similar in spirit to these approaches, namely, interpolation is performed along<br />
edges and not across edges. Previous methods are based on the localization <strong>of</strong> edges using<br />
gradient operations and preventing the interpolation from crossing these edges. This leads<br />
to two main difficulties: The gradient is a too local feature and thus produces many spurious<br />
edges especially when the data is sparsely sampled as in our case. Additionally, these<br />
approaches operate on a single scale <strong>of</strong> the image. Since edges can appear in different scales,<br />
only part <strong>of</strong> the edges are correctly treated. In this work the interpolation is based on the<br />
orientation <strong>of</strong> the underlying edges which is a more global feature and therefore less sensitive<br />
to missing data and noise. Furthermore, the interpolation is performed in a multi-scale<br />
manner and thus deals with each edge in its appropriate scale.<br />
In this work a more intuitive prior assumption is given to natural images. Natural images<br />
are considered as 2D functions with sharp edges at different scales and different orientations.<br />
This prior is in accord with statistical [OF96], neuro-physiological [SGVE89], and<br />
psychophysical [BA91] studies where natural images are said to contain localized, oriented,<br />
and bandpass structures.<br />
In order to efficiently obtain the particular structure <strong>of</strong> a given image with respect to the<br />
above properties a multi-scale and multi-orientation representation should be applied to the<br />
image. The multi-scale representation can be implemented using the Laplacian pyramid<br />
decomposition [BA83]. The Laplacian pyramid decomposes an image I into a set <strong>of</strong> band-<br />
7
pass components:<br />
I = ∑ s<br />
B s<br />
where each band B s represents a particular scale in the Laplacian pyramid.<br />
The multiorientation<br />
representation can be applied using steerable filters decomposition where B s is<br />
decomposed into a linear set <strong>of</strong> oriented bands:<br />
B s = ∑ d<br />
B s,d<br />
where the sum is performed over the orientation bands d =0..m − 1, and the preferred<br />
direction<strong>of</strong>eachbandisθ d = πd.<br />
The entire decomposition with respect to scale and<br />
m<br />
orientation is referred to as the steerable wavelet decomposition [FA90]. The main advantage<br />
<strong>of</strong> the steerable wavelet decomposition is that the image response can be recovered for any<br />
direction. Thus, if B s,d represents the image response along the preferred direction θ d then<br />
the image response along an arbitrary direction θ can be calculated by a weighted sum <strong>of</strong><br />
{B s,d }:<br />
B s,θ =<br />
m−1 ∑<br />
k=0<br />
h k (θ)B s,d<br />
where h k are known functions that depend on the the angle θ. Typically, it is common to<br />
assume that high value <strong>of</strong> a particular coefficient B s,d (p) suggests for an oriented structure<br />
in the image, located at p with direction θ d and scale s. However, this is not always true<br />
since the transform coefficient is phase dependent. In order to nullify the phase factor it is<br />
necessary to apply the Hilbert transform 1 <strong>of</strong> the steerable wavelets as well [Bra78]. A pair<br />
<strong>of</strong> filters which are Hilbert transforms <strong>of</strong> each other form a quadrature pair. Thus, for each<br />
scale and orientation we have a pair <strong>of</strong> bands B s,d and ˆB s,d from which an oriented structure<br />
can be deduced. The squared sum <strong>of</strong> two coefficients forming a quadrature pair represents<br />
the (phase independent) energy <strong>of</strong> the signal at the particular frequencies represented by the<br />
quadrature filters. In our case, a high energy response in:<br />
E s,d (p) =B 2 s,d(p)+ ˆB 2 s,d(p)<br />
indicates an oriented structure in the image, located at p with direction θ d and scale s. If<br />
the Hilbert bands are steerable as well (and we design them to be such) then it is possible<br />
1 Hilbert transform <strong>of</strong> a filter has the same frequency response with a phase shift <strong>of</strong> 90 ◦ .<br />
8
to “steer” the energy response in a similar manner for any orientation θ:<br />
E s,θ (p) =Bs,θ(p)+ 2 ˆB s,θ(p)<br />
2<br />
In this manner, the directional energy which is the energy response at a particular preferred<br />
direction and in a particular scale can be calculated.<br />
An example <strong>of</strong> steerable wavelet decomposition applied to a naive interpolation (bilinear)<br />
<strong>of</strong> the chair image is presented in Figure 3. In this decomposition we have chosen three<br />
scales and four orientations. The wavelet bands {B s,d } along with their quadrature pairs are<br />
presented. Figure 4 shows the energy response <strong>of</strong> each band calculated by a squared sum <strong>of</strong><br />
its quadrature pairs. Bright areas indicate an oriented structure at the particular direction<br />
and scale.<br />
Under the assumption that natural images contain sharp edges at different scales and different<br />
orientations, it is very probable that the coefficient values in the Laplacian pyramid<br />
will have similar values along directions with high directional energy responses. I.e. if E s,θ<br />
is high, and a neighboring pixel q is at direction θ from p, then the difference |B s (p) − B s (q)|<br />
should be small. This assumption can be expressed as a prior probability for a Laplacian<br />
band as follows:<br />
P (B s )= 1 Z e−Ψ 3(B s)<br />
where Ψ 3 is a directional smoothness function measuring the extent <strong>of</strong> smoothness <strong>of</strong> the<br />
coefficient band B s according to the directional energy E s,θ . For example, adopting the<br />
membrane energy form for smoothing, the directional smoothness measure will be:<br />
Ψ 3 (B s )= ∑ ∑<br />
g(E s, ⃗pq (p))(B s (p) − B s (q)) 2<br />
p q∈N(p)<br />
where N(p) is the local neighborhood <strong>of</strong> p, and ⃗pq is the angle representing the direction<br />
<strong>of</strong> q from p. The function g(z) is an increasing monotonic function adjusting the strength<br />
<strong>of</strong> this smoothness criterion according to the directional energy. Assuming the Laplacian<br />
coefficients are uncorrelated along scales we have that the joint probability <strong>of</strong> the entire set<br />
<strong>of</strong> Laplacian coefficients B = {B s } is a chain multiplication <strong>of</strong> priors:<br />
P (B 1 ,B 2 , ···)=P (B) = ∏ s<br />
P (B s )<br />
9
Figure 3: The <strong>Steerable</strong> <strong>Wavelets</strong> decomposition applied to a naive interpolation <strong>of</strong> the chair<br />
image. Three scales are presented (top to bottom: 1st, 2nd, and the 3rd octaves). At each<br />
scale eight steerable filters were applied; four 10directions<br />
were sampled where two steerable<br />
filters (forming a quadrature pair) were applied at each direction.
Figure 4: An energy response calculated by the squared sum <strong>of</strong> the quadrature values. Three<br />
scales (top to bottom) and four orientation (left to right) are presented. Bright areas indicate<br />
an oriented structure at the particular orientation and scale.<br />
Since the decomposed image I defines uniquely its Laplacian coefficients (even though the<br />
Laplacian forms an over-complete representation) the prior distribution <strong>of</strong> B is proportional<br />
to the prior <strong>of</strong> natural images:<br />
∫<br />
∫<br />
P (I) = P (I|B)P (B)dB = δ(I − ∑ B s )P (B)dB ∝ P (B ∗ ) where I = ∑ Bs<br />
∗<br />
s<br />
s<br />
Plugging this into Equations 2 and 3 we find that minimizing the cost function C(I|D)<br />
(Equation 3) can be performed alternatively by minimizing a corresponding term involving<br />
the Laplacian coefficients B:<br />
∑<br />
C(I|D) ∝ C(B|D) =<br />
i(D(x i ,y i ) − I(x i ,y i ) 2 )<br />
+ λ ∑ Ψ<br />
2σ 2<br />
3 (Bs) ∗ (4)<br />
s<br />
The minimization <strong>of</strong> C(I|D) can be performed iteratively using a gradient descent procedure.<br />
The iterations are performed in two steps minimizing the data term and the smoothness term<br />
11
alternately. If Bs t is the set <strong>of</strong> the Laplacian coefficients at iteration t, the following iterative<br />
scheme will minimize the smoothness term:<br />
Bs<br />
t+1 (p) =Bs(p)+ t β Z<br />
∑<br />
q∈N(p)<br />
g(E s, ⃗pq (p))(B t s(q) − B t s(p))<br />
where β is a scalar parameter adjusting the convergence rate, and Z is a normalization<br />
constant Z = ∑ q∈N(p) g(E s, ⃗pq (p)). Note that the difference Bs(q)−B t s(p) t isweightedbyE s, ⃗pq ,<br />
thus, at each location p the Laplacian band B s is directionally diffused along orientations with<br />
high directional energies. A similar iteration procedure is performed in order to minimize<br />
the data term. At step t the following iteration is performed:<br />
I t+1 (p) =I t (p)+γ(D(p) − I t (p))<br />
The scalar γ is similarly a convergence parameter depending on the error variance σ. If<br />
D(p) is error free (σ = 0 as we assume in our case) γ is one and the iteration rule becomes:<br />
I t+1 (p) =D(p). In this case, combining the two steps into one minimization procedure<br />
results in an algorithm as illustrated in Figure 5.<br />
The effect <strong>of</strong> smoothing along the preferred orientations is demonstrated in Figures 6 and 7.<br />
In Figure 6 the diffusion was performed only along the vertical direction. It can be seen that<br />
vertical lines and edges were reliably interpolated while other edges remained unchanged.<br />
Figure 7 shows a diffusion along all directions where four directional bands were used. In<br />
this case edges and lines in all orientations were reliably interpolated.<br />
12
Raw Image<br />
Naive interpolation<br />
Laplacian Pyramid<br />
<strong>Steerable</strong> Pyramid<br />
for each scale<br />
smooth along<br />
prefered orientations<br />
collapse pyramid<br />
reset original samples<br />
Figure 5: Domosaicing algorithm for error free sampled data.<br />
13
Figure 6: Directional interpolation <strong>of</strong> the green band taken by the Kodak DCS-200 camera.<br />
The interpolation was performed only for those bands whose preferred orientation were<br />
vertically oriented. The rest <strong>of</strong> the image remains unchanged.<br />
Figure 7: Directional interpolation <strong>of</strong> the green band taken by the Kodak DCS-200 camera.<br />
The interpolation was perform for all directions.<br />
14
3 <strong>Steerable</strong> <strong>Wavelets</strong> and Local Orientation<br />
The wavelet transform has become a popular image representation in recent years.<br />
transform gained its popularity due to several useful properties:<br />
The<br />
• Its basis functions are localized both in spatial and frequency domains.<br />
• It decomposes an image into multi-scale and multi-orientation components which is a<br />
useful property in many processing tasks.<br />
• It exploits the local correlations in natural images (signals), and thus its coefficients<br />
are (relatively) uncorrelated.<br />
The wavelet decomposition is appropriate for our task since its coefficients capture multi-scale<br />
and multi-orientation structures in the image. However, the conventional Wavelet transform<br />
is inappropriate to this end due to the fact that it is not shift-invariant nor rotation-invariant.<br />
Figure 8 demonstrates this problem (taken from [SFAH92]).<br />
Actually, every critically sampled transform will be variant to shift or rotation [SFAH92].<br />
To overcome this problem it is essential to perform an over-complete transform (the number<br />
<strong>of</strong> coefficients is greater than the number <strong>of</strong> pixels). This is not a problem in our case since<br />
our aim is image analysis and not image coding.<br />
The steerable wavelet decomposition [FA90] is a wavelet-like transform that is invariant to<br />
shift and rotation and thus appropriate for our task. It is an over-complete representation<br />
having the following properties:<br />
• Its basis functions are shifted, scaled, and rotated versions <strong>of</strong> a “mother wavelet”; If<br />
M(x, y) is a mother wavelet, then each basis kernel W s,d can be constructed by:<br />
W s,d = R θd M(sx, sy)<br />
where (sx, sy) is a scaling by s, andR θd represents a rotation by θ d . Each wavelet<br />
band B s,d is a result <strong>of</strong> convolving the image I with the corresponding basis kernel:<br />
B s,d = I ∗ W s,d<br />
15
1<br />
1<br />
2<br />
2<br />
3<br />
3<br />
Figure 8: Assume the signal to be transformed (upper left) is composed <strong>of</strong> a particular wavelet<br />
basis function w k (x). All <strong>of</strong> the wavelet coefficients <strong>of</strong> this signal will have zero values except<br />
for the coefficient corresponding to the k th basis function. Now, if we shift the signal by one<br />
pixel (upper right), the coefficients <strong>of</strong> the new signal might be distributed in all the wavelet<br />
levels (right). In translation invariant transforms the coefficients <strong>of</strong> the translated signal are<br />
similarly translated. This example is taken from [Simoncelli et. al. 1992] .<br />
• It is a self-invertible transform (the synthesis functions and the analysis functions are<br />
identical).<br />
• It is shift and rotation invariant. Therefore, its coefficients form smooth structures and<br />
graceful changes in the wavelet domain.<br />
• It has a flat response (the sum <strong>of</strong> squares <strong>of</strong> the basis functions is constant for all<br />
(x, y)).<br />
• Its basis functions are similar to the the receptive fields <strong>of</strong> the simple cells in the visual<br />
cortex.<br />
• Most important: it is possible to recover the filter response in any direction. I.e. if the<br />
16
ands B s,d (d =0..m − 1) are the signal responses in preferred directions θ d then<br />
∀θ ∈ [0 ···2π] B s,θ =<br />
m−1 ∑<br />
d=0<br />
h d (θ)B s,d<br />
where {h d } m−1<br />
d=0<br />
<strong>of</strong> these filters.<br />
are known interpolation functions. This is the “steerability” property<br />
The last property is very useful is our case. The “steerability” property allows us to calculate<br />
the directional energy <strong>of</strong> an image at any chosen direction by “steering” the directional<br />
energy. In [FA91] Freeman and Adelson explain how to calculate the directional energy<br />
from a set <strong>of</strong> steerable filters and their Hilbert transforms (forming quadrature pairs). The<br />
directional energy is phase-independent due to the phase asymmetry <strong>of</strong> the quadrature filter<br />
pair [Bra78]. Freeman and Adelson [FA91] suggested a set <strong>of</strong> steerable quadrature pairs based<br />
on derivatives <strong>of</strong> a Gaussian. They provide filter taps with the appropriate interpolation<br />
functions {h d }.<br />
An alternative approach for calculating the direction with the highest energy response, denoted<br />
by local orientation, is suggested by Haglund et. al. [HKG93]. The local orientation<br />
d s (p) is a vector associated with the position p and scale s denoting the dominant direction in<br />
the neighborhood <strong>of</strong> p. The strength <strong>of</strong> the local orientation is represented by the magnitude<br />
<strong>of</strong> d s (p) and its direction is half <strong>of</strong> the angle formed by d s (p). Since the local orientation<br />
angle can varies from 0 to π, doubling the angle gives the range <strong>of</strong> 2π and thus is efficient<br />
in terms <strong>of</strong> direction continuity (see [Jah95] for more details). The approach <strong>of</strong> Haglund et.<br />
al. is an approximation <strong>of</strong> the steerable filters since it can recover only the energy response<br />
along the “local orientation”. However, its calculation is somewhat simpler. Given a local<br />
orientation d s (p), the directional energy along θ can be approximated by projecting d s (p)<br />
onto a unit vector n θ =(cos(2θ), sin(2θ)):<br />
E s,θ (p) =d s (p) · n θ<br />
With this approach the Hilbert transforms <strong>of</strong> the steerable filters W s,d are not necessarily<br />
steerable. Haglund suggested using a set <strong>of</strong> polar separable filters whose transfer functions<br />
17
can be separated into angular parts and radial parts. In the frequency domain (u 1 ,u 2 )this<br />
type <strong>of</strong> filters are conveniently expressed in polar coordinates:<br />
Ŵ s,d = Ŝs(q) ˆD d (θ)<br />
where the notation ˆX denotes the Fourier transform <strong>of</strong> X. The radial part Ŝs(q) isa<br />
√<br />
function <strong>of</strong> q = u 2 1 + u 2 2 and is in practice a band pass filter that can be implemented by<br />
the Laplacian Pyramid scheme. The angular part ˆD d (θ) is a function <strong>of</strong> θ =tan −1 (u 2 /u 1 ).<br />
Haglund suggested the use <strong>of</strong> a set <strong>of</strong> quadrature pairs with the following angular parts:<br />
where θ d = πd<br />
m<br />
Ŵ e s,d = Ŝs(q)cos 2l (θ − θ d )<br />
Ŵ o s,d = Ŝs(q)i cos 2l (θ − θ d )signum(cos(θ − θ d ))<br />
for d =0, ···,m−1. The indices e and o denote the even and odd components<br />
<strong>of</strong> the quadrature pair. The parameter l determines the angular resolution <strong>of</strong> these filters. It<br />
is necessary that m>l+ 1 (see [Jah95]). Note that the even component filters are steerable<br />
while the odd components are not. If we represent the local orientation d s (p) asacomplex<br />
number whose magnitude corresponds to the strength measure and its angle is double the<br />
local direction then the local orientation can be calculated by the following sum (see [Jah95]<br />
for a pro<strong>of</strong>):<br />
d s (p) = ∑ d<br />
e i2θ d<br />
E s,d (p) where E s,d =(I ∗ K e s,d) 2 +(I ∗ K o s,d) 2<br />
An example <strong>of</strong> steerable filters with their Hilbert transform for a single scale is given in Figure<br />
9. The decomposition <strong>of</strong> the frequency domain using these filters for m = 3 is illustrated<br />
in Figure 10. The division into rings represents the multi-scale decomposition, while the<br />
devision into sectors represents the multi-orientation decomposition.<br />
We use the steerable filters in our demosaicing process in order to calculate local orientations.<br />
The results <strong>of</strong> applying three sets <strong>of</strong> quadrature steerable filters (three different scales) to<br />
a naive interpolation (bilinear) <strong>of</strong> the raw chair image is presented in Figure 3. From these<br />
outputs it is possible to calculate the local orientations as explained. The calculated local<br />
orientations for three scales are shown in Figure 11.<br />
18
Figure 9: Four kernels <strong>of</strong> steerable filters (top row) and their Hilbert transforms (bottom row)<br />
<strong>of</strong> the 4th octave.<br />
Figure 10: Multi-scale and multi-orientation decomposition <strong>of</strong> the frequency domain performed<br />
using the <strong>Steerable</strong> <strong>Wavelets</strong>. The division into rings represents the multi-scale decomposition<br />
and the division into sectors represents the multi-orientation decomposition. The grey areas<br />
represent a particular filter with a preferred direction <strong>of</strong> 135 ◦ .<br />
19
Figure 11: Flow diagrams <strong>of</strong> the local orientation calculated for three scales <strong>of</strong> the chair<br />
image. At each pixel the direction and the strength <strong>of</strong> the local orientation is represented by<br />
an oriented line segment.<br />
20
4 <strong>Demosaicing</strong> <strong>of</strong> <strong>Color</strong> <strong>Images</strong><br />
At a first glance it would seem that demosaicing <strong>of</strong> color images can be performed by applying<br />
a directional smoothing to each color band (red green and blue) separately. The directional<br />
energy should be calculated once, for example, from the luminance image, and directional<br />
smoothing <strong>of</strong> each band can be implemented accordingly. With this approach, the correlation<br />
between the color bands is expressed by the fact that a single directional energy map is<br />
used. Unfortunately, this approach does not give satisfactory results: Smoothing along<br />
dominant orientations indeed retains the sharpness <strong>of</strong> edges, however, the location <strong>of</strong> these<br />
edges might be subject to small shifts. These small shifts are due to the mis-registration <strong>of</strong><br />
the color samplings. Misalignment <strong>of</strong> edges along the color bands results in color artifacts<br />
in the demosaic image. This behavior is demonstrated in Figure 12. Figure 13 shows<br />
the demosaicing result <strong>of</strong> the chair image after directional smoothing <strong>of</strong> each color band<br />
separately. <strong>Color</strong> artifacts are noticeable.<br />
To overcome this problem, a possible solution is to enforce a smooth structure in the color<br />
values. However, care should be taken so that edges and lines in the image will not be<br />
affected by this smoothing. An efficient color representation space in which color smoothing<br />
can be applied is the luminance-chrominance color representation. This representation can<br />
be obtained by linearly transforming the RGB values into YIQ values using the following<br />
transformation: ⎛ ⎞ ⎛<br />
⎞ ⎛ ⎞<br />
Y 0.299 0.587 0.114 R<br />
⎜ ⎟ ⎜<br />
⎟ ⎜ ⎟<br />
⎝ I ⎠ = ⎝ 0.596 −0.274 −0.322 ⎠ ⎝ G ⎠<br />
Q 0.211 −0.253 0.312 B<br />
In the YIQ representation the Y component represents the luminance (intensity) <strong>of</strong> the image<br />
and the IQ components represent the chrominance. Such a representation is appropriate for<br />
our task due to two reasons:<br />
• The luminance-chrominance is an uncorrelated color representation and as such enables<br />
treatment <strong>of</strong> each color band separately [Wan95].<br />
• The human visual system is more sensitive to high frequencies in the luminance band<br />
(Y) than in the chrominance bands (IQ). In fact, in the chrominance bands, the human<br />
21
original image<br />
and sampled colors<br />
red reconstruction<br />
green reconstruction<br />
resulting image<br />
Figure 12: Top: A two-band color image with the corresponding color samples. Middle: The<br />
cross sections <strong>of</strong> the interpolated color bands. The reconstructed steps are sharp due to the<br />
directional smoothing. Bottom: A stripe <strong>of</strong> color artifact due to misalignment <strong>of</strong> the step<br />
edges in the interpolated bands.<br />
visual system is only sensitive to low frequencies. This is shown in Figure 14 (from<br />
[PW93]).<br />
Since edges, lines, and textures are composed <strong>of</strong> high frequencies, their appearance is influenced<br />
mainly by the luminance component. This phenomena enables us to enforce a<br />
smooth structure in the chrominance bands while preserving high frequency structures in<br />
the luminance band. The updated algorithm for demosaicing will include two pathways. A<br />
given image is now transformed into a luminance band and two chrominance bands. The<br />
luminance band is directionally smoothed according to the algorithm described in Section<br />
2.2. The chrominance bands, however, are isotropically smoothed by a convolution with a<br />
Gaussian kernel. The resulting values are then transformed back into the RGB representation<br />
and the original samples are reset to their original values. This process is performed<br />
several times iteratively until a satisfactory result is produced. In our simulations three to<br />
22
Figure 13: A demosaic image after applying the directional smoothing on each color band<br />
separately. Note the color artifacts near edges.<br />
four iterations produce good results. The suggested algorithm is illustrated in Figure 15.<br />
5 Results<br />
The proposed algorithm was tested on a wide variety <strong>of</strong> images. Some <strong>of</strong> them were acquired<br />
by the Kodak digital camera (DCS-200) where raw data was provided as well as the demosaic<br />
images. These images supply an objective comparison between existing demosaicing<br />
algorithm (Kodak’s) and the suggested method. The rest <strong>of</strong> the test images were generated<br />
from given RGB images where raw data was produced by taking a partial sampling <strong>of</strong> the<br />
original values, simulating a digital camera. Figures 16, 17 and 18 are three examples <strong>of</strong><br />
demosaic images produced by the suggested algorithm, along with the results provided by<br />
the Kodak camera. It can be seen that the Kodak algorithm produces color artifacts mainly<br />
along edges and in textured areas (the chair and grass areas in Figures 16, 17, and the wood<br />
pattern in Figure 18). These artifacts were drastically reduced using the suggested approach.<br />
Figures 19 and 20 are two examples <strong>of</strong> demosaic images along with the original RGB images.<br />
23
2.0<br />
1.0<br />
Contrast sesnsitivity<br />
0.5<br />
0.2<br />
0.1<br />
0.2 0.5 1.0 2.0 4.0 8.0<br />
Spatial frequency (cpd)<br />
Figure 14: Luminance-chrominance sensitivity <strong>of</strong> the human visual system with respect to<br />
spatial frequency. The solid line represents the luminance sensitivity while the dashed and the<br />
dotted lines represent the chrominance sensitivities. Taken from [Poirson and Wandell 1993].<br />
Indeed, color artifacts were reduced, however, due to the lower sampling rate, the demosaic<br />
images are slightly blurred compared to the originals. Image 21 is a good example demonstrating<br />
the limitation <strong>of</strong> the suggested approach and actually <strong>of</strong> any demosaic algorithm.<br />
Due to the perspective warp in this image, the fence rungs <strong>of</strong> the lighthouse form a monotonically<br />
increasing frequency pattern. At a particular frequency, the demosaic algorithm<br />
breaks down and produces a strong color aliasing. Notice that the aliasing artifacts occur in<br />
the area where the rungs falls on every other pixel which is exactly the Nyquist frequency <strong>of</strong><br />
this image. This demonstrates that the demosaic algorithm cannot recover high frequencies<br />
above the Nyquist limit.<br />
6 Computational Aspects<br />
The computation cost <strong>of</strong> the proposed algorithm is composed <strong>of</strong> three parts:<br />
1. The transformation <strong>of</strong> the RGB image into YIQ representation.<br />
2. The decomposition <strong>of</strong> the luminance band into the steerable wavelets representation.<br />
24
Raw RGB Image<br />
Naive interpolation<br />
Chrominance<br />
Luminance<br />
Laplacian Pyramid<br />
<strong>Steerable</strong> Pyramid<br />
smooth isotropically<br />
for each scale<br />
smooth along<br />
prefered directions<br />
collapse pyramid<br />
Demosaic<br />
RGB image<br />
Figure 15: <strong>Demosaicing</strong> algorithm <strong>of</strong> color images.<br />
This includes the application <strong>of</strong> two filters per each directions (the quadrature pair)<br />
and a repetition <strong>of</strong> the directional decomposition for each scale level.<br />
3. The directional smoothing <strong>of</strong> the luminance component and the isotropic smoothing<br />
<strong>of</strong> two chrominance components.<br />
This complexity can be drastically reduced if some approximations are performed. First,<br />
since the demosaic color artifacts take place mainly in the high frequencies, it is possible to<br />
work in the highest scale level or even in the original image space. This, <strong>of</strong> course, will not<br />
perform well in the low frequencies domain, however, we assume that low frequencies are<br />
interpolated quite accurately. Next, the number <strong>of</strong> directional decomposition can be reduced.<br />
We used a four directional decomposition, which required the application <strong>of</strong> eight filters,<br />
25
Figure 16: Demosaic results <strong>of</strong> color images. Left: The demosaic result <strong>of</strong> the chair image as<br />
produced by the Kodak camera algorithm. Note the color artifacts near the chair rungs and<br />
in the grass area. Right: The demosaic result using the suggested approach.<br />
however, three directional decomposition gives reasonable results as well. Finally, since the<br />
RGB to YIQ transformation and the smoothing operation are both linear operations, it is<br />
possible to propagate the smoothing operation into the RGB space. This will eliminate the<br />
need to transform from RGB to YIQ and visa versa at each iteration. Additionally, working<br />
in the RGB space can avoid the calculations <strong>of</strong> pixel values existing in the original sampled<br />
image.<br />
7 Conclusion<br />
A new demosaic algorithm is proposed which interpolates a color image given its partial sampling<br />
from a digital camera. The technique is based on the steerable wavelets decomposition<br />
where image values are interpolated in their appropriate scale and in their appropriate direction.<br />
The interpolation is performed in the luminance-chrominance color representation.<br />
Chrominance values are interpolated using the classical regularization approach. Luminance<br />
values are interpolated using a directional regularization scheme. This approach gives a<br />
26
faithful interpolation <strong>of</strong> edges and textured areas while reducing color artifacts.<br />
Acknowledgments<br />
Y.H would like to thank Joyce Farrell, Michael Harville, and Poorvi Vora for introducing him<br />
to the demosaic problem and for providing the comparison results <strong>of</strong> the proposed algorithm.<br />
27
Figure 17: Demosaic results <strong>of</strong> color images. Top: The demosaic result as produced by the<br />
Kodak camera algorithm. Bottom: The demosaic result using the suggested approach.<br />
28
Figure 18: Top: The demosaic result as produced by the Kodak camera algorithm. Bottom:<br />
The demosaic result using the suggested approach.<br />
29
Figure 19: Left: The original RGB image. Right: A demosaic result using a partial sampling<br />
<strong>of</strong> the original image.<br />
30
Figure 20: Top: The original RGB image. Bottom: A demosaic result using a partial sampling<br />
<strong>of</strong> the original image.<br />
31
Figure 21: Left: The original RGB image. Right: A demosaic result using a partial sampling<br />
<strong>of</strong> the original image.<br />
32
8 References<br />
[BA83]<br />
[BA91]<br />
[BR96]<br />
P.J. Burt and E.H. Adelson. The laplacian pyramid as a compact image code.<br />
IEEE Trans. Communications, 31(4):532–540, 1983.<br />
J.R. Bergen and E.H. Adelson. Theories <strong>of</strong> visual texture perception. In D. Regan,<br />
editor, Spatial Vision. CRS press, 1991.<br />
M. Black and A. Rangarajan. On the unification <strong>of</strong> line processes, outlier rejection,<br />
and robust statistics with applications in early vision. International<br />
Journal <strong>of</strong> Computer Vision, 19(1):57–91, 1996.<br />
[Bra78] R.N. Bracewell. The Fourier Transform and its Applications. McGraw-Hill,<br />
1978.<br />
[Bra94]<br />
[BS95]<br />
[BSmH97]<br />
D.H. Brainard. Bayesian method for reconstructing color images from trichromatic<br />
samples. In Proc. <strong>of</strong> the IS&T /ICPS, 1994.<br />
D.H. Brainard and D. Sherman. Reconstructing images from trichromatic samples:<br />
From basic research to practical applications. In Proc. <strong>of</strong> the IS&T /SID,<br />
1995.<br />
M. Black, G. Sapiro, D. marimont, and D. Heeger. Robust anisotropic diffusion.<br />
Submitted, 1997.<br />
[BZ87] A. Blake and A. Zisserman. Visual Reconstruction. MIT Press, 1987.<br />
[FA90]<br />
[FA91]<br />
[Fie93]<br />
W.T. Freeman and E.H. Adelson. <strong>Steerable</strong> filters for early vision, image analysis,<br />
and wavelet decomposition. In International Conf. on Computer Vision,<br />
pages 406–415, 1990.<br />
W.T. Freeman and E.H. Adelson. The design and use <strong>of</strong> steerable filters. IEEE<br />
Trans. Pattern Analysis and Machine Intelligence, 13(9):891–906, 1991.<br />
D. Field. Scale-invariance and self-similar wavelet transforms: an analysis <strong>of</strong><br />
natural scene and mammalian visual systems. In <strong>Wavelets</strong>, Fractals, and Fourier<br />
Transforms. Eds. Oxford University Press, 1993.<br />
33
[GG84] S. Geman and D. Geman. Stochastic relaxation, gibbs distribution, and the<br />
bayesian restoration <strong>of</strong> images. IEEE Trans. Pattern Analysis and Machine<br />
Intelligence, 6:721–741, 1984.<br />
[HK84] B.R. Hunt and O. Kubler. Karhunen-loeve multi-spectral image restoration.<br />
IEEE Trans. Acoustics, Speech, and Signal Processing, 32(3):592–599, 1984.<br />
[HKG93]<br />
[Jah95]<br />
[Ker87]<br />
[Ker96]<br />
L. Haglund, H. Knutsson, and G.H. Granlund. Scale and orientation adaptive<br />
filtering. In Proceedings <strong>of</strong> the 8th Scandinavian Conference on Image Analysis,<br />
pages 847–855, 1993.<br />
B. Jahne. Digital Image Processing, Concepts, Algorithms, and Scientific Applications.<br />
Springer-Verlag, 1995.<br />
D. Kersten. Predictability and redundancy <strong>of</strong> natural images. Journal <strong>of</strong> the<br />
Optical Society <strong>of</strong> America, 4:2395–2400, 1987.<br />
D. Keren. An adaptive bayesian approach to demosaicing color images. Technical<br />
Report HPL-96-129, Hewlett-Packard, 1996.<br />
[MMP87] J. Marroquin, J. Mitter, and T. Poggio. Probabilistic solution <strong>of</strong> ill-posed<br />
problems in computational vision. Journal <strong>of</strong> the Optical Society <strong>of</strong> America,<br />
82(397):76–89, 1987.<br />
[MMRK91] P. Meer, D. Mintz, A. Rosenfeld, and D.Y. Kim. Robust regression methods for<br />
computer vision: A review. International Journal <strong>of</strong> Computer Vision, 6(1):59–<br />
70, 1991.<br />
[OF96]<br />
[Pm90]<br />
B.A. Olshausen and D.J. Field. Emergence <strong>of</strong> simple-cell receptive field properties<br />
by learning a sparse code for natural image. Nature, 381:607–609, 1996.<br />
P. Perona and J. malik. Scale-space and edge detection using anisotropic diffusion.<br />
IEEE Trans. Pattern Analysis and Machine Intelligence, 12(7):629–639,<br />
1990.<br />
34
[PW93]<br />
[SFAH92]<br />
[SGVE89]<br />
A.B. Poirson and B.A. Wandell. The appearance <strong>of</strong> colored patterns: Patterncolor<br />
seperability. Journal <strong>of</strong> the Optical Society <strong>of</strong> America, 12:2458–2471,<br />
1993.<br />
E.P. Simoncelli, W.T. Freeman, E.H. Adelson, and D.J. Heeger. Shiftable multiscale<br />
transforms. IEEE Trans. Information Theory, 38(2):587–607, 1992.<br />
M.S. Silverman, D.H. Gros<strong>of</strong>, R.L De Valois, and S.D. Elfar. Spatial frequency<br />
organization in primate striate cortex. Proc. Natl. Aca. Sci. U.S.A., 86(2):711–<br />
715, 1989.<br />
[Wan95] B. Wandell. Foundations <strong>of</strong> Vision. Sinaur Associates, 1995.<br />
35