Asteroid Spectroscopy
Asteroid Spectroscopy
Asteroid Spectroscopy

You also want an ePaper? Increase the reach of your titles
YUMPU automatically turns print PDFs into web optimized ePapers that Google loves.
Lecture #2<br />
<strong>Asteroid</strong> <strong>Spectroscopy</strong><br />
Principles and Practice
Characterizations of <strong>Asteroid</strong> Surface<br />
Materials<br />
Only one in situ characterization has been<br />
carried out for an asteroid surface<br />
– Gamma Ray Spectrometer (XGRS) on the NEAR<br />
Mission after the spacecraft landed<br />
– Successful “target of opportunity”<br />
All other characterizations of asteroid surface<br />
materials have been by remote sensing
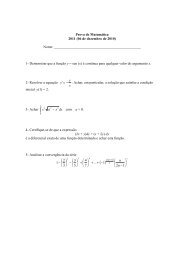
HAYABUSA Sample Return Mission<br />
A large number of microscopic particles<br />
have been recovered from the sample return<br />
capsule.<br />
At this time, it was not known whether these<br />
were collected from asteroid Itokawa.
Most “Compositional” Determinations<br />
rely on the Interaction of Electromagnetic<br />
Radiation with a Target<br />
Nuclear<br />
Interactions<br />
Inner Shell<br />
Electron<br />
Interactions<br />
Outer Shell<br />
Electron<br />
Interactions<br />
Vibrational<br />
Interactions<br />
Electromagnetic Spectrum
Remote Sensing Techniques for<br />
Characterizing the “Composition” of<br />
<strong>Asteroid</strong> Surfaces<br />
Visible-Near Infrared (VNIR) <strong>Spectroscopy</strong><br />
– Sunlight reflected from surface<br />
Thermal Infrared (TIR) <strong>Spectroscopy</strong><br />
– Infrared radiation emitted by surface<br />
Radar<br />
– Reflected “radio wavelength” radiation<br />
X-ray and Gamma-ray spectroscopy<br />
– High energy photons emitted by excited atoms<br />
and excited / unstable atomic nuclei.
Why are surface characterizations<br />
important<br />
The surface material of a body is generally a<br />
mixture of all near-surface geologic units<br />
– In “disrupted-and-reaccreted” bodies, it samples<br />
all internal geologic units.<br />
Surface composition (Chemistry)<br />
– Element abundances<br />
– Element ratios<br />
– Isotopes<br />
Surface Mineralogy<br />
– Mineral types<br />
– Mineral Abundances and Compositions
Why Mineralogy rather than<br />
Composition<br />
Compositional determinations such as<br />
γ-ray spectroscopy can only be made<br />
from a spacecraft near an asteroid.<br />
Facies Concept<br />
– Different conditions (e.g., pressure,<br />
temperature, etc.) will produce different<br />
minerals from the same bulk composition.<br />
– Identification of the minerals constrains:<br />
Formation conditions<br />
Chemical composition
Al 2 SiO 5 Minerals
Mineralogical Characterizations<br />
Mineralogy can:<br />
– Generally distinguish between different<br />
meteorite types and can often identify<br />
specific meteorite types<br />
Chondritic subtypes<br />
Achondrite types<br />
“Metal-rich” assemblages<br />
– Provide insight into the chemical and thermal<br />
history of the parent body (e.g., oxidation,<br />
hydration, melting, differentiation, etc.)
<strong>Spectroscopy</strong><br />
When many materials<br />
interact with light<br />
(electromagnetic radiation)<br />
they impose a characteristic<br />
signature on that light.<br />
The most obvious<br />
manifestation is color.<br />
<strong>Spectroscopy</strong> provides a<br />
means of quantitatively<br />
assessing the nature of the<br />
material which interacted<br />
with the light.
VNIR Spectra<br />
Detection and compositions of transition<br />
metal-bearing minerals<br />
Detection and identification of minerals<br />
which incorporate molecular species such as<br />
H 2 O, OH, CO 2 , C-H, etc.<br />
Relative abundance of mineral species<br />
Some petrographic information (particle size,<br />
mixture state, etc.)
What are Transition Metals<br />
Periodic Table of<br />
the Elements
Transition metal elements commonly have<br />
multiple valence states:<br />
Example – Iron ⇒ Fe 2+ or Fe 3+
Electronic Structure of Atoms<br />
Electron Orbitals<br />
– Electrons in an atom are distributed into<br />
electronic shells (or levels)<br />
– Each shell contains one or more sets of orbitals
Shell #3<br />
Shell #2<br />
Shell #1<br />
Nucleus<br />
Electronic Structure of Atoms<br />
1<br />
s<br />
3<br />
s 3 p 3 d<br />
2<br />
s 2 p<br />
Electronic Shells<br />
– Shell #1<br />
s-orbital: 1 s<br />
– Shell #2<br />
s-orbital: 2 s<br />
p-orbital: 2 p<br />
– Shell #3<br />
s-orbital: 3 s<br />
p-orbital: 3 p<br />
d-orbital: 3 d<br />
– Shell #4<br />
s-orbital: 4 s<br />
p-orbital: 4 p<br />
d-orbital: 4 d<br />
f-orbital: 4 f
Spectra of Transition Metal-<br />
Bearing Minerals<br />
“Crystal Field Theory”<br />
Transition metals (Fe, Ni, Co, etc.) are<br />
characterized by an unfilled outer electron<br />
shell.<br />
– 3 d-shell for 1 st series transition metals<br />
A d-shell contains 5 electron orbitals
First Series Transition metals<br />
Periodic Table of<br />
the Elements
d-shell Electron Orbitals<br />
Each orbital can accept two<br />
(2) electrons<br />
Two of the orbitals lie along<br />
the Cartesian axes<br />
Three of the orbitals lie<br />
between the axes:<br />
In a uniform electrical field,<br />
all of these orbitals have<br />
equal energy, and cannot be<br />
distinguished (degenerate).
In minerals, the metal cations (e.g., Fe 2+ ) are<br />
often surrounded by oxygen anions (O 2- )<br />
A common structure<br />
is 6 oxygen ions<br />
surrounding 1 metal<br />
ion (octahedral<br />
coordination)<br />
⇒ olivine, pyroxene<br />
In such a site, the “on-axis” d X<br />
2 -Y<br />
2 and d Z<br />
2 are closer to<br />
the oxygen anions than the three “between the axes”<br />
orbitals (d xy , d xz , d yz ).
Crystal Field Splitting<br />
This configuration produces greater repulsion<br />
for the electrons in the two “on axis” orbitals<br />
than the electrons in the three “off axis”<br />
orbitals.<br />
The result is that the<br />
“on axis” orbitals are<br />
“split” to higher<br />
energy<br />
and the<br />
“off axis” orbitals are<br />
“split” to lower<br />
energy.<br />
dx 2 -y 2<br />
dz 2<br />
d xy d yz d xz
Consider Fe 2+ in an octahedral site<br />
⇒Three lower energy orbitals (groundstate)<br />
⇒Two higher energy orbitals<br />
Fe 2+ ⇒ six d-electrons<br />
Electrons have a spin orientation (spin up, spin<br />
down)<br />
Pauli Exclusion Principle<br />
Only two electrons (with opposite spins) can<br />
occupy any individual orbital<br />
First five electrons each occupy one of the five<br />
d-orbitals
But Fe 2+ has six d-electrons!<br />
The 6 th electron can occupy any of<br />
the orbitals<br />
Electrons normally reside in the<br />
lowest possible energy level<br />
Because of their lower energy, the 6 th<br />
electron normally occupies one of<br />
the ground-state orbitals.
∆ O is the energy difference between the<br />
upper (excited) state and the groundstate<br />
A photon of energy (hν) equal to ∆ O can<br />
be absorbed and the 6 th (spin down)<br />
electron kicked up to the excited state.<br />
∆ O<br />
hν<br />
⇒
Absorption of these photons produces a<br />
feature in the spectrum of the interacting<br />
light at the wavelength corresponding<br />
to the energy ∆ O<br />
0.3<br />
1 micron region of pyroxene spectrum<br />
Reflectance<br />
0.2<br />
0.1<br />
∆ O<br />
0<br />
0.3 0.5 0.7 0.9 1.1 1.3<br />
Wavelength (um)<br />
Absorption feature is characterized by:<br />
central wavelength, width and depth
Most cation sites in transition metalbearing<br />
minerals are not perfectly<br />
symmetric<br />
Distortions of an Octahedral Site
Such Distortions Remove the<br />
Degeneracy from the Energy Levels<br />
Each electron transition<br />
from the groundstate to an<br />
excited state produces a<br />
separate feature in the<br />
spectrum.<br />
The wavelength of the<br />
resulting absorption band is<br />
at the photon energy<br />
corresponding to the<br />
difference between the<br />
energy levels.
The result is multiple absorption features<br />
in many mineral spectra<br />
0.3<br />
Reflectance<br />
0.2<br />
0.1<br />
0<br />
Pyroxene<br />
0.3 0.8 1.3 1.8 2.3<br />
Wavelength (um)
Band positions in pyroxene spectra are<br />
correlated and restricted<br />
Pyroxene Band-Band Plot<br />
(after Adams 1974)<br />
Band I Center Wavelength<br />
1.08<br />
1.06<br />
1.04<br />
1.02<br />
1.00<br />
0.98<br />
0.96<br />
0.94<br />
0.92<br />
0.90<br />
0.88<br />
Opx<br />
Cpx<br />
1.7 1.8 1.9 2.0 2.1 2.2 2.3 2.4<br />
Band II Center Wavelength
Spectra of different HED meteorite<br />
types<br />
0.4<br />
Eucrite<br />
High Fe & Ca Pyroxene<br />
0.3<br />
Reflectance<br />
0.2<br />
0.1<br />
0<br />
Diogenite<br />
Low Fe & Ca Pyroxene<br />
1.885 µm<br />
0.3 0.8 1.3 1.8 2.3<br />
Wavelength (um)<br />
Note the shift in the pyroxene band centers!
Pyroxenes:<br />
Band Position vs. Composition<br />
2.2<br />
2.1<br />
Wo < 11<br />
Wavelength (Microns)<br />
2.0<br />
1.9<br />
1.8<br />
0 20 40 60 80 100<br />
Molar Iron Content (Fs)
The broad 1 µm olivine feature is composed of<br />
three overlapping absorptions at ~0.75, 1.04 &<br />
1.35 µm<br />
1<br />
0.8<br />
Reflectance<br />
0.6<br />
0.4<br />
0.2<br />
0<br />
0.3 0.8 1.3 1.8 2.3<br />
Wavelength (um)
Olivine vs Pyroxene<br />
0.6<br />
0.5<br />
Reflectance<br />
0.4<br />
0.3<br />
0.2<br />
0.1<br />
0<br />
0.3 0.8 1.3 1.8 2.3<br />
Wavelength (um)
Olivine-Pyroxene Mixture Spectra<br />
With increasing olivine content, the area of Band I<br />
increases while the area of Band II decreases.
Band Area Ratio (BAR)<br />
Spectral Reflectance<br />
0,7<br />
0,6<br />
0,5<br />
0,4<br />
BI<br />
BII<br />
0,3<br />
0,2<br />
0,5 1 1,5 2 2,5<br />
Wavelength (um)<br />
We use linear continua to calculate the<br />
areas of the bands.
In Olivine-Pyroxene mixtures, the ratio of the<br />
areas of the 1 and 2 µm bands is proportional to<br />
the relative abundance of the mineral species.<br />
2.50<br />
2.00<br />
BAR @ MSI(0.76) & NIS Wavelengths<br />
BAR(Nom) 63-90<br />
BAR(Act) 63-90<br />
Band Area Ratio<br />
1.50<br />
1.00<br />
0.50<br />
0.00<br />
0 25 50 75 100<br />
% Pyroxene<br />
Cloutis et al. (1986)
Diagnostic Parameters<br />
The position of the absorption features is a<br />
function of crystal structure.<br />
The intensity of the features is related to the<br />
abundance of the absorbing species (e.g., Fe 2+ )<br />
in the mineral<br />
and in mixtures to the relative abundance of the<br />
different minerals.<br />
A mineral is defined by its structure and its<br />
composition.<br />
The positions and intensities of the absorption<br />
features in a spectrum are uniquely related to<br />
specific minerals.
Molecular Vibrations Also Produce<br />
Spectral Features<br />
S.J. Gaffey (1988)<br />
10.5 × 10 13 Hz =<br />
= 9.8 × 10 13 Hz<br />
Overtones occur at sums or multiples of<br />
the fundamental vibration frequencies.
Clay Mineral Spectra<br />
S. J. Gaffey et al. (1993)<br />
The narrow absorption features<br />
near 1.4, 1.9, 2.2-2.3, 2.5 µm (etc.)<br />
are produced by vibrational<br />
overtones of the H 2 O and OH<br />
molecules.<br />
Their shape and exact position<br />
depends on the crystal structure<br />
and the attached cations.<br />
These spectra parameters are<br />
diagnostic of specific minerals.
Some potentially important asteroid<br />
minerals do not exhibit characteristic<br />
absorption features.<br />
0.8<br />
0.6<br />
Spectra of Iron metal and NiFe<br />
Meteorites<br />
Reflectance<br />
0.4<br />
0.2<br />
Iron Metal<br />
Butler<br />
Casey County<br />
0.0<br />
0.5 1.0 1.5 2.0 2.5<br />
Wavelength (um)<br />
General “reddish” slope but no absorption features
Analysis of <strong>Asteroid</strong> Spectra<br />
Absorption features identify the<br />
presence of specific transition metal or<br />
H 2 O (etc.) bearing minerals.<br />
The compositions of the mineral species<br />
are derived from the wavelengths of the<br />
band centers.<br />
The relative abundance of the mineral<br />
species are derived from the relative<br />
intensities of the absorption features.
Mineralogical Analysis of Vesta<br />
Gaffey (1997)<br />
Spectral parameters indicate abundant pyroxene. The<br />
mineral chemistry indicates an HED surface assemblage
Limitations of Reflectance <strong>Spectroscopy</strong><br />
<strong>Spectroscopy</strong> is unable to detect minerals<br />
which lack diagnostic VNIR features (e.g.<br />
quartz).<br />
<strong>Spectroscopy</strong> has limited capabilities for<br />
weakly featured minerals or for minerals<br />
whose features are obscured by interfering<br />
species.<br />
<strong>Spectroscopy</strong> only samples a thin surface<br />
layer (optical surface).<br />
– Surface alteration processes (space weathering –<br />
lecture 13) can modify the spectrum, potentially<br />
leading to inaccurate interpretations<br />
– Is a thin (< few hundred microns) surface layer<br />
representative of an asteroidal body
Is a Thin Surface Layer Representative<br />
Concept of a “split”<br />
– Grind up a rock, homogenize the bulk sample, and<br />
take a small sample for analysis.<br />
<strong>Asteroid</strong> surfaces layers as “splits”<br />
– Surface area of 100 km diameter spherical<br />
asteroid = 31,415 km 2 = 3.14 x 10 10 m 2<br />
– Volume of 100 µm (10 -4 m) surface layer<br />
= area x thickness = 3.14 x 10 10 m 2 x 10 -4 m<br />
= 3.14 x 10 6 m 3 ~ 3 million metric tons<br />
Thin asteroid surface layers sample very<br />
large masses of material!
Current State-of-the-Art<br />
1459 Magnya H 2 O<br />
V mag = 15.7<br />
H 2 O<br />
Hardersen et al. (2004)<br />
Unsmoothed, unedited average spectrum.<br />
This should be the current expectation for NIR<br />
asteroid spectra.
Observational Methodologies<br />
Standard star (S) observations<br />
interspersed with asteroid (A)<br />
observations.<br />
5S 10A 5S 10A 5S 10A 5S<br />
Allows extinction coefficients<br />
to be calculated (slopes).<br />
Slope & intercept allows flux of<br />
star to be calculated at each<br />
channel at the same airmass<br />
as each asteroid observation.<br />
Dividing the raw asteroid flux<br />
curve by the calculated star<br />
flux curve removes the<br />
atmospheric absorptions.<br />
A slope-intercept pair<br />
for each channel
Effects of orographic winds<br />
Upwind / downwind asymmetry in<br />
atmospheric absorption
Typical instrumental flux measurement<br />
SpeX Instrument @ IRTF in “<strong>Asteroid</strong>” Mode
Ratio of two raw flux curves
Correction for extinction using a<br />
SPECPR Starpack<br />
Extinction coefficients were calculated from standard<br />
star observations without correction for channel<br />
offsets
Pattern for 1 channel Offset on SpeX<br />
Smoothing does not remove this pattern<br />
13 Pt Smooth<br />
~0.05 µm Interval<br />
25 Pt Smooth<br />
~0.10 µm Interval<br />
37 Pt Smooth<br />
~0.15 µm Interval<br />
51 Pt Smooth - Edited<br />
~0.15 µm Interval
Extinction correction with channel<br />
offsets<br />
Most of the “noise” in the 1.4 & 1.9 µm regions was<br />
not random, but due to uncorrected channel offsets
Effects of Uncorrected 0.5 Channel Offset<br />
+0.5 Chan.<br />
No Shift<br />
-0.5 Chan.<br />
A small offset produces major deviations in Band II
Implications for Analysis<br />
Irrespective of the analysis technique<br />
Curve matching<br />
Gaussian fitting<br />
Parameter extraction<br />
Interpretations would differ for these spectra.
Correction Process - I<br />
The pattern identifies presence of an offset.<br />
Channel offset determined for each set of<br />
observations relative to some reference set.<br />
Offsets are derived by using the steep edge<br />
of the 1.4 µm atmospheric water vapor<br />
feature.
Correction Process - II<br />
Offsets should be established to ~0.1-0.2<br />
pixels.<br />
Pixel offset corrections are applied to the raw<br />
standard star spectra prior to calculation of<br />
the extinction coefficients (or their use in<br />
ratios).<br />
Pixel offset corrections are applied to the raw<br />
object spectra prior to extinction corrections.
Conclusions<br />
All medium resolution NIR asteroid spectral<br />
data should be corrected for channel offsets<br />
as the initial reduction step.<br />
– Preferably the offsets should be determined from<br />
the data itself.<br />
Extinction should use “objective” criteria.<br />
– Standard extinction coefficients adjusted until the<br />
spectrum “looks right” should be avoided.<br />
Smoothing of spectra should be avoided<br />
unless the previous steps have been<br />
accomplished.
The Upside --<br />
<strong>Asteroid</strong> spectra obtained with medium<br />
resolution NIR spectrographs must be<br />
routinely checked and corrected for channel<br />
offsets.<br />
The parameters needed to make the offset<br />
correction are derivable from the raw data<br />
itself.<br />
Routines exist to make the corrections as a<br />
regular step in data reduction.