Additive vs ultrametric: triangle inequality Additive vs ultrametric ...
Additive vs ultrametric: triangle inequality Additive vs ultrametric ...
Additive vs ultrametric: triangle inequality Additive vs ultrametric ...

You also want an ePaper? Increase the reach of your titles
YUMPU automatically turns print PDFs into web optimized ePapers that Google loves.
Principal components analysis (PCA)<br />
• Eigenanalysis method, but based on correlation or covariance<br />
matrix:<br />
– Decomposes information in the correlation matrix into a set of<br />
orthogonal axes:<br />
• Axes = principal p components.<br />
• Orthogonal = statistically independent.<br />
– Principal components:<br />
• PC1 accounts for the maximum information in the distance matrix.<br />
• PC2 accounts for the maximum residual information in the distance<br />
matrix, independent of PC1.<br />
• PC3 accounts for the maximum residual information in the distance<br />
matrix, independent of both PC1 and PC2.<br />
• Etc.<br />
– For an N×N correlation matrix, there are N principal<br />
components.<br />
• The full set of N principal components accounts for all of the<br />
information in the distance matrix.<br />
– Observations (taxa) are projected onto the axes to give<br />
projection scores, which can be plotted with scattergrams.<br />
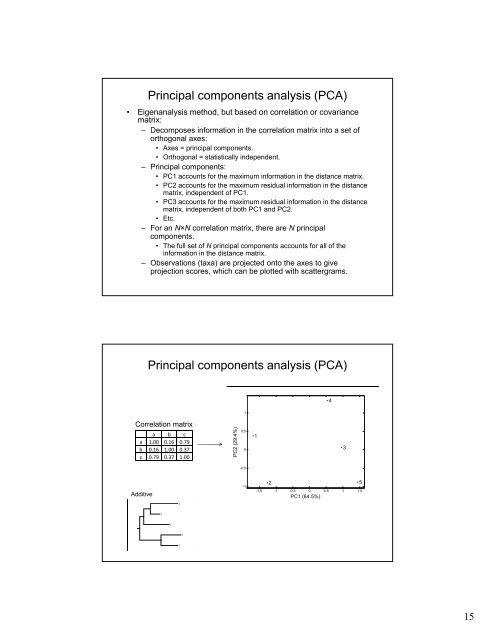
Principal components analysis (PCA)<br />
4<br />
1<br />
Correlation matrix<br />
a b c<br />
a 1.00 0.16 0.79<br />
b 0.16 1.00 0.37<br />
c 0.79 0.37 1.00<br />
PC2 (29.4%)<br />
0.5<br />
0<br />
1<br />
3<br />
-0.5<br />
<strong>Additive</strong><br />
-1<br />
2<br />
5<br />
-1.5 -1 -0.5 0 0.5 1 1.5<br />
PC1 (64.5%)<br />
4<br />
3<br />
5<br />
2<br />
1<br />
15