Lab Report Format Handouts - Occidental College
Lab Report Format Handouts - Occidental College
Lab Report Format Handouts - Occidental College
Create successful ePaper yourself
Turn your PDF publications into a flip-book with our unique Google optimized e-Paper software.
<strong>Occidental</strong> <strong>College</strong><br />
Physics Department<br />
Advanced <strong>Lab</strong> I/II<br />
<strong>Lab</strong> <strong>Report</strong> <strong>Format</strong><br />
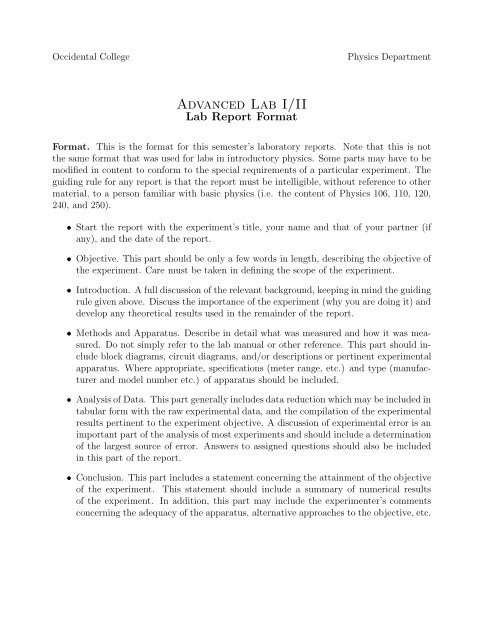
<strong>Format</strong>. This is the format for this semester’s laboratory reports. Note that this is not<br />
the same format that was used for labs in introductory physics. Some parts may have to be<br />
modified in content to conform to the special requirements of a particular experiment. The<br />
guiding rule for any report is that the report must be intelligible, without reference to other<br />
material, to a person familiar with basic physics (i.e. the content of Physics 106, 110, 120,<br />
240, and 250).<br />
• Start the report with the experiment’s title, your name and that of your partner (if<br />
any), and the date of the report.<br />
• Objective. This part should be only a few words in length, describing the objective of<br />
the experiment. Care must be taken in defining the scope of the experiment.<br />
• Introduction. A full discussion of the relevant background, keeping in mind the guiding<br />
rule given above. Discuss the importance of the experiment (why you are doing it) and<br />
develop any theoretical results used in the remainder of the report.<br />
• Methods and Apparatus. Describe in detail what was measured and how it was measured.<br />
Do not simply refer to the lab manual or other reference. This part should include<br />
block diagrams, circuit diagrams, and/or descriptions or pertinent experimental<br />
apparatus. Where appropriate, specifications (meter range, etc.) and type (manufacturer<br />
and model number etc.) of apparatus should be included.<br />
• Analysis of Data. This part generally includes data reduction which may be included in<br />
tabular form with the raw experimental data, and the compilation of the experimental<br />
results pertinent to the experiment objective. A discussion of experimental error is an<br />
important part of the analysis of most experiments and should include a determination<br />
of the largest source of error. Answers to assigned questions should also be included<br />
in this part of the report.<br />
• Conclusion. This part includes a statement concerning the attainment of the objective<br />
of the experiment. This statement should include a summary of numerical results<br />
of the experiment. In addition, this part may include the experimenter’s comments<br />
concerning the adequacy of the apparatus, alternative approaches to the objective, etc.
Some Common Problems/Mistakes in Advanced <strong>Lab</strong> <strong>Report</strong>s<br />
• Plagiarism. It is not OK to copy parts of another document into your report. Figures<br />
and quotes taken from the literature must be referenced appropriately. See the student<br />
handbook under ”Academic Policies” for more detail. It is also not OK to quote or<br />
paraphrase large portions of other documents (e.g. the lab manual) even if properly<br />
referenced. Referenced quotes should support your writing, not substitute for it.<br />
• Poor writing. It is important that you be able to communicate your knowledge to<br />
others in written form. Correct spelling and sentence structure are important in any<br />
scientific report. The report should flow like a story, with details included as they are<br />
relevant. The conclusion is a brief summary of results, not a collection of last minute<br />
thoughts or details you forgot to put in earlier. Proofread your report before handing<br />
it in. Obvious mistakes and omissions reflect badly on the author.<br />
• Significant figures and error analysis. Take care to present the correct number of significant<br />
figures in your answer. Do a complete job with the error analysis. Simplifications<br />
(e.g. ignoring some of the uncertainties) are OK if you carefully justify them. “It<br />
makes my life easier” is not an appropriate justification.<br />
• Examine the entire lab description for items to be included in your report. They are<br />
not all listed in the “Procedure” portion of the lab manual.<br />
• The basic rule is that the report must be intelligible, without reference to other material,<br />
to a person familiar with basic physics. You must include enough background<br />
material to inform such a person of the necessary details.<br />
• Include your raw experimental data in your report. Give a sample calculation showing<br />
how you analyzed the raw data as well as how you obtained your uncertainty.<br />
• When comparing your experimental result to a known value, do not discuss the discrepany<br />
in terms of percentage error. Rather, discuss any discrepancy in comparison<br />
to the relevant uncertainties.
<strong>Occidental</strong> <strong>College</strong><br />
Physics Department<br />
Some Rules for <strong>Lab</strong> <strong>Report</strong>ing<br />
1. Numbers less than one should include leading zeros (e.g., 0.235, not .235)<br />
2. When an end result is an experimentally obtained value, the value should always be given<br />
along with its uncertainty. For example, h/e = (4.212 ± 0.071) × 10 −15 J · s/C.<br />
3. When using scientific notation to state a result and its uncertainty, use the same factor of ten<br />
for both. For example, (1.50 ± 0.02) × 10 −3 rather than 1.50 × 10 −3 ± 2 × 10 −5 .<br />
4. The final reported uncertainty should never have more than two significant figures<br />
5. The experimentally obtained value and the uncertainty should have consistent number of<br />
digits. When using a common scientific notation to state a result and its uncertainty, this<br />
means that the number of digits to the right of the decimal point will be the same. See the<br />
above examples.<br />
6. If you find an experimental value for a quantity that has a well-known value, you should always<br />
compare your result with the well-known value. Further, this comparison should always be<br />
in terms of your uncertainty value(s) and be followed by a simple statement about the level<br />
of agreement. For example, “The absolute difference between our experimental value and the<br />
accepted value is less than the experimental uncertainty. The agreement is therefore good”<br />
rather than “The experimental value and the accepted value differ by three percent, which is<br />
close.”<br />
7. In most cases, the scales on a graph should be adjusted so that the data fills the graph. There<br />
is no rule that the origin must always be displayed.<br />
8. The axis labels should include the quantity being plotted and its units. Be specific on the<br />
names. For example, use “Stopping Potential, V s (V)”, not “voltage”.<br />
9. The numerical labels for the tic marks on the graph axes should have no more significant<br />
figures than is necessary to properly distinguish the labels. Also, the labels should all have<br />
the same number of significant figures. For example, use 0.5, 1.0, 1.5, 2.0 rather than 0.5, 1,<br />
1.50, 2.<br />
10. Common multiplicative factors should be removed from the tic mark labels and included in<br />
the units for that axis. For example, use tic mark labels 1,2,3 and make the units 10 14 Hz or<br />
use tic mark labels 100,200,300 and make the units THz rather than use use tic mark labels<br />
1 E14, 2 E14, 3 E14.<br />
11. Each column of a table should have a unique label and, when appropriate, the units for<br />
the quantity should be given. If you use a symbol for a column label, make sure that it is<br />
explained somewhere in the report and that the symbol is consistent with usage in the rest<br />
of the report. For example, if you used f for frequency in a displayed equation, then your<br />
column heading for frequency should be f(Hz), not F or ν. Numerical data and column labels<br />
should be aligned vertically. The same sig fig rules given above apply to tables.<br />
Rev. 1/2013 DLE
<strong>Occidental</strong> <strong>College</strong><br />
Advanced <strong>Lab</strong><br />
Physics Department<br />
<strong>Lab</strong><br />
Forms for References<br />
The following are standard forms for references in the journals of the American Institute of Physics,<br />
followed by examples of proper usage. Standard abbreviations for journal names and additional<br />
details and examples may be found in the AIP Style Manual, (American Institute of Physics,<br />
Melville, N.Y, 1990) which is also available at http://www.aip.org/pubservs/style/4thed/toc.html.<br />
Where there is variation amongst the journals we have followed the format of the American Journal<br />
of Physics. Note the need for page numbers in book references.<br />
Book: author(s), title, (publisher, place, date), page(s) referenced.<br />
John David Jackson, Classical Electrodynamics, 2nd Edition, (Wiley, New York, 1975), pp. 582-584.<br />
David J. Griffiths, Introduction to Electrodynamics, 3rd Edition, (Prentice Hall, New Jersey, 1999),<br />
pp. 369-370.<br />
Journal article: author(s), title, journal, volume, pages, (year).<br />
J. H. Malmberg and C. F. Driscoll, “Long-Time Containment of a Pure Electron Plasma,” Phys.<br />
Rev. Lett. 44, 654-657 (1980).<br />
J. Notte and J. Fajans, “The effect of asymmetries on non-neutral plasma confinement time,” Phys.<br />
Plasmas 1, 1123 (1994).<br />
Paper in edited volume: author(s), paper title, volume title, editor(s), (publisher, place, date),<br />
page(s) referenced.<br />
Roy W. Gould, “Wave Angular Momentum in Nonneutral Plasmas,” in Non-Neutral Plasmas III,<br />
edited by John J. Bollinger, Ross L. Spencer, and Ronald C. Davidson, (American Institute of<br />
Physics, Melville, N.Y, 1999), p. 170.<br />
Websites (MLA format): Author’s Last Name, First Name (if available). “Title of Page/Document”.<br />
Title of the Web Site. Sponsoring Organization, Publication/Updated Date. Medium of Publication.<br />
Date of Access. < URL >.<br />
Bromwich, Michael R. “Criminal Calls: A Review of the Bureau of Prisons’ Management of Inmate<br />
Telephone Privileges.” United States Department of Justice, Aug. 1999. Web. 10 Jan. 2004.<br />
< http : //www.usdoj.gov/oig/special/9908/exec.htm >.<br />
“Argonne Researchers Create Powerful Stem Cells From Blood.” Argonne National <strong>Lab</strong>oratory, 24<br />
Feb. 2003. Web. 10 Jan. 2004. < http : //www.anl.gov/Media Center/News/2003/news030224.htm >.<br />
Rev. 1/2013 DLE
<strong>Occidental</strong> <strong>College</strong><br />
Advanced <strong>Lab</strong><br />
Physics Department<br />
<strong>Lab</strong><br />
Weighted Least Squares Linear Fit<br />
From the introductory physics labs you are familiar with the process of obtaining a least squares<br />
linear fit to a set of data. In this process you find, for a set of data pairs (x i , y i ), the best fit straight<br />
line y = mx+b. The procedure gives the slope of the line m and the y-intercept b. It also gives the<br />
uncertainty in these quantities: σ m and σ b . This can be done by using the standard equations for<br />
least squares linear fit 1 or, in Excel, by using the Regression tool under the Tools/Data Analysis<br />
tab or by using the function LINEST.<br />
The basic least squares fit procedure, however, assumes that the uncertainty in your data is<br />
the same for each data point. In experiments it is not unusual for the uncertainty to vary from<br />
point to point, so we need a method to include this variation in our analysis. The basic idea is<br />
that data points with small uncertainties should be weighted more heavily than those with large<br />
uncertainties when determining the linear fit. The results below show how this is done.<br />
We assume N data pairs (x i , y i ) with i running from 1 to N. Let each y i have an associated<br />
uncertainty σ i . We define a weight for the i th data point as W i = 1/σi 2 . This makes sense because<br />
a small uncertainty should have a heavier weight. Given this setup and using the same technique<br />
in Ref. 1 of maximizing the probability, we obtain<br />
b = (∑ W i x 2 i )(∑ W i y i ) − ( ∑ W i x i )( ∑ W i x i y i )<br />
( ∑ W i )( ∑ W i x 2 i ) − (∑ W i x i ) 2 (1)<br />
m = (∑ W i )( ∑ W i x i y i ) − ( ∑ W i x i )( ∑ W i y i )<br />
( ∑ W i )( ∑ W i x 2 i ) − (∑ W i x i ) 2 (2)<br />
σ 2 b =<br />
∑ Wi x 2 i<br />
( ∑ W i )( ∑ W i x 2 i ) − (∑ W i x i ) 2 (3)<br />
σ 2 m =<br />
where the sum in these expressions runs from i = 1 to N.<br />
∑ Wi<br />
( ∑ W i )( ∑ W i x 2 i ) − (∑ W i x i ) 2 (4)<br />
Rev. 1/2013 DLE<br />
1 John R. Taylor, An Introduction to Error Analysis, 2nd ed. (University Science Books, CA, 1997), pp. 182–190.


