November 2010 - Nordea Bank Lietuva
November 2010 - Nordea Bank Lietuva
November 2010 - Nordea Bank Lietuva

Create successful ePaper yourself
Turn your PDF publications into a flip-book with our unique Google optimized e-Paper software.
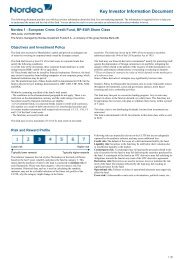
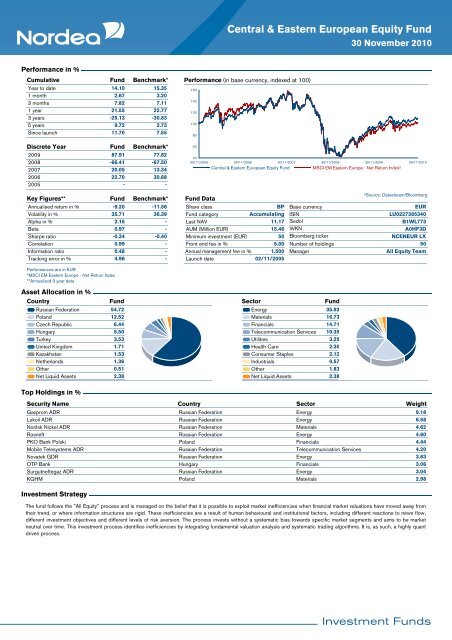
Central & Eastern European Equity Fund<br />
30 <strong>November</strong> <strong>2010</strong><br />
Performance in %<br />
Cumulative Fund Benchmark*<br />
Year to date<br />
14.10<br />
15.35<br />
1 month<br />
2.67<br />
3.20<br />
3 months<br />
7.82<br />
7.11<br />
1 year<br />
21.55<br />
22.77<br />
3 years<br />
-25.13<br />
-30.83<br />
5 years<br />
9.72<br />
2.73<br />
Since launch<br />
11.70<br />
7.55<br />
Performance (in base currency, indexed at 100)<br />
160<br />
140<br />
120<br />
100<br />
80<br />
Discrete Year<br />
2009<br />
2008<br />
2007<br />
2006<br />
2005<br />
Fund<br />
87.91<br />
-66.41<br />
20.05<br />
22.70<br />
-<br />
Benchmark*<br />
77.82<br />
-67.50<br />
13.34<br />
30.88<br />
-<br />
60<br />
40<br />
30/11/2005 30/11/2006 30/11/2007 30/11/2008 30/11/2009 30/11/<strong>2010</strong><br />
Central & Eastern European Equity Fund<br />
MSCI EM Eastern Europe - Net Return Index²<br />
Key Figures**<br />
Annualised return in %<br />
Volatility in %<br />
Alpha in %<br />
Beta<br />
Sharpe ratio<br />
Correlation<br />
Information ratio<br />
Tracking error in %<br />
Fund<br />
-9.20<br />
35.71<br />
2.15<br />
0.97<br />
-0.34<br />
0.99<br />
0.48<br />
4.96<br />
Benchmark*<br />
-11.56<br />
36.39<br />
-<br />
-<br />
-0.40<br />
Fund Data<br />
Share class<br />
Fund category<br />
Last NAV<br />
AUM (Million EUR)<br />
Minimum investment (EUR)<br />
- Front end fee in %<br />
- Annual management fee in %<br />
- Launch date<br />
BP<br />
Accumulating<br />
11.17<br />
15.46<br />
50<br />
5.00<br />
1.500<br />
02/11/2005<br />
Base currency<br />
ISIN<br />
Sedol<br />
WKN<br />
Bloomberg ticker<br />
Number of holdings<br />
Manager<br />
²Source: Datastream/Bloomberg<br />
EUR<br />
LU0227385340<br />
B1WL773<br />
A0HF3D<br />
NCENEUR LX<br />
50<br />
All Equity Team<br />
Performances are in EUR<br />
*MSCI EM Eastern Europe - Net Return Index<br />
**Annualized 3 year data<br />
Asset Allocation in %<br />
Country<br />
Fund<br />
Russian Federation 54.72<br />
Poland 12.52<br />
Czech Republic 6.44<br />
Hungary 5.50<br />
Turkey 3.53<br />
United Kingdom 1.71<br />
Kazakhstan 1.53<br />
Netherlands 1.36<br />
Other 0.51<br />
Net Liquid Assets 2.38<br />
Sector<br />
Fund<br />
Energy 35.92<br />
Materials 16.73<br />
Financials 14.71<br />
Telecommunication Services 10.35<br />
Utilities 3.29<br />
Health Care 2.30<br />
Consumer Staples 2.12<br />
Industrials 0.57<br />
Other 1.83<br />
Net Liquid Assets 2.38<br />
Top Holdings in %<br />
Security Name<br />
Country<br />
Sector<br />
Weight<br />
Gazprom ADR Russian Federation<br />
Energy<br />
9.18<br />
Lukoil ADR Russian Federation<br />
Energy<br />
6.58<br />
Norilsk Nickel ADR Russian Federation<br />
Materials<br />
4.62<br />
Rosneft Russian Federation<br />
Energy<br />
4.60<br />
PKO <strong>Bank</strong> Polski Poland<br />
Financials<br />
4.44<br />
Mobile Telesystems ADR Russian Federation<br />
Telecommunication Services<br />
4.20<br />
Novatek GDR Russian Federation<br />
Energy<br />
3.63<br />
OTP <strong>Bank</strong> Hungary<br />
Financials<br />
3.06<br />
Surgutneftegaz ADR Russian Federation<br />
Energy<br />
3.04<br />
KGHM Poland<br />
Materials<br />
2.98<br />
Investment Strategy<br />
The fund follows the "All Equity" process and is managed on the belief that it is possible to exploit market inefficiencies when financial market valuations have moved away from<br />
their trend, or where information structures are rigid. These inefficiencies are a result of human behavioural and institutional factors, including different reactions to news flow,<br />
different investment objectives and different levels of risk aversion. The process invests without a systematic bias towards specific market segments and aims to be market<br />
neutral over time. This investment process identifies inefficiencies by integrating fundamental valuation analysis and systematic trading algorithms. It is, as such, a highly quant<br />
driven process.