November 2010 - Nordea Bank Lietuva
November 2010 - Nordea Bank Lietuva
November 2010 - Nordea Bank Lietuva

Create successful ePaper yourself
Turn your PDF publications into a flip-book with our unique Google optimized e-Paper software.
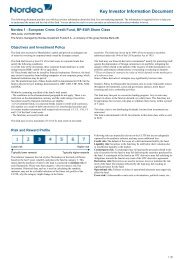
Norwegian Equity Fund<br />
30 <strong>November</strong> <strong>2010</strong><br />
Performance in %<br />
Cumulative Fund Benchmark*<br />
Year to date<br />
8.03<br />
9.66<br />
1 month<br />
-0.41<br />
-1.60<br />
3 months<br />
16.59<br />
15.05<br />
1 year<br />
15.77<br />
17.13<br />
3 years<br />
-19.42<br />
-20.27<br />
5 years<br />
8.52<br />
23.74<br />
Since launch<br />
29.98 120.53<br />
Discrete Year<br />
2009<br />
2008<br />
2007<br />
2006<br />
2005<br />
Fund<br />
75.68<br />
-57.85<br />
-1.10<br />
26.71<br />
44.28<br />
Benchmark*<br />
70.11<br />
-57.42<br />
10.21<br />
32.98<br />
39.77<br />
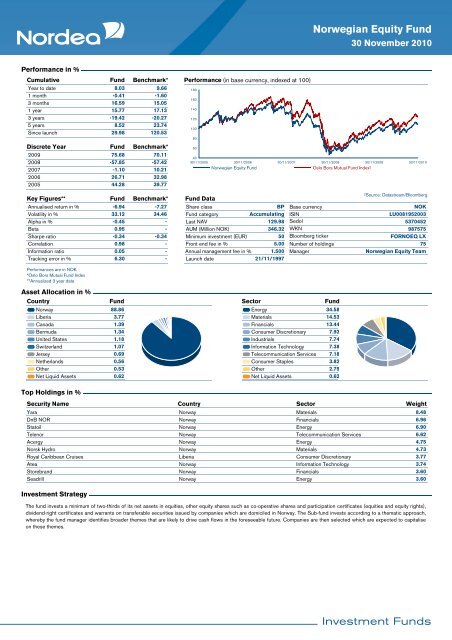
Performance (in base currency, indexed at 100)<br />
180<br />
160<br />
140<br />
120<br />
100<br />
80<br />
60<br />
40<br />
30/11/2005 30/11/2006 30/11/2007 30/11/2008 30/11/2009 30/11/<strong>2010</strong><br />
Norwegian Equity Fund<br />
Oslo Bors Mutual Fund Index²<br />
Key Figures**<br />
Annualised return in %<br />
Volatility in %<br />
Alpha in %<br />
Beta<br />
Sharpe ratio<br />
Correlation<br />
Information ratio<br />
Tracking error in %<br />
Fund<br />
-6.94<br />
33.12<br />
-0.45<br />
0.95<br />
-0.34<br />
0.98<br />
0.05<br />
6.30<br />
Benchmark*<br />
-7.27<br />
34.46<br />
-<br />
-<br />
-0.34<br />
Fund Data<br />
Share class<br />
Fund category<br />
Last NAV<br />
AUM (Million NOK)<br />
Minimum investment (EUR)<br />
- Front end fee in %<br />
- Annual management fee in %<br />
- Launch date<br />
BP<br />
Accumulating<br />
129.98<br />
346.32<br />
50<br />
5.00<br />
1.500<br />
21/11/1997<br />
Base currency<br />
ISIN<br />
Sedol<br />
WKN<br />
Bloomberg ticker<br />
Number of holdings<br />
Manager<br />
²Source: Datastream/Bloomberg<br />
NOK<br />
LU0081952003<br />
5370452<br />
987575<br />
FORNOEQ LX<br />
75<br />
Norwegian Equity Team<br />
Performances are in NOK<br />
*Oslo Bors Mutual Fund Index<br />
**Annualized 3 year data<br />
Asset Allocation in %<br />
Country<br />
Fund<br />
Norway 88.86<br />
Liberia 3.77<br />
Canada 1.39<br />
Bermuda 1.34<br />
United States 1.18<br />
Switzerland 1.07<br />
Jersey 0.69<br />
Netherlands 0.56<br />
Other 0.53<br />
Net Liquid Assets 0.62<br />
Sector<br />
Fund<br />
Energy 34.58<br />
Materials 14.53<br />
Financials 13.44<br />
Consumer Discretionary 7.93<br />
Industrials 7.74<br />
Information Technology 7.38<br />
Telecommunication Services 7.18<br />
Consumer Staples 3.82<br />
Other 2.79<br />
Net Liquid Assets 0.62<br />
Top Holdings in %<br />
Security Name<br />
Country<br />
Sector<br />
Weight<br />
Yara Norway<br />
Materials<br />
8.48<br />
DnB NOR Norway<br />
Financials<br />
6.96<br />
Statoil Norway<br />
Energy<br />
6.90<br />
Telenor Norway<br />
Telecommunication Services<br />
6.62<br />
Acergy Norway<br />
Energy<br />
4.75<br />
Norsk Hydro Norway<br />
Materials<br />
4.73<br />
Royal Caribbean Cruises Liberia<br />
Consumer Discretionary<br />
3.77<br />
Atea Norway<br />
Information Technology<br />
3.74<br />
Storebrand Norway<br />
Financials<br />
3.60<br />
Seadrill Norway<br />
Energy<br />
3.60<br />
Investment Strategy<br />
The fund invests a minimum of two-thirds of its net assets in equities, other equity shares such as co-operative shares and participation certificates (equities and equity rights),<br />
dividend-right certificates and warrants on transferable securities issued by companies which are domiciled in Norway. The Sub-fund invests according to a thematic approach,<br />
whereby the fund manager identifies broader themes that are likely to drive cash flows in the foreseeable future. Companies are then selected which are expected to capitalise<br />
on these themes.