Refined soybean oil (RSO) fundamentals (in `000' tonnes ... - MCX
Refined soybean oil (RSO) fundamentals (in `000' tonnes ... - MCX
Refined soybean oil (RSO) fundamentals (in `000' tonnes ... - MCX

You also want an ePaper? Increase the reach of your titles
YUMPU automatically turns print PDFs into web optimized ePapers that Google loves.
EDITORIALS<br />
PROLOGUE<br />
EXPERTS' VIEWS<br />
INDIAN ECONOMY<br />
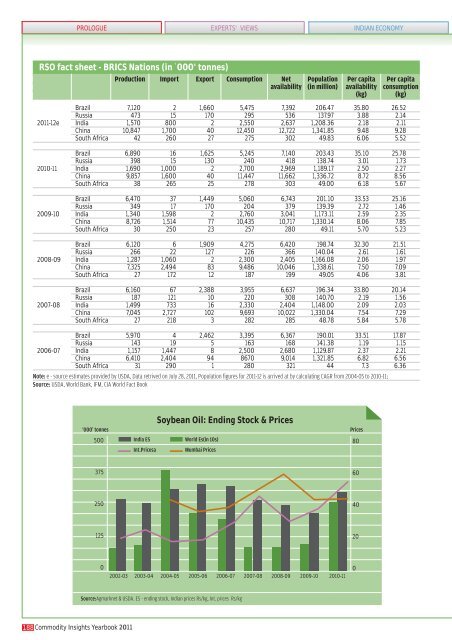
<strong>RSO</strong> fact sheet - BRICS Nations (<strong>in</strong> <strong>`000'</strong> <strong>tonnes</strong>)<br />
Production Import Export Consumption Net Population Per capita Per capita<br />
availability (<strong>in</strong> million) availability consumption<br />
(kg)<br />
(kg)<br />
Brazil 7,120 2 1,660 5,475 7,392 206.47 35.80 26.52<br />
Russia 473 15 170 295 536 137.97 3.88 2.14<br />
2011-12e India 1,570 800 2 2,550 2,637 1,208.36 2.18 2.11<br />
Ch<strong>in</strong>a 10,847 1,700 40 12,450 12,722 1,341.85 9.48 9.28<br />
South Africa 42 260 27 275 302 49.83 6.06 5.52<br />
Brazil 6,890 16 1,625 5,245 7,140 203.43 35.10 25.78<br />
Russia 398 15 130 240 418 138.74 3.01 1.73<br />
2010-11 India 1,690 1,000 2 2,700 2,969 1,189.17 2.50 2.27<br />
Ch<strong>in</strong>a 9,857 1,600 40 11,447 11,662 1,336.72 8.72 8.56<br />
South Africa 38 265 25 278 303 49.00 6.18 5.67<br />
Brazil 6,470 37 1,449 5,060 6,743 201.10 33.53 25.16<br />
Russia 349 17 170 204 379 139.39 2.72 1.46<br />
2009-10 India 1,340 1,598 2 2,760 3,041 1,173.11 2.59 2.35<br />
Ch<strong>in</strong>a 8,726 1,514 77 10,435 10,717 1,330.14 8.06 7.85<br />
South Africa 30 250 23 257 280 49.11 5.70 5.23<br />
Brazil 6,120 6 1,909 4,275 6,420 198.74 32.30 21.51<br />
Russia 266 22 127 226 366 140.04 2.61 1.61<br />
2008-09 India 1,287 1,060 2 2,300 2,405 1,166.08 2.06 1.97<br />
Ch<strong>in</strong>a 7,325 2,494 83 9,486 10,046 1,338.61 7.50 7.09<br />
South Africa 27 172 12 187 199 49.05 4.06 3.81<br />
Brazil 6,160 67 2,388 3,955 6,637 196.34 33.80 20.14<br />
Russia 187 121 10 220 308 140.70 2.19 1.56<br />
2007-08 India 1,499 733 16 2,330 2,404 1,148.00 2.09 2.03<br />
Ch<strong>in</strong>a 7,045 2,727 102 9,693 10,022 1,330.04 7.54 7.29<br />
South Africa 27 218 3 282 285 48.78 5.84 5.78<br />
Brazil 5,970 4 2,462 3,395 6,367 190.01 33.51 17.87<br />
Russia 143 19 5 163 168 141.38 1.19 1.15<br />
2006-07 India 1,157 1,447 8 2,500 2,680 1,129.87 2.37 2.21<br />
Ch<strong>in</strong>a 6,410 2,404 94 8670 9,014 1,321.85 6.82 6.56<br />
South Africa 31 290 1 280 321 44 7.3 6.36<br />
Note: e - source estimates provided by USDA, Data retrived on July 28, 2011, Population figures for 2011-12 is arrived at by calculat<strong>in</strong>g CAGR from 2004-05 to 2010-11;<br />
Source: USDA, World Bank, IFM, CIA World Fact Book<br />
Soybean Oil: End<strong>in</strong>g Stock & Prices<br />
‘000’ <strong>tonnes</strong> Prices<br />
500<br />
India ES World Es(<strong>in</strong> 10s)<br />
80<br />
Int.Pricesa<br />
Mumbai Prices<br />
375<br />
60<br />
250<br />
40<br />
125<br />
20<br />
0<br />
2002-03<br />
2003-04<br />
2004-05<br />
2005-06<br />
2006-07 2007-08 2008-09 2009-10 2010-11<br />
0<br />
Source:Agmarknet & USDA. ES - end<strong>in</strong>g stock, Indian prices Rs/kg, Int. prices Rs/kg<br />
188 Commodity Insights Yearbook 2011