Refined soybean oil (RSO) fundamentals (in `000' tonnes ... - MCX
Refined soybean oil (RSO) fundamentals (in `000' tonnes ... - MCX
Refined soybean oil (RSO) fundamentals (in `000' tonnes ... - MCX

You also want an ePaper? Increase the reach of your titles
YUMPU automatically turns print PDFs into web optimized ePapers that Google loves.
EDITORIALS<br />
PROLOGUE<br />
EXPERTS' VIEWS<br />
INDIAN ECONOMY<br />
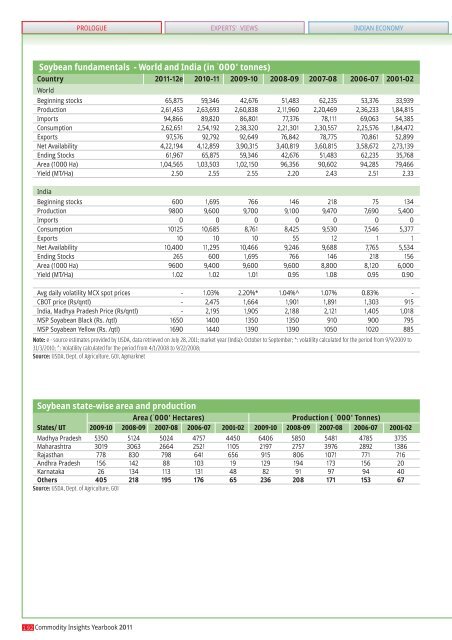
Soybean <strong>fundamentals</strong> - World and India (<strong>in</strong> <strong>`000'</strong> <strong>tonnes</strong>)<br />
Country 2011-12e 2010-11 2009-10 2008-09 2007-08 2006-07 2001-02<br />
World<br />
Beg<strong>in</strong>n<strong>in</strong>g stocks 65,875 59,346 42,676 51,483 62,235 53,376 33,939<br />
Production 2,61,453 2,63,693 2,60,838 2,11,960 2,20,469 2,36,233 1,84,815<br />
Imports 94,866 89,820 86,801 77,376 78,111 69,063 54,385<br />
Consumption 2,62,651 2,54,192 2,38,320 2,21,301 2,30,557 2,25,576 1,84,472<br />
Exports 97,576 92,792 92,649 76,842 78,775 70,861 52,899<br />
Net Availability 4,22,194 4,12,859 3,90,315 3,40,819 3,60,815 3,58,672 2,73,139<br />
End<strong>in</strong>g Stocks 61,967 65,875 59,346 42,676 51,483 62,235 35,768<br />
Area (1000 Ha) 1,04,565 1,03,503 1,02,150 96,356 90,602 94,285 79,466<br />
Yield (MT/Ha) 2.50 2.55 2.55 2.20 2.43 2.51 2.33<br />
India<br />
Beg<strong>in</strong>n<strong>in</strong>g stocks 600 1,695 766 146 218 75 134<br />
Production 9800 9,600 9,700 9,100 9,470 7,690 5,400<br />
Imports 0 0 0 0 0 0 0<br />
Consumption 10125 10,685 8,761 8,425 9,530 7,546 5,377<br />
Exports 10 10 10 55 12 1 1<br />
Net Availability 10,400 11,295 10,466 9,246 9,688 7,765 5,534<br />
End<strong>in</strong>g Stocks 265 600 1,695 766 146 218 156<br />
Area (1000 Ha) 9600 9,400 9,600 9,600 8,800 8,120 6,000<br />
Yield (MT/Ha) 1.02 1.02 1.01 0.95 1.08 0.95 0.90<br />
Avg daily volatility <strong>MCX</strong> spot prices - 1.03% 2.20%* 1.04%^ 1.07% 0.83% -<br />
CBOT price (Rs/qntl) - 2,475 1,664 1,901 1,891 1,303 915<br />
India, Madhya Pradesh Price (Rs/qntl) - 2,195 1,905 2,188 2,121 1,405 1,018<br />
MSP Soyabean Black (Rs. /qtl) 1650 1400 1350 1350 910 900 795<br />
MSP Soyabean Yellow (Rs. /qtl) 1690 1440 1390 1390 1050 1020 885<br />
Note: e - source estimates provided by USDA, data retrieved on July 28, 2011; market year (India): October to September; *: volatility calculated for the period from 9/9/2009 to<br />
31/3/2010; ^: Volatility calculated for the period from 4/1/2008 to 9/22/2008;<br />
Source: USDA, Dept. of Agriculture, GOI, Agmarknet<br />
Soybean state-wise area and production<br />
Area (<strong>`000'</strong> Hectares)<br />
Production ( <strong>`000'</strong> Tonnes)<br />
States/ UT 2009-10 2008-09 2007-08 2006-07 2001-02 2009-10 2008-09 2007-08 2006-07 2001-02<br />
Madhya Pradesh 5350 5124 5024 4757 4450 6406 5850 5481 4785 3735<br />
Maharashtra 3019 3063 2664 2521 1105 2197 2757 3976 2892 1386<br />
Rajasthan 778 830 798 641 656 915 806 1071 771 716<br />
Andhra Pradesh 156 142 88 103 19 129 194 173 156 20<br />
Karnataka 26 134 113 131 48 82 91 97 94 40<br />
Others 405 218 195 176 65 236 208 171 153 67<br />
Source: USDA, Dept. of Agriculture, GOI<br />
192 Commodity Insights Yearbook 2011