Binary SolidâLiquid Phase Diagrams of Selected Organic ...
Binary SolidâLiquid Phase Diagrams of Selected Organic ...
Binary SolidâLiquid Phase Diagrams of Selected Organic ...

You also want an ePaper? Increase the reach of your titles
YUMPU automatically turns print PDFs into web optimized ePapers that Google loves.
In the Laboratory<br />
<strong>Binary</strong> Solid–Liquid <strong>Phase</strong> <strong>Diagrams</strong> <strong>of</strong> <strong>Selected</strong><br />
<strong>Organic</strong> Compounds<br />
A Complete Listing <strong>of</strong> 15 <strong>Binary</strong> <strong>Phase</strong> <strong>Diagrams</strong><br />
Jürgen Gallus, Qiong Lin, Andreas Zumbühl, Sebastian D. Friess, Rudolf Hartmann, and Erich C. Meister*<br />
Physical Chemistry Laboratory, Swiss Federal Institute <strong>of</strong> Technology, ETH Zentrum, CH-8092 Zurich, Switzerland;<br />
*meister@phys.chem.ethz.ch<br />
The investigation <strong>of</strong> multicomponent solid–liquid equilibria<br />
is <strong>of</strong> considerable importance in chemistry and materials<br />
science. <strong>Binary</strong> solid–liquid phase diagrams, as the simplest<br />
representatives <strong>of</strong> these equilibria, are determined in most<br />
undergraduate physical chemistry laboratory courses because<br />
they provide a variety <strong>of</strong> thermodynamic quantities and<br />
information about the system (1–4). A large educational<br />
benefit results from the thermal analysis using even basic<br />
instrumentation. However, the almost infinite number <strong>of</strong><br />
combinations <strong>of</strong> substances is in practice limited by several<br />
factors—for example, the temperature range <strong>of</strong> melting points<br />
or the toxicity or price <strong>of</strong> the chemicals. The main purpose <strong>of</strong><br />
our work was to find a useful but limited number <strong>of</strong> compounds<br />
that can be combined to give a large number <strong>of</strong> binary systems<br />
suitable to work in an undergraduate laboratory course.<br />
This work presents the results <strong>of</strong> a laboratory project in<br />
which a set <strong>of</strong> six substances were combined to yield a total <strong>of</strong><br />
15 binary phase diagrams. The six compounds are biphenyl,<br />
durene, diphenylmethane, naphthalene, phenanthrene, and<br />
triphenylmethane. These substances are stable and without any<br />
special functional groups, easily accessible, and inexpensive.<br />
Their melting points vary between 20 and 100 °C, which<br />
allows easy melting and freezing.<br />
Further, an experimental setup especially created for the<br />
investigation <strong>of</strong> solid–liquid phase transitions is presented.<br />
This apparatus has been successfully used for many years<br />
in our undergraduate physical chemistry laboratory course<br />
and has provided us with results <strong>of</strong> reasonable accuracy and<br />
reproducibility.<br />
Some <strong>of</strong> the investigated phase diagrams are mentioned<br />
in different (mainly older) publications (5–11); some are, as<br />
far as we know, presented for the first time in this article.<br />
Solid–Liquid <strong>Phase</strong> Equilibrium<br />
The theoretical background for solid–liquid binary phase<br />
diagrams with no solid solubilities is quite simple. A system<br />
with one or more compounds A i in two phases (s) and ()<br />
that are in mutual contact is in thermodynamic equilibrium<br />
if the chemical potentials µ i are the same in both phases:<br />
µ i (s)( p,T ) = µ i ()( p,T,x i ()) (1)<br />
In the following, we consider the compounds to be completely<br />
insoluble in the solid phase<br />
µ i (s)( p,T ) = µ i *(s)( p,T ) (2)<br />
where µ i *(s)( p,T ) is the chemical potential <strong>of</strong> the pure solid<br />
compound A i at pressure p and temperature T. Complete<br />
miscibility in the liquid phase leads to<br />
µ i ()( p,T,x i ()) = µ i *()( p,T ) + RT ln(f i ()x i ()) (3)<br />
where µ i *()( p,T ) represents the chemical potential <strong>of</strong> the<br />
pure liquid compound A i . While the activity coefficients<br />
f i ()( p,T,x i ()) in real systems depend on the composition <strong>of</strong><br />
the liquid phase, in systems exhibiting nearly ideal behavior<br />
f i () ≈ 1, which, as a result <strong>of</strong> the experimental findings, can<br />
be considered fulfilled in the following. The temperature T<br />
at which the two coexisting phases are in equilibrium at<br />
constant pressure is then related to the mole fraction x i ()<br />
<strong>of</strong> the liquid melt by<br />
T =<br />
1<br />
T i<br />
* – R<br />
Δ m<br />
H i<br />
* ln x i<br />
1 (4)<br />
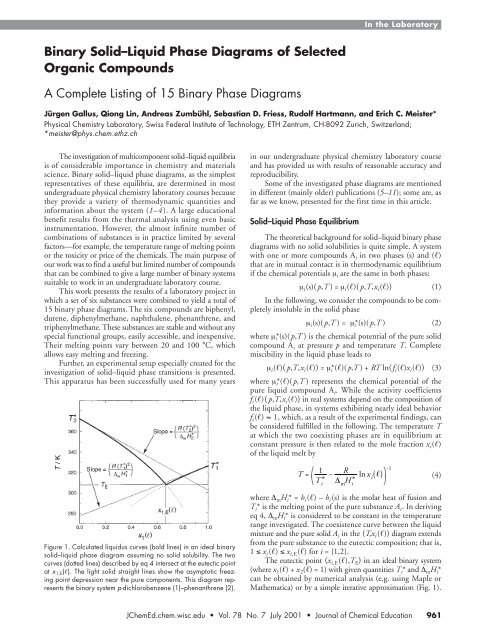
Figure 1. Calculated liquidus curves (bold lines) in an ideal binary<br />
solid–liquid phase diagram assuming no solid solubility. The two<br />
curves (dotted lines) described by eq 4 intersect at the eutectic point<br />
at x 1,E (). The light solid straight lines show the asymptotic freezing<br />
point depression near the pure components. This diagram represents<br />
the binary system p-dichlorobenzene (1)–phenanthrene (2).<br />
where Δ m H i * = h i () – h i (s) is the molar heat <strong>of</strong> fusion and<br />
T i * is the melting point <strong>of</strong> the pure substance A i . In deriving<br />
eq 4, Δ m H i * is considered to be constant in the temperature<br />
range investigated. The coexistence curve between the liquid<br />
mixture and the pure solid A i in the (T,x i ()) diagram extends<br />
from the pure substance to the eutectic composition; that is,<br />
1 ≤ x i () ≤ x i,E () for i = {1,2}.<br />
The eutectic point (x i,E (),T E ) in an ideal binary system<br />
(where x 1 () + x 2 () = 1) with given quantities T i * and Δ m H i *<br />
can be obtained by numerical analysis (e.g. using Maple or<br />
Mathematica) or by a simple iterative approximation (Fig. 1).<br />
JChemEd.chem.wisc.edu • Vol. 78 No. 7 July 2001 • Journal <strong>of</strong> Chemical Education 961
In the Laboratory<br />
Table 1. Properties <strong>of</strong> Compounds Used in This Work<br />
Compound<br />
A i<br />
Molecular<br />
Mass<br />
/(g mol<br />
M i<br />
1 )<br />
Melting<br />
a<br />
Point<br />
*/ K<br />
T i<br />
Enthalpy Cryoscopic<br />
a<br />
<strong>of</strong> Fusion Constant<br />
Δ m H i */<br />
(kJ mol<br />
)<br />
RT i<br />
* 2<br />
Δ m<br />
H i<br />
* /K<br />
Biphenyl<br />
154.21<br />
342.<br />
1 18.57<br />
52. 4<br />
Durene<br />
134.22<br />
352.<br />
4 21.<br />
0 49. 2<br />
Naphthalene<br />
128.17<br />
353.<br />
4 19.01<br />
54. 6<br />
Phenanthrene<br />
178.23<br />
372.<br />
4 16.46<br />
70. 1<br />
Diphenylmethane<br />
168.24<br />
298.<br />
5 18.57<br />
39. 9<br />
Triphenylmethane<br />
244.34<br />
365.<br />
5 21.<br />
5 51. 7<br />
a <strong>Selected</strong> values (12, 13).<br />
The two liquidus curves described by eq 4 cross at the eutectic<br />
composition when T (x 1 ()) = T (x 2 ()). Table 2 lists eutectic<br />
compositions and temperatures that have been calculated for<br />
our binary systems using the data <strong>of</strong> the pure components as<br />
given in Table 1. The cryoscopic constant R(T i *) 2 /Δ m H i * is<br />
the slope <strong>of</strong> the liquidus curve T (x i ()) at x i () = 1.<br />
Experimental Method<br />
Apparatus<br />
<strong>Phase</strong> transition temperatures <strong>of</strong> mixtures with predefined<br />
compositions were obtained from cooling curves<br />
measured with the apparatus shown in Figure 2. The apparatus<br />
consisted <strong>of</strong> a home-built mechanical stirrer, a 0.5-L stainless<br />
steel Dewar containing an appropriate cooling liquid, and a<br />
sample compartment, attached to a clamp-mounted cell<br />
holder with a polyester screw cap for quick assembly. All parts<br />
with contact to the sample were made from glass or stainless<br />
steel. The sample cell was thermally shielded from the environment<br />
by an outer wide glassy isolation tube, thereby<br />
decreasing the cooling rate <strong>of</strong> the molten sample. The mount<br />
contained two narrow tubes, one guiding a stirring wire that<br />
moved up and down by means <strong>of</strong> a stirring device (small servo<br />
motor with gearing) to mix the melt thoroughly and to avoid<br />
supercooling <strong>of</strong> the melt. One junction <strong>of</strong> a K-type thermocouple<br />
entered through the other pipe down into the sample.<br />
Figure 2. Schematic drawing <strong>of</strong> experimental assembly.<br />
The reference junction was held in an ice–water mixture in<br />
an external Dewar. The thermocouple voltage (ca. 40 µV K 1 )<br />
was measured and plotted as thermograms with a W+W 600<br />
strip-chart recorder while the sample cooled and solidified.<br />
Procedure<br />
The solid samples were liquefied by heating the sample<br />
tube (with the isolation tube removed) with a hair dryer.<br />
Regular cooling <strong>of</strong> the probe could be achieved by immersing<br />
the sample cell in an ice bath with the aid <strong>of</strong> a laboratory<br />
jack supporting the bath. Applying vacuum isolation between<br />
the sample tube and the outer tube was not necessary but could<br />
be used in cases where a lower cooling rate was appropriate. A<br />
sample mass <strong>of</strong> typically 1–3 g was enough for a run. Therefore,<br />
a top-loading balance with a readability <strong>of</strong> ±0.01 g was<br />
convenient to weigh the components directly into the sample<br />
tube with sufficient precision.<br />
Table 2. Compositions and Temperatures <strong>of</strong> All 15 Eutectic <strong>Binary</strong> Systems<br />
Naphthalene<br />
Phenanthrene<br />
Biphenyl<br />
Diphenylmethane<br />
Triphenylmethane<br />
x , E<br />
Durene<br />
Triphenylmethane<br />
Diphenylmethane<br />
Biphenyl<br />
Phenanthrene<br />
1 () T E /°C x 1 , E () T E /°C x 1 , E () T E /°C x 1 , E () T E /°C x 1 , E () T E /°C<br />
0.49<br />
0.49<br />
0.54<br />
0.54<br />
0.42<br />
0.43<br />
0.20<br />
0.21<br />
0.55<br />
0.57<br />
47.7<br />
47.2<br />
55.0<br />
51.5<br />
44.8<br />
42.0<br />
16.6<br />
16.2<br />
55.2<br />
53.5<br />
0.46<br />
0.42<br />
0.47<br />
0.48<br />
0.40<br />
0.36<br />
0.20<br />
0.17<br />
52.4<br />
52.6<br />
56.3<br />
58.2<br />
43.8<br />
46.7<br />
13.7<br />
18.3<br />
a<br />
0.66<br />
0.77<br />
0.82<br />
0.78<br />
0.61<br />
0.72<br />
a<br />
12.8<br />
15.2<br />
16.5<br />
15.9<br />
10.2<br />
12.9<br />
b<br />
0.54<br />
0.56<br />
0.61<br />
0.60<br />
b<br />
41.7<br />
40.8<br />
54.3<br />
44.3<br />
c<br />
0.47<br />
0.45<br />
c<br />
48.6<br />
50.5<br />
–––––––––––––––––––––––<br />
NOTE: Values set in boldface type were obtained from experimental data; other values were calculated<br />
using data from Table 1. Components in the column headings are assigned the index 1.<br />
a<br />
0.74; 15.4 °C (10).<br />
b<br />
0.555; 39.4 °C (9).<br />
c<br />
0.45; 48.0 °C (10) and 0.46; 47.5 °C (11).<br />
962 Journal <strong>of</strong> Chemical Education • Vol. 78 No. 7 July 2001 • JChemEd.chem.wisc.edu
In the Laboratory<br />
Transition temperatures (freezing/melting) <strong>of</strong> eutectic and<br />
other mixtures were determined as break and arrest temperatures<br />
in the cooling curves, as described in standard laboratory<br />
textbooks (1–3) and shown elsewhere in this Journal (6, 14).<br />
Chemicals<br />
Biphenyl, diphenylmethane, naphthalene, phenanthrene,<br />
and triphenylmethane were purchased from Fluka in purum<br />
grade quality and used without further purification; durene was<br />
purchased from Fluka in puriss. grade and used as received.<br />
Hazards<br />
The polyaromatics used in these experiments are known<br />
to be toxic or irritant. It is strongly recommended that the<br />
most recent material safety data sheets (MSDSs) and the risk<br />
and safety phrases (RS phrases) <strong>of</strong> all compounds be consulted<br />
before handling them. Contamination <strong>of</strong> skin and eyes<br />
and inhalation <strong>of</strong> dust particles must be avoided. Students<br />
should therefore wear protective gloves and preferably place the<br />
apparatus in a hood. We used an essentially closed sample<br />
compartment (Fig. 2) to minimize the release <strong>of</strong> gaseous probe<br />
material into the laboratory environment.<br />
Experimental Results<br />
The solid–liquid phase diagrams <strong>of</strong> all 15 binary systems<br />
are presented in Figure 3. Experimental points are drawn with<br />
error bars that result from estimated uncertainties <strong>of</strong> the<br />
determined break and arrest temperatures in the thermograms.<br />
Figure 3. Experimental phase diagrams <strong>of</strong> all 15 binary systems. Break and arrest temperatures obtained from thermograms are shown with<br />
open circles and diamonds, respectively. Liquidus curves result from least-squares fits <strong>of</strong> eq 4 to the experimental data. Horizontal lines indicate<br />
the maximum arrest temperatures corresponding to the extrapolated melting temperature <strong>of</strong> the eutectic.<br />
JChemEd.chem.wisc.edu • Vol. 78 No. 7 July 2001 • Journal <strong>of</strong> Chemical Education 963
In the Laboratory<br />
The liquidus curves were calculated by fitting eq 4 to the<br />
experimental data using a nonlinear least-squares procedure<br />
(15) with unknown parameters Δ m H i * and T i *. Alternatively,<br />
linear regression can be applied to the data after adequate<br />
transformation. From the two branches, eutectic compositions<br />
and melting temperatures were calculated, giving the<br />
data in Table 2.<br />
Our results agree to within a few percent with predicted<br />
values on the basis <strong>of</strong> ideal behavior (that is, assuming<br />
temperature-independent enthalpies <strong>of</strong> fusion and negligible<br />
solid solubility). Each system showed a simple phase diagram<br />
with clear freezing-point depression and one single eutectic<br />
point. All phase transition temperatures lay well within the small<br />
range <strong>of</strong> 0 to 100 °C, which means that the use <strong>of</strong> a water<br />
bath would be a convenient way to melt the samples, as was<br />
recommended recently in this Journal (6 ).<br />
The largest deviations between measured and calculated<br />
eutectic data were observed in systems involving diphenylmethane<br />
(see Table 2), although their phase diagrams were still<br />
reasonable (Fig. 3, column 3). The low melting point <strong>of</strong><br />
diphenylmethane (25.3 °C) and its mixtures facilitates supercooling<br />
effects. A 1:3 sodium chloride–ice freezing mixture<br />
(17 °C) was used in these cases.<br />
Conclusions<br />
This work presents a systematic investigation <strong>of</strong> solid–<br />
liquid equilibria <strong>of</strong> 15 binary systems from the combination<br />
<strong>of</strong> only 6 selected aromatic hydrocarbons. 1 These compounds<br />
are readily available and inexpensive, they melt in a convenient<br />
temperature range, and need no further purification. For<br />
undergraduate physical chemistry laboratory courses, this<br />
material provides a variety <strong>of</strong> suitable systems illustrating the<br />
concepts <strong>of</strong> heterogeneous equilibrium. We believe that<br />
students will benefit from the qualitative behavior and<br />
quantitative data resulting from these experiments.<br />
Acknowledgments<br />
We would like to thank Elizabeth Donley and Urs P.<br />
Wild for careful pro<strong>of</strong>reading <strong>of</strong> the manuscript and helpful<br />
discussions. Technical assistance by Peter Nyffeler is gratefully<br />
acknowledged.<br />
Note<br />
1. Further experiments have shown that our set <strong>of</strong> compounds<br />
can be extended by, for example, the aromatic hydrocarbons fluorene<br />
and trans-stilbene, which both give eutectics with compounds<br />
described in the article.<br />
Literature Cited<br />
1. Shoemaker, D. P.; Garland, C. W.; Nibler, J. W. Experiments<br />
in Physical Chemistry, 6th ed.; McGraw-Hill: New York, 1996.<br />
2. Sime, R. J. Physical Chemistry: Methods, Techniques, and Experiments;<br />
Saunders: Philadelphia, PA, 1990.<br />
3. Halpern, A. M. Experimental Physical Chemistry: A Laboratory<br />
Textbook, 2nd ed.; Prentice Hall: Upper Saddle River, NJ,<br />
1997.<br />
4. Williams, K. R.; Collins, S. E. J. Chem. Educ. 1994, 71, 617–<br />
620.<br />
5. Landolt-Börnstein, Zahlenwerte und Funktionen aus Physik,<br />
Chemie, Astronomie, Geophysik und Technik, 6th ed.; Springer:<br />
Heidelberg, 1956; Vol. II, Part 3.<br />
6. Calvert, D.; Smith, M. J.; Falcão, E. J. Chem. Educ. 1999,<br />
76, 668–670.<br />
7. Ellison, H. R. J. Chem. Educ. 1978, 55, 406–407.<br />
8. Blanchette, P. P. J. Chem. Educ. 1987, 64, 267–268.<br />
9. Howard Lee, H.; Warner, J. C. J. Am. Chem. Soc. 1935, 57,<br />
318–321.<br />
10. Miolati, A. Z. Phys. Chem. Stöchiom. Verwandtschaftsl. 1892,<br />
9, 649–655.<br />
11. Rudolfi, E. Z. Phys. Chem. Stöchiom. Verwandtschaftsl. 1909,<br />
66, 705–732.<br />
12. Landolt-Börnstein, Numerical Data and Functional Relationships<br />
in Science and Technology: New Series, Group IV, Macroscopic<br />
and Technical Properties <strong>of</strong> Matter; Springer: Berlin, 1995; Vol<br />
8A.<br />
13. CRC Handbook <strong>of</strong> Chemistry and Physics, 74th ed.; Lide, D.<br />
R., Ed.; CRC Press: Boca Raton, FL, 1993.<br />
14. Bailey, R. A.; Desai, S. B.; Hepfinger, N. F.; Hollinger, H. B.;<br />
Locke, P. S.; Miller, K. J.; Deacutis, J. J.; VanSteele, D. R.<br />
J. Chem. Educ. 1997, 74, 732–733.<br />
15. Turner, P. J. Program XMgr; ftp://plasma-gate.weizmann.ac.il/<br />
pub/xmgr4; see home page http://plasma-gate.weizmann.ac.il/<br />
Grace (both accessed Apr 2001).<br />
964 Journal <strong>of</strong> Chemical Education • Vol. 78 No. 7 July 2001 • JChemEd.chem.wisc.edu