analysis of seasonal extreme flows using peaks over threshold method
analysis of seasonal extreme flows using peaks over threshold method
analysis of seasonal extreme flows using peaks over threshold method

Create successful ePaper yourself
Turn your PDF publications into a flip-book with our unique Google optimized e-Paper software.
J. Hydrol. Hydromech., 55, 2007, 1, 16–22<br />
ANALYSIS OF SEASONAL EXTREME FLOWS USING<br />
PEAKS OVER THRESHOLD METHOD<br />
PETER BAČA, VERONIKA BAČOVÁ MITKOVÁ<br />
Ústav hydrológie SAV, Račianska 75, 831 02 Bratislava 3, Slovenská republika; mailto: baca@uh.savba.sk<br />
The paper presents review <strong>of</strong> occurrence frequency <strong>of</strong> <strong>extreme</strong> hydrological events in a small agricultural<br />
basin in the flysh region <strong>over</strong> the period <strong>of</strong> 40 years (1964/65 – 2003/04). No human alterations were carried<br />
out in the basin <strong>over</strong> the period studied and hence influence <strong>of</strong> climatic changes on intensification <strong>of</strong><br />
water cycle could be evaluated. Peaks <strong>over</strong> <strong>threshold</strong> (POT) <strong>method</strong> was applied separately to winter and<br />
summer hydrological events. In comparison with annual maximum series, all mean daily discharge values<br />
<strong>over</strong> a certain <strong>threshold</strong>s were taken into account for POT frequency <strong>analysis</strong>. The frequency <strong>of</strong> POT events<br />
has decreased in the past two decades (1984/85 – 1993/94 and 1994/95 – 2003/04). The results reveal that<br />
the most <strong>extreme</strong> values occurred in the 1964/65 – 1973/74 decade, mostly caused by summer rainfall. High<br />
event frequency also emerges in the 1974/75 – 1983/84 decade, especially in winter seasons as the consequence<br />
<strong>of</strong> snow melting. It is most likely that influence <strong>of</strong> climatic changes has not resulted yet in increase<br />
<strong>of</strong> occurrence frequency <strong>of</strong> POT events in the basin studied <strong>over</strong> the 40 years period.<br />
KEY WORDS: Flood Frequency Analysis, Peaks Over Threshold (POT) Method, Run<strong>of</strong>f Changes, Seasonal<br />
Extreme Flows.<br />
Peter Bača, Veronika Bačová Mitková: VYUŽITIE METÓDY (POT) PRIETOKOV NAD ZVOLENOU<br />
PRAHOVOU HODNOTOU PRI ANALÝZE EXTRÉMNYCH SEZÓNNYCH PRIETOKOV. Vodohosp.<br />
Čas., 55, 2007, 1; 27 lit., 4 obr.<br />
Príspevok sa zaoberá frekvenciou výskytu extrémnych hydrologických udalostí na malom poľnohospodárskom<br />
povodí vo flyšovom pásme počas 40-ročnej periódy (1964/65–2003/04). Počas tohto obdobia<br />
nebolo povodie ovplyvnené významnými zmenami ľudskej činnosti a preto mohol byť zhodnotený<br />
vplyv klimatických zmien na intenzifikáciu hydrologického cyklu. POT metóda bola aplikovaná zvlášť pre<br />
zimné a letné hydrologické udalosti. V porovnaní so sériami ročných maxím, všetky priemerné denné prietoky<br />
nad určitou prahovou hodnotou boli zahrnuté do POT frekvenčných analýz. Frekvencia POT udalostí<br />
(nad zvolenou prahovou hodnotou) klesla v posledných dvoch dekádach (1984/85–1993/94 a 1994/95–<br />
2003/04). Výsledky ukazujú, že najextrémnejšie hodnoty priemerných denných prietokov, spôsobené prevažne<br />
letnými prívalovými zrážkami sa objavili v dekáde 1964/65–1973/74. Vysoké hodnoty prietokov,<br />
spôsobené prevažne topením snehovej pokrývky sa vyskytli tiež v dekáde 1974/75–1983/84. Je nanajvýš<br />
pravdepodobné, že v študovanom povodí za obdobie 40-tich rokov klimatické zmeny nemali zatiaľ vplyv<br />
na zvyšovanie frekvencie extrémnych udalostí.<br />
KĽÚČOVÉ SLOVÁ: analýza frekvencie povodní, POT metóda, zmeny v odtoku, sezónne extrémne prietoky.<br />
Introduction<br />
In connection with climatic changes, greater attention<br />
is given to occurrence frequency <strong>of</strong> <strong>extreme</strong><br />
hydrological events. Labat et al. (2004) conclude<br />
that an increase in world continental run<strong>of</strong>f from<br />
major rivers for the period 1920 – 1995 provides<br />
the first experimental data-based evidence demonstrating<br />
the link between the global warming and<br />
the intensification <strong>of</strong> the global hydrological cycle.<br />
Higher frequency <strong>of</strong> <strong>extreme</strong> flow occurrence and<br />
increase in run<strong>of</strong>f in different regions in the latter<br />
half <strong>of</strong> the 20th century have been published by<br />
many authors (Foster et al., 1997; Milly et al.,<br />
2002; Peterson et al., 2002; Werritty, 2002; Walter<br />
et al., 2004; Micevski et al., 2006).<br />
Zhang et al. (2006) show that higher occurrence<br />
frequency <strong>of</strong> annual maximum water level <strong>over</strong><br />
time is not influenced by the single factor like climatic<br />
change, but by multiple factors like human<br />
16
Analysis <strong>of</strong> <strong>seasonal</strong> <strong>extreme</strong> <strong>flows</strong> <strong>using</strong> Peaks <strong>over</strong> <strong>threshold</strong> <strong>method</strong><br />
activities. Vörösmarty and Sahagian (2000) noted<br />
that increases in run<strong>of</strong>f may be attributable to human<br />
alterations such as conversion from forest to<br />
agricultural land uses. In contrast, reforestation<br />
could result in decreases in run<strong>of</strong>f. However, in<br />
spite <strong>of</strong> abandonment <strong>of</strong> cultivated farmlands and<br />
conversion to forest or pasture, increases in run<strong>of</strong>f<br />
due to intensification <strong>of</strong> the water cycle has been<br />
documented by Milly and Dunne (2001).<br />
In other cases, measured data indicates decrease<br />
or no changes in magnitude and flood frequency<br />
(Aizen et al., 1997; Zhang et al., 2001; Holko and<br />
Kostka, 2005). Sharma and Shakya (2006) concluded<br />
that the magnitude <strong>of</strong> flood is decreasing but<br />
its frequency and duration are increasing.<br />
Although climate change is a global phenomenon<br />
the trends and impact may be different at a local<br />
scale. Analysis should be done at the local level<br />
rather than at the large scale (Sharma and Shakya,<br />
2006). Flash floods caused by intensive rainfall<br />
events occurred in the last years in small basins in<br />
Slovakia (Grešková, 2005). The results presented<br />
by Svoboda and Pekárová (1998) show that in the<br />
Carpathian flysh region an intensive rainfall <strong>over</strong><br />
a small catchment sufficiently wetted by the antecedent<br />
even moderate precipitation can cause 500-<br />
year return period flood which can not be effectively<br />
reduced neither by retention capacity <strong>of</strong> the<br />
shallow soil nor by interception <strong>of</strong> a dense and<br />
healthy forest.<br />
The annual maximum series approach is the most<br />
frequently used <strong>method</strong> for probabilistic assessment<br />
<strong>of</strong> design <strong>flows</strong>. The annual maximum series considers<br />
only one value per year, i. e. annual maximum<br />
(AM). However, the use <strong>of</strong> an AM series may<br />
involve some loss <strong>of</strong> information. For example, the<br />
second or third peak within a year may be grater<br />
than maximum flow in other years and yet they are<br />
ignored (Kite, 1977; Chow et al., 1988). This situation<br />
is avoided in the <strong>peaks</strong> <strong>over</strong> <strong>threshold</strong> (POT)<br />
<strong>method</strong> where all <strong>peaks</strong> above a certain base value<br />
are considered (Bayliss, 1999; Rao and Hamed,<br />
2000; Black and Burns, 2002; Ouarda et al., 2006).<br />
More<strong>over</strong>, POT <strong>method</strong> allows detection <strong>of</strong><br />
changes in the frequency <strong>of</strong> occurrence <strong>of</strong> <strong>extreme</strong><br />
floods or hydrological events in different seasons.<br />
The purpose <strong>of</strong> the paper is to analyse changes in<br />
occurrence frequency <strong>of</strong> <strong>extreme</strong> hydrological<br />
events in a small basin in the flysh region <strong>over</strong> the<br />
period <strong>of</strong> 40 years. POT <strong>method</strong> was applied separately<br />
to winter and summer hydrological halfyears.<br />
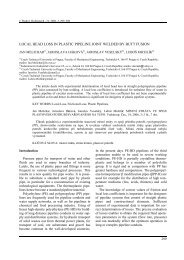
Study area<br />
The study focuses on the agricultural micro-basin<br />
Rybárik, near Považská Bystrica (Western Slovakia,<br />
Central Europe) (Fig. 1). The Rybárik basin is<br />
a part <strong>of</strong> the experimental Mošteník brook basin<br />
and is bounded by latitude 49°06′N and 49°07′N;<br />
RYBÁRIK<br />
Jel ové<br />
Legend<br />
Gauging Station<br />
Forest<br />
Watershed Boundary<br />
0 100 200 300 400 500 m<br />
Fig. 1. The experimental Rybárik basin.<br />
Obr. 1. Experimentálne povodie Rybárik.<br />
17
P. Bača, V. Bačová Mitková<br />
and longitude 18°24′E and 18°25′E. The Mošteník<br />
basin is a part <strong>of</strong> the Váh River catchment, which is<br />
the main tributary <strong>of</strong> the Danube River from the<br />
territory <strong>of</strong> Slovakia. The area <strong>of</strong> the Rybárik basin<br />
is 0.12 km 2 . The mean elevation <strong>of</strong> the basin is<br />
about 400 m a. s. l. (min 375 m a. s. l., max 434 m<br />
a. s. l.) with slope angles <strong>of</strong> 8 – 25%. Length <strong>of</strong> the<br />
Jelšové stream from the spring, which is found in<br />
the Rybárik basin, to the outlet section is 255 m and<br />
average gradient is 9.1%. The geological conditions<br />
in this micro-basin are characterized by flysh substrates<br />
(alternating layers <strong>of</strong> clay and sandstones).<br />
Soils are clay loams and are classified as Cambisols.<br />
The Rybárik basin is mainly arable, only<br />
10.4% <strong>of</strong> the area is c<strong>over</strong>ed by forest. Mean annual<br />
temperature is 8.09 °C, mean annual precipitation is<br />
738 mm and the run<strong>of</strong>f averages 231 mm year -1 .<br />
Water discharge data and <strong>method</strong>s<br />
Discharge is measured continuously by weir fitted<br />
with recording gauge. Water-level stage <strong>of</strong> the<br />
Jelšové stream is under steady state conditions during<br />
major period <strong>of</strong> the year. Discharge values are<br />
low and range between 0.04 – 0.5 l s -1 . However,<br />
water level increasing occurred during hydrological<br />
events resulted from snow melting (in winter and<br />
spring months) and from rainfall (mainly in summer<br />
months). Annual peak discharges range between<br />
10.9–364.2 l s -1 (<strong>over</strong> the period <strong>of</strong> 40 hydrological<br />
years 1964/65 – 2003/04) (Pekárová et al.,<br />
2005).<br />
Although discharge is measured continuously,<br />
due to lacking archival data (instantaneous peak<br />
discharges) only values <strong>of</strong> daily mean discharge<br />
were analysed. Two different <strong>peaks</strong> <strong>over</strong> <strong>threshold</strong><br />
(POT) records were created, one for winter halfyears,<br />
in which increases in <strong>flows</strong> are mostly<br />
caused by snow melting or combination <strong>of</strong> snow<br />
melting with rainfall, and one for summer halfyears,<br />
in which increases in <strong>flows</strong> results from intensive<br />
rainfall. This allowed detection <strong>of</strong> changes<br />
<strong>of</strong> occurrence frequency <strong>of</strong> POT data (mean daily<br />
discharge values) in different seasons and provided<br />
higher homogeneity <strong>of</strong> single POT records.<br />
For each record, POT data were extracted <strong>using</strong><br />
<strong>threshold</strong>s selected to give, on average, 1.0 and 0.2<br />
exceedances per season, respectively, <strong>over</strong> the 40-<br />
year period (1964/65 – 2003/04). Generally, flood<br />
frequency <strong>analysis</strong> considers only one value per<br />
year or season. However, application <strong>of</strong> such approach<br />
may mask years or decades when the most<br />
<strong>extreme</strong> values occurred. The value <strong>of</strong> upper<br />
<strong>threshold</strong> (0.2 exceedance per year) was selected to<br />
show in which decades the highest mean daily discharge<br />
values occurred. As shown in Figs 2 and 3<br />
selected value <strong>of</strong> the upper <strong>threshold</strong> emerges as<br />
satisfactory for this purpose. In order to provide<br />
independence <strong>of</strong> POT data the following criterions<br />
were used:<br />
[%]<br />
80<br />
70<br />
60<br />
50<br />
40<br />
30<br />
20<br />
10<br />
0<br />
POT 1<br />
POT 0,2<br />
1965-1974 1975-1984 1985-1994 1995-2004<br />
Fig. 2. Portion (in percentages) <strong>of</strong> mean daily discharge<br />
exceeding <strong>threshold</strong>s yielding, on average, 1.0 and 0.2 events<br />
per winter hydrological year in single decades <strong>over</strong><br />
the 40-years period in the Rybárik basin.<br />
Obr. 2. Percentuálny podiel priemerných denných prietokov<br />
nad zvolené prahové hodnoty, 1,0- resp. 0,2-krát v priemere za<br />
zimný hydrologický polrok v jednotlivých dekádach<br />
za 40-ročné obdobie v povodí Rybárik.<br />
[%]<br />
80<br />
70<br />
60<br />
50<br />
40<br />
30<br />
20<br />
10<br />
0<br />
POT 1<br />
POT 0,2<br />
1965-1974 1975-1984 1985-1994 1995-2004<br />
Fig. 3. Portion (in percentages) <strong>of</strong> mean daily discharge<br />
exceeding <strong>threshold</strong>s yielding, on average, 1.0 and 0.2 events<br />
per summer hydrological year in single decades <strong>over</strong><br />
the 40-years period in the Rybárik basin.<br />
Obr. 3. Percentuálny podiel priemerných denných prietokov<br />
nad zvolené prahové hodnoty, 1,0- resp. 0,2-krát v priemere za<br />
letný hydrologický polrok v jednotlivých dekádach za 40-ročné<br />
obdobie v povodí Rybárik.<br />
18
Analysis <strong>of</strong> <strong>seasonal</strong> <strong>extreme</strong> <strong>flows</strong> <strong>using</strong> Peaks <strong>over</strong> <strong>threshold</strong> <strong>method</strong><br />
− the value <strong>of</strong> mean daily discharge extracted is<br />
higher than the values on preceding day and next<br />
day;<br />
− for winter POT data it is considered that the values<br />
<strong>of</strong> mean daily discharge between two days on<br />
which POT data were recorded do not change<br />
significantly <strong>over</strong> time and remain low during<br />
a few days;<br />
− for summer POT data, when basin response to<br />
rainfall is fast, time interval between days on<br />
which POT data were recorded is three days at<br />
least and the values <strong>of</strong> mean daily discharge between<br />
two days on which POT data were recorded<br />
do not change significantly <strong>over</strong> time and<br />
remain low during a few days; minimum value <strong>of</strong><br />
mean daily discharge in this time interval is low.<br />
Results and discussion<br />
Time series plots have been used to reveal the<br />
temporal distribution <strong>of</strong> the values <strong>of</strong> mean daily<br />
discharge above the <strong>threshold</strong>s selected in two records.<br />
In winter seasons at the lower <strong>threshold</strong><br />
(68 l s -1 km -2 ), the frequency <strong>of</strong> occurrence <strong>of</strong> hydrological<br />
events caused by snow melting does not<br />
change remarkably in single decades (Fig. 2). The<br />
highest event frequency emerges in the 1974/75 –<br />
1983/84 decade. However, at the upper <strong>threshold</strong><br />
(156 l s -1 km -2 ) a contrast between the 1964/65–<br />
1983/84 and 1984/85 – 2003/04 periods is evident<br />
with the highest event frequency in the 1974/75 –<br />
1983/84 decade. Fig. 2. reveals that the most <strong>extreme</strong><br />
values <strong>of</strong> mean daily discharge occurred in<br />
the 1964/65 – 1983/84 period.<br />
In summer half years, event frequency varies<br />
markedly <strong>over</strong> decades at both <strong>threshold</strong>s (the<br />
lower one is 52 l s -1 km -2 and the upper one is 130<br />
l s -1 km -2 ) with more decreasing trends at the upper<br />
<strong>threshold</strong> (Fig. 3). The most <strong>extreme</strong> values <strong>of</strong><br />
mean daily discharge especially occurred in the<br />
1964/65 – 1973/74 decade, while in the 1974/75 –<br />
2003/04 period, the event frequency was very low.<br />
When both seasons are considered, on average,<br />
the 1964/65 – 1973/74 decade emerges as the decade<br />
with the highest event frequency (mostly in<br />
summer and less in winter) <strong>using</strong> data extracted<br />
above the upper <strong>threshold</strong>. High event frequency at<br />
the upper <strong>threshold</strong> also emerges in the 1974/75 –<br />
1983/84 decade (especially in winter). Comparison<br />
<strong>of</strong> the values <strong>of</strong> mean daily discharge shows that<br />
higher values occurred during snow melting (Fig.<br />
4). The four highest values, however, were recorded<br />
during summer <strong>extreme</strong> hydrometeorological<br />
events. It is obvious that these values occurred<br />
<strong>over</strong> the 1964/65 – 1973/74 decade. It is confirmed<br />
that the most <strong>extreme</strong> discharge values were recorded<br />
<strong>over</strong> this decade.<br />
350<br />
300<br />
winter<br />
summer<br />
250<br />
Q [l.s -1 .km 2 ]<br />
200<br />
150<br />
100<br />
50<br />
0<br />
0 5 10 15 20 25 30 35 40<br />
Fig. 4. The ascending line <strong>of</strong> 40 the highest values <strong>of</strong> mean daily discharge for summer and winter hydrological years <strong>over</strong><br />
the 40-years period in the Rybárik basin.<br />
Obr. 4. Vzostupný rad 40-tich najvyšších hodnôt priemerných denných prietokov pre zimné a letné hydrologické polroky za 40-ročné<br />
obdobie v povodí Rybárik.<br />
19
P. Bača, V. Bačová Mitková<br />
As noted above, only the values <strong>of</strong> mean daily<br />
discharge were used for <strong>analysis</strong>. Linsley et al.<br />
(1949) reveal certain practical deficiencies <strong>of</strong> mean<br />
<strong>flows</strong>. The maximum mean daily <strong>flows</strong> never<br />
equals the peak flow, and only occasionally will the<br />
maximum 24-hr period coincide with a calendar<br />
day. The maximum daily flow rarely, therefore,<br />
represents the maximum 24-hr flow. Random timing<br />
<strong>of</strong> a hydrograph with respect with calendar days<br />
frequently results in a maximum mean daily flow<br />
on a day other than on which the actual instantaneous<br />
peak flow occurred. Secondary flood <strong>peaks</strong><br />
may be masked by the averaging <strong>of</strong> flow to compute<br />
mean daily values.<br />
In order to compute missing instantaneous peak<br />
values, relationship for predicting the missing data<br />
from the recorded mean daily flow for the day on<br />
which the instantaneous value occurred can be used<br />
(McCuen and Beighley, 2003). However, satisfying<br />
records <strong>of</strong> instantaneous peak values were not<br />
available.<br />
In spite <strong>of</strong> the uncertainties regarding to mean<br />
daily data, it may be concluded that occurrence<br />
frequency <strong>of</strong> <strong>extreme</strong> events decreased <strong>over</strong> the 40<br />
years period in the study Rybárik basin. Human<br />
alterations such as conversion <strong>of</strong> forest to agricultural<br />
land uses or others, which can be related to<br />
changes in event frequency (Huntington, 2006),<br />
have not been carried out <strong>over</strong> the 40 years period.<br />
Thus, it is most likely that influence <strong>of</strong> climatic<br />
changes on increase in run<strong>of</strong>f, which are suggested<br />
to take place in northern hemisphere, based on the<br />
results <strong>of</strong> modelling studies (Manabe et al., 2004),<br />
has not been recorded yet in the Rybárik basin. The<br />
results <strong>of</strong> this study are consistent with the conclusions<br />
<strong>of</strong> the <strong>analysis</strong> in mountains catchments in<br />
Central Slovakia <strong>over</strong> the 1962 – 2001 period published<br />
by Holko and Kostka (2005). Similarly, in<br />
Canada, increasing temperature combined with<br />
almost no change in precipitation, resulted in no<br />
change in annual streamflow from 1947 to 1996 for<br />
most regions (Zhang et al., 2001). The basins studied<br />
in North America were selected because <strong>of</strong><br />
minimal human perturbations to the water cycle.<br />
Conclusion<br />
This review reports changes in occurrence frequency<br />
<strong>of</strong> <strong>extreme</strong> mean daily discharge values<br />
<strong>over</strong> the 1964/65 – 2003/04 period in the small<br />
agricultural Rybárik basin placed in the flysh region.<br />
Peaks <strong>over</strong> <strong>threshold</strong> <strong>method</strong> was used for<br />
detection <strong>of</strong> changes in discharge values <strong>over</strong><br />
<strong>threshold</strong>s selected separately for hydrological<br />
events caused by snow melting in winter seasons<br />
and rainfall in summer seasons in single decades.<br />
The frequency <strong>of</strong> POT events has decreased in<br />
the past two decades (1984/85 – 1993/94 and<br />
1994/95 – 2003/04). The results reveal that the<br />
most <strong>extreme</strong> values <strong>of</strong> mean daily discharge occurred<br />
in the 1964/65 – 1973/74 (mostly in summer)<br />
and 1974/75 – 1983/84 (especially in winter)<br />
periods. The former decade emerges as the decade<br />
with the most <strong>extreme</strong> mean daily discharge values<br />
recorded <strong>over</strong> the period studied. However, higher<br />
values generally occurred during snow melting.<br />
Human alterations, which can result in increase<br />
or decrease in flood frequency, have not been carried<br />
out <strong>over</strong> the 40 years period. The results presented<br />
imply that influence <strong>of</strong> climatic changes on<br />
intensification <strong>of</strong> hydrological cycle has not been<br />
recorded yet in the Rybárik basin. The role <strong>of</strong> climatic<br />
changes and its influence on flood frequency<br />
still remains questionable. The next research should<br />
also include catchments where flash floods caused<br />
by intensive rainfall events occurred in the last<br />
years. As suggested, not only climatic changes but<br />
also human alterations such as conversion <strong>of</strong> forest<br />
to agricultural land uses should be taken into account<br />
in flood frequency <strong>analysis</strong>.<br />
Acknowledgements. This research was supported by<br />
the Science and Technology Assistance Agency<br />
(Slovakia) under contract no. APVT-7804 and by<br />
the Science Granting Agency (Slovakia) under contract<br />
no. VEGA-5055.<br />
REFERENCES<br />
AIZEN V.B., AIZEN E.M., MELACK J.M., DOZIER J., 1997:<br />
Climatic and hydrologic changes in the Tien Shan, Central<br />
Asia. J. Clim., 10, 1393–1404.<br />
BAYLISS A.C., 1999: Catchment descriptors. Flood estimation<br />
handbook, vol. 5., Institute <strong>of</strong> Hydrology, Wallingford.<br />
BLACK A.R., BURNS J.C., 2002: Re-assessing the flood risk<br />
in Scotland. The Sci. <strong>of</strong> the Total Environ., 294, 169–184.<br />
CHOW V.T., MAIDMENT D.R., MAYS L.W., 1988: Applied<br />
hydrology. McGraw-Hill, New York, NY.<br />
FOSTER M.J., WERRITTY A., SMITH K., 1997: The nature,<br />
causes and impacts <strong>of</strong> recent hydroclimatic variability in<br />
Scotland and Northern Ireland. Proceedings, Sixth National<br />
Hydrology Symposium. Wallingford: British Hydrological<br />
Society.<br />
GREŠKOVÁ A., 2005: Analysis <strong>of</strong> selected basin parameters<br />
from the point <strong>of</strong> wiev <strong>of</strong> flash flood occurrence. Geographical<br />
J., 57, 2, 131–144.<br />
HOLKO L., KOSTKA Z., 2005: Analýza maximálneho denného<br />
prietoku v horských povodiach stredného Slovenska.<br />
20
Analysis <strong>of</strong> <strong>seasonal</strong> <strong>extreme</strong> <strong>flows</strong> <strong>using</strong> Peaks <strong>over</strong> <strong>threshold</strong> <strong>method</strong><br />
In: Hydrologie malého povodí 2005, ISBN 80-02-01754,<br />
Ústav pro hydrodynamiku, 119–124.<br />
HUNTINGTON T.G., 2006: Evidence for intensification <strong>of</strong> the<br />
global water cycle: Rewiev and synthesis. J. Hydrol., 319,<br />
83–95.<br />
KITE G.W., 1977: Frequency and risk <strong>analysis</strong> in hydrology.<br />
Water Res. Publications, Fort Collins, CO.<br />
LABAT D., GODDÉRIS Y., PROBST J. L., GUZOT J. L.,<br />
2004: Evidence for global run<strong>of</strong>f increase related to climate<br />
warming. Adv. Water Resour., 27, 631–642.<br />
LINSLEY R.K., KOHLER M.A., PAULHUS J.L.H., 1949:<br />
Applied hydrology. McGraw-Hill, New York, NY.<br />
MANABE S., WETHERALD R.T., MILLY P.C.D., DEL-<br />
WORTH T.L., STOUFFER R.J., 2004: Century-scale<br />
change in water availability: CO2-quadrupling experiment.<br />
Climatic change, 64, 59–76.<br />
McCUEN R.H., BEIGHLEY R.E., 2003: Seasonal flow frequency<br />
<strong>analysis</strong>. J. Hydrol., 279, 43–56.<br />
MICEVSKI T., FRANKS S.W., KUCZERA G., 2006: Multidecadal<br />
variability in coastal eastern Australian flood data.<br />
J. Hydrol., 327, 219–225.<br />
MILLY P.C.D., DUNNE K.A., 2001: Trends in evaporation<br />
and surface cooling in the Mississippi River basin. Geophys.<br />
Res. Lett., 28, 1219–1222.<br />
MILLY P.C.D., WETHERALD R.T., DUNNE K.A., DEL-<br />
WORTH T.L., 2002: Increasing risk <strong>of</strong> great floods in<br />
a changing climate. Nature, 415, 514–517.<br />
OUARDA T.B. CUNDERLIK J.M., ST-HILAIRE A., BAR-<br />
BET M., BRUNEAU P., BOBÉE B., 2006: Data-based<br />
comparison <strong>of</strong> <strong>seasonal</strong>ity-based regional flood frequency<br />
<strong>method</strong>s. J. Hydrol., In Press.<br />
PEKÁROVÁ P., KONÍČEK A. MIKLÁNEK P., 2005:<br />
Landuse impact on run<strong>of</strong>f regime in experimental microbasins<br />
<strong>of</strong> IH SAS. (In Slovak with English summary.)<br />
VEDA SAS, Bratislava, 216 pp..<br />
PETERSON B.J., HOLMES R.M., McCLELLAND J.W.,<br />
VOROSMARTY C.J., LAMMERS R.B., SHIKLO-<br />
MANOV A.I., SHIKLOMANOV I.A., RAHMSTORF S.,<br />
2002: Increasing river discharge to the Arctic Ocean. Science,<br />
298, 2171–2173.<br />
RAO A. R., HAMED K. H., 2000: Flood frequency <strong>analysis</strong>.<br />
CRC Press LLC, N.W. Corporate Blvd., Boca Raton,<br />
Florida.<br />
SHARMA R.H., SHAKYA N.M., 2006: Hydrological changes<br />
and its impact on water resources <strong>of</strong> Bagmati watershed,<br />
Nepal. J. Hydrol., 327, 315–322.<br />
SVOBODA A., PEKÁROVÁ P., 1998: Catastrophic flood <strong>of</strong><br />
July 1998 in the Malá Svinka catchment – its simulation. J.<br />
Hydrol. Hydromech., 46, 6, 356–372.<br />
VÖRÖSMARTY C.J., SAHAGIAN D., 2000: Anthropogenic<br />
disturbance <strong>of</strong> the terrestrial water cycle. Bioscience, 50,<br />
753–765.<br />
WALTER M.T., WILKS D.S., PARLANGE J.-Y., SCHNEI-<br />
DER R.L., 2004: Increasing evapotranspiration from the<br />
conterminous United States. J. Hydrometeorol., 5, 405–408.<br />
WERRITTY A., 2002: Living with uncertainty: climate<br />
change, river <strong>flows</strong> and water resources management in<br />
Scotland. The Sci. <strong>of</strong> the Total Environ., 294, 29–40.<br />
ZHANG X., HARVEY K.D., HOGG W.D., YUZYK T.R.,<br />
2001: Trends in Canadian stream flow. Wat. Resour. Res.,<br />
37, 987–998.<br />
ZHANG Q., LIU CH., XU CH., XU Y., JIANG T., 2006:<br />
Observed trends <strong>of</strong> annual maximum water level and<br />
streamflow during past 130 years in the Yangtze River basin,<br />
China. J. Hydrol., 324, 255–265.<br />
Received 11. August 2006<br />
Scientific paper accepted 7. December 2006<br />
VYUŽITIE METÓDY (POT) PRIETOKOV<br />
NAD ZVOLENOU PRAHOVOU HODNOTOU<br />
PRI ANALÝZE EXTRÉMNYCH<br />
SEZÓNNYCH PRIETOKOV<br />
Peter Bača, Veronika Bačová Mitková<br />
V súvislosti s klimatickými zmenami je väčšia pozornosť<br />
venovaná frekvencii výskytu extrémnych hydrologických<br />
situácií. Labat a kol. (2004) sa domnieva,<br />
že zvyšovanie odtoku z veľkých kontinentálnych riek<br />
počas rokov 1920–1995 poskytuje prvý dôkaz, ktorý<br />
demonštruje súvislosť medzi globálnym otepľovaním<br />
a intenzifikáciou globálneho hydrologického cyklu. Na<br />
zvýšenú frekvenciu výskytu extrémnych prietokov<br />
a zvyšovanie odtoku v rozdielnych regiónoch poukazujú<br />
viacerí autori (Foster a kol., 1997; Milly a kol., 2002;<br />
Peterson a kol., 2002; Werritty, 2002; Walter a kol.,<br />
2004; Micevski a kol., 2006).<br />
Podľa Zhanga a kol. (2006) nie je zvyšovanie frekvencie<br />
výskytu ročných maximálnych vodných stavov<br />
spôsobený jediným faktorom akým je klimatická zmena,<br />
ale komplexom faktorov, akými sú zmeny ľudských<br />
aktivít. Vörösmarty a Sahagian (2000) uvádzajú, že<br />
zvyšovanie odtoku môže byť pripísané napríklad<br />
odlesňovaniu. Naopak, znovu zalesňovanie poľnohospodárskych<br />
území môže znížiť hodnoty odtoku. Na<br />
druhej strane merané údaje nepoukazujú na zmeny alebo<br />
zvyšovanie veľkosti a frekvencie povodní (Aizen a kol.,<br />
1997; Zhang a kol., 2001; Holko a Kostka, 2005).<br />
Hoci klimatické zmeny sú globálnym problémom, ich<br />
vplyv a trendy sú rozdielne v závislosti od veľkosti<br />
územia. Analýzy by mali byť uskutočnené radšej<br />
v menšej ako vo veľkej mierke (Sharma a Shakya,<br />
2006). Náhle povodne (Flash floods) spôsobené<br />
prívalovými zrážkami sa vyskytli na Slovensku<br />
v posledných rokoch na malých povodiach (Grešková,<br />
2005). Výsledky, ktoré prezentujú Svoboda a Pekárová<br />
(1998) ukazujú, že, intenzívne zrážky v regióne Karpatského<br />
flyša, ktoré spadnú na malé povodie nasýtené<br />
predchádzajúcimi výdatnými zrážkami, môžu vyvolať<br />
povodeň s dobou opakovania 500 rokov.<br />
Najčastejšie sa pri pravdepodobnostných frekvenčných<br />
analýzach vychádza z maximálnych ročných<br />
prietokov. Uvažuje sa teda len s jednou hodnotou za rok.<br />
Takýto prístup nezahŕňa do analýz prietoky, svojou<br />
veľkosťou v roku druhé alebo tretie v poradí, ktoré môžu<br />
byť však väčšie ako maximálne prietoky v iných rokoch<br />
(Kite, 1977; Chow a kol., 1988).<br />
Preto je výhodné použiť metódu POT, pri ktorej sú do<br />
analýz zahrnuté všetky hodnoty prietokov nad zvolenú<br />
prahovú hodnotu (Bayliss, 1999; Rao a Hamed, 2000;<br />
21
P. Bača, V. Bačová Mitková<br />
Black a Burns, 2002; Ouarda a kol., 2006). Okrem toho<br />
umožňuje táto metóda identifikovať zmeny vo frekvencii<br />
výskytu extrémnych prietokov v rozdielnych sezónach<br />
roka.<br />
Cieľom príspevku bolo analyzovať zmeny vo frekvencii<br />
výskytu extrémnych hydrologických situácií na<br />
poľnohospodársky využívanom malom povodí Rybárik<br />
vo flyšovom pásme pri Považskej Bystrici v období 40-<br />
tich rokov 1964/65–2003/04. POT metóda bola aplikovaná<br />
zvlášť pre zimné a letné hydrologické polroky.<br />
Povodie Rybárik je súčasťou experimentálneho povodia<br />
potoka Mošteník, ktoré bolo založené ako Prírodné<br />
hydrologické laboratórium v roku 1958 a je časťou povodia<br />
rieky Váh, hlavného prítoku rieky Dunaj na území<br />
Slovenska. Územie potoka Mošteník patrí do<br />
Strážovskej vrchoviny, ktorú možno zaradiť do<br />
vrchovinnej a čiastočne stredohorskej oblasti Slovenska.<br />
Plocha povodia Rybárik je 0,12 km 2 s priemernou nadmorskou<br />
výškou 400 m n. m. (min 375 m n. m., max 434<br />
m n. m.). V povodí sa nachádza prameň potoka Jelšové,<br />
ktorého dĺžka po záverečný pr<strong>of</strong>il povodia je 255 m a<br />
priemerný sklon 9,1 %. Tvar povodia je výrazne vejárovitý,<br />
priemerný sklon povodia je 14,9 %. Z geologického<br />
pohľadu je povodie súčasťou flyšového<br />
pásma so striedajúcimi sa ílovými a pieskovcovými<br />
vrstvami. Pôdny druh je zastúpený ílovito-hlinitými<br />
pôdami a pôdny typ hnedozemou. Spôsob využívania<br />
krajiny je prevažne poľnohospodársky, len 10,4 %<br />
z celkovej rozlohy povodia je pokryté lesom. Priemerná<br />
ročná teplota je 8,09 °C, priemerný ročný úhrn zrážok je<br />
738 mm, priemerná ročná odtoková výška je 231<br />
mm/rok, bilančný výpar 507 mm a koeficient odtoku<br />
0,31 (za 40-ročné obdobie rokov 1965–2004).<br />
V záujmovom povodí Rybárik existuje v záverečnom<br />
pr<strong>of</strong>ile vybudovaný merný priepad s limnigrafom,<br />
určený na kontinuálny záznam vodného stavu. Pomocou<br />
merných kriviek prietokov získaných tarovaním bol<br />
vyhotovený kontinuálny záznam prietokov. Údaje<br />
získané za 40-ročné obdobie rokov 1965–2004 ukazujú,<br />
že vodný stav potoka Jelšové je väčšiu časť roka<br />
ustálený. Hodnoty prietokov vody sú nízke a pohybujú<br />
sa od 0,04 l s -1 do približne 0,5 l s -1 . K výraznému<br />
zvyšovaniu vodného stavu dochádza počas hydrologických<br />
situácií vyvolaných topením snehovej<br />
pokrývky (v zimných a jarných mesiacoch) a intenzívnymi<br />
zrážkami (vo vegetačnom období). Maximálne<br />
ročné kulminačné prietoky sa pohybujú od 10,9 l s -1 do<br />
364,2 l s -1 . Podrobnejšie informácie o režime odtoku<br />
podáva Pekárová a kol. (2005).<br />
Hoci boli vodné stavy merané kontinuálne, analyzované<br />
boli len priemerné denné hodnoty vzhľadom na<br />
chýbajúce archívne údaje o okamžitých vrcholových<br />
prietokoch. Kvôli lepšej homogenite údajov bola POT<br />
metóda aplikovaná zvlášť pre zimné a letné hydrologické<br />
polroky. Boli zvolené prahové hodnoty prietokov tak,<br />
aby sa prietoky nad prahovými hodnotami vyskytli<br />
v priemere 1.0-, resp. 0.2-krát za sezónu. Nezávislosť<br />
vybraných hodnôt priemerných denných prietokov bola<br />
zaistená nasledujúcimi kritériami:<br />
− hodnota vybraného priemerného denného prietoku je<br />
vyššia ako hodnoty v predchádzajúcom a nasledujúcom<br />
dni;<br />
− pre zimné polroky sa uvažovalo, že hodnoty priemerných<br />
denných prietokov sa v čase medzi dvoma<br />
prietokmi vybranými pre POT analýzy významne<br />
nemenili a boli nízke;<br />
− pre letné polroky, kedy je reakcia povodia na<br />
prívalové zrážky rýchla, bol zvolený časový interval<br />
medzi dvoma prietokmi vybranými pre POT analýzy<br />
prinajmenšom tri dni a minimálna hodnota priemerného<br />
denného prietoku v tomto čase bola nízka.<br />
Použitie priemerných denných hodnôt prietokov<br />
prináša so sebou určité neistoty. Kulminačné prietoky sa<br />
totiž nemusia vyskytovať v dňoch s najväčšími priemerným<br />
prietokomi (Linsley a kol., 1949).<br />
Výsledky na obr. 2 a 3 ukazujú, že frekvencia výskytu<br />
priemerných denných prietokov nad zvolenou vyššou<br />
prahovou hodnotou (0,2-krát za sezónu) klesla<br />
v posledných dvoch dekádach (1984/85–1993/94 a<br />
1994/95–2003/04). Najextrémnejšie hodnoty sa vyskytli<br />
v rokoch 1964/65–1973/74 (predovšetkým v letných<br />
polrokoch) a 1974/75–1983/84 (najmä počas topenia<br />
snehovej pokrývky). V prvom desaťročí sa počas letných<br />
prívalových vĺn, spôsobených intenzívnymi zrážkami<br />
vyskytli 4 najvyššie hodnoty denných prietokov za celé<br />
skúmané obdobie (obr. 4). Všeobecne sa však vyššie<br />
hodnoty priemerných denných prietokov objavujú<br />
v zimných polrokoch.<br />
Počas skúmaného obdobia 40-tich rokov nebolo povodie<br />
ovplyvnené významnými zmenami ľudskej činnosti,<br />
ktoré by mohli vyvolať zmenu vo frekvencii<br />
výskytu extrémnych hydrologických udalostí. Je preto<br />
nanajvýš pravdepodobné, že vplyv klimatických zmien<br />
na intenzifikáciu hydrologického cyklu, predpokladaný<br />
na severnej pologuli (Manabe a kol., 2004), nebol zatiaľ<br />
v skúmanom povodí Rybárik zaznamenaný. Podobné<br />
výsledky z horských povodí stredného Slovenska<br />
prinášajú aj Holko a Kostka (2005) a z vybraných povodí<br />
v Kanade Zhang a kol. ( 2001).<br />
22