analysis of seasonal extreme flows using peaks over threshold method
analysis of seasonal extreme flows using peaks over threshold method
analysis of seasonal extreme flows using peaks over threshold method

Create successful ePaper yourself
Turn your PDF publications into a flip-book with our unique Google optimized e-Paper software.
Analysis <strong>of</strong> <strong>seasonal</strong> <strong>extreme</strong> <strong>flows</strong> <strong>using</strong> Peaks <strong>over</strong> <strong>threshold</strong> <strong>method</strong><br />
− the value <strong>of</strong> mean daily discharge extracted is<br />
higher than the values on preceding day and next<br />
day;<br />
− for winter POT data it is considered that the values<br />
<strong>of</strong> mean daily discharge between two days on<br />
which POT data were recorded do not change<br />
significantly <strong>over</strong> time and remain low during<br />
a few days;<br />
− for summer POT data, when basin response to<br />
rainfall is fast, time interval between days on<br />
which POT data were recorded is three days at<br />
least and the values <strong>of</strong> mean daily discharge between<br />
two days on which POT data were recorded<br />
do not change significantly <strong>over</strong> time and<br />
remain low during a few days; minimum value <strong>of</strong><br />
mean daily discharge in this time interval is low.<br />
Results and discussion<br />
Time series plots have been used to reveal the<br />
temporal distribution <strong>of</strong> the values <strong>of</strong> mean daily<br />
discharge above the <strong>threshold</strong>s selected in two records.<br />
In winter seasons at the lower <strong>threshold</strong><br />
(68 l s -1 km -2 ), the frequency <strong>of</strong> occurrence <strong>of</strong> hydrological<br />
events caused by snow melting does not<br />
change remarkably in single decades (Fig. 2). The<br />
highest event frequency emerges in the 1974/75 –<br />
1983/84 decade. However, at the upper <strong>threshold</strong><br />
(156 l s -1 km -2 ) a contrast between the 1964/65–<br />
1983/84 and 1984/85 – 2003/04 periods is evident<br />
with the highest event frequency in the 1974/75 –<br />
1983/84 decade. Fig. 2. reveals that the most <strong>extreme</strong><br />
values <strong>of</strong> mean daily discharge occurred in<br />
the 1964/65 – 1983/84 period.<br />
In summer half years, event frequency varies<br />
markedly <strong>over</strong> decades at both <strong>threshold</strong>s (the<br />
lower one is 52 l s -1 km -2 and the upper one is 130<br />
l s -1 km -2 ) with more decreasing trends at the upper<br />
<strong>threshold</strong> (Fig. 3). The most <strong>extreme</strong> values <strong>of</strong><br />
mean daily discharge especially occurred in the<br />
1964/65 – 1973/74 decade, while in the 1974/75 –<br />
2003/04 period, the event frequency was very low.<br />
When both seasons are considered, on average,<br />
the 1964/65 – 1973/74 decade emerges as the decade<br />
with the highest event frequency (mostly in<br />
summer and less in winter) <strong>using</strong> data extracted<br />
above the upper <strong>threshold</strong>. High event frequency at<br />
the upper <strong>threshold</strong> also emerges in the 1974/75 –<br />
1983/84 decade (especially in winter). Comparison<br />
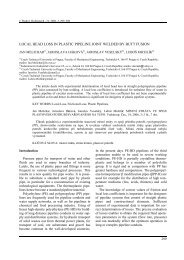
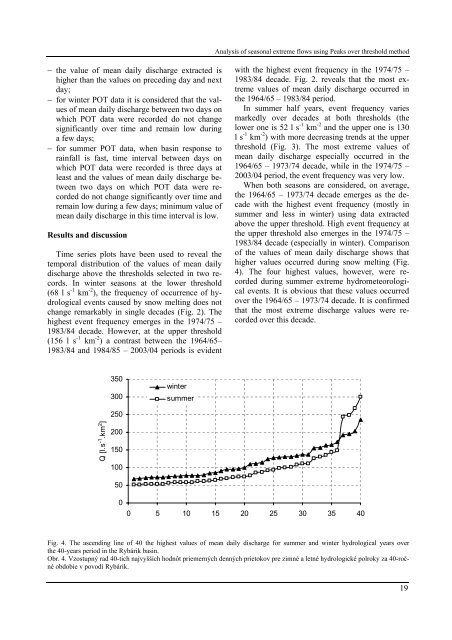
<strong>of</strong> the values <strong>of</strong> mean daily discharge shows that<br />
higher values occurred during snow melting (Fig.<br />
4). The four highest values, however, were recorded<br />
during summer <strong>extreme</strong> hydrometeorological<br />
events. It is obvious that these values occurred<br />
<strong>over</strong> the 1964/65 – 1973/74 decade. It is confirmed<br />
that the most <strong>extreme</strong> discharge values were recorded<br />
<strong>over</strong> this decade.<br />
350<br />
300<br />
winter<br />
summer<br />
250<br />
Q [l.s -1 .km 2 ]<br />
200<br />
150<br />
100<br />
50<br />
0<br />
0 5 10 15 20 25 30 35 40<br />
Fig. 4. The ascending line <strong>of</strong> 40 the highest values <strong>of</strong> mean daily discharge for summer and winter hydrological years <strong>over</strong><br />
the 40-years period in the Rybárik basin.<br />
Obr. 4. Vzostupný rad 40-tich najvyšších hodnôt priemerných denných prietokov pre zimné a letné hydrologické polroky za 40-ročné<br />
obdobie v povodí Rybárik.<br />
19