analysis of seasonal extreme flows using peaks over threshold method
analysis of seasonal extreme flows using peaks over threshold method
analysis of seasonal extreme flows using peaks over threshold method

You also want an ePaper? Increase the reach of your titles
YUMPU automatically turns print PDFs into web optimized ePapers that Google loves.
P. Bača, V. Bačová Mitková<br />
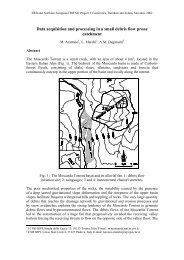
and longitude 18°24′E and 18°25′E. The Mošteník<br />
basin is a part <strong>of</strong> the Váh River catchment, which is<br />
the main tributary <strong>of</strong> the Danube River from the<br />
territory <strong>of</strong> Slovakia. The area <strong>of</strong> the Rybárik basin<br />
is 0.12 km 2 . The mean elevation <strong>of</strong> the basin is<br />
about 400 m a. s. l. (min 375 m a. s. l., max 434 m<br />
a. s. l.) with slope angles <strong>of</strong> 8 – 25%. Length <strong>of</strong> the<br />
Jelšové stream from the spring, which is found in<br />
the Rybárik basin, to the outlet section is 255 m and<br />
average gradient is 9.1%. The geological conditions<br />
in this micro-basin are characterized by flysh substrates<br />
(alternating layers <strong>of</strong> clay and sandstones).<br />
Soils are clay loams and are classified as Cambisols.<br />
The Rybárik basin is mainly arable, only<br />
10.4% <strong>of</strong> the area is c<strong>over</strong>ed by forest. Mean annual<br />
temperature is 8.09 °C, mean annual precipitation is<br />
738 mm and the run<strong>of</strong>f averages 231 mm year -1 .<br />
Water discharge data and <strong>method</strong>s<br />
Discharge is measured continuously by weir fitted<br />
with recording gauge. Water-level stage <strong>of</strong> the<br />
Jelšové stream is under steady state conditions during<br />
major period <strong>of</strong> the year. Discharge values are<br />
low and range between 0.04 – 0.5 l s -1 . However,<br />
water level increasing occurred during hydrological<br />
events resulted from snow melting (in winter and<br />
spring months) and from rainfall (mainly in summer<br />
months). Annual peak discharges range between<br />
10.9–364.2 l s -1 (<strong>over</strong> the period <strong>of</strong> 40 hydrological<br />
years 1964/65 – 2003/04) (Pekárová et al.,<br />
2005).<br />
Although discharge is measured continuously,<br />
due to lacking archival data (instantaneous peak<br />
discharges) only values <strong>of</strong> daily mean discharge<br />
were analysed. Two different <strong>peaks</strong> <strong>over</strong> <strong>threshold</strong><br />
(POT) records were created, one for winter halfyears,<br />
in which increases in <strong>flows</strong> are mostly<br />
caused by snow melting or combination <strong>of</strong> snow<br />
melting with rainfall, and one for summer halfyears,<br />
in which increases in <strong>flows</strong> results from intensive<br />
rainfall. This allowed detection <strong>of</strong> changes<br />
<strong>of</strong> occurrence frequency <strong>of</strong> POT data (mean daily<br />
discharge values) in different seasons and provided<br />
higher homogeneity <strong>of</strong> single POT records.<br />
For each record, POT data were extracted <strong>using</strong><br />
<strong>threshold</strong>s selected to give, on average, 1.0 and 0.2<br />
exceedances per season, respectively, <strong>over</strong> the 40-<br />
year period (1964/65 – 2003/04). Generally, flood<br />
frequency <strong>analysis</strong> considers only one value per<br />
year or season. However, application <strong>of</strong> such approach<br />
may mask years or decades when the most<br />
<strong>extreme</strong> values occurred. The value <strong>of</strong> upper<br />
<strong>threshold</strong> (0.2 exceedance per year) was selected to<br />
show in which decades the highest mean daily discharge<br />
values occurred. As shown in Figs 2 and 3<br />
selected value <strong>of</strong> the upper <strong>threshold</strong> emerges as<br />
satisfactory for this purpose. In order to provide<br />
independence <strong>of</strong> POT data the following criterions<br />
were used:<br />
[%]<br />
80<br />
70<br />
60<br />
50<br />
40<br />
30<br />
20<br />
10<br />
0<br />
POT 1<br />
POT 0,2<br />
1965-1974 1975-1984 1985-1994 1995-2004<br />
Fig. 2. Portion (in percentages) <strong>of</strong> mean daily discharge<br />
exceeding <strong>threshold</strong>s yielding, on average, 1.0 and 0.2 events<br />
per winter hydrological year in single decades <strong>over</strong><br />
the 40-years period in the Rybárik basin.<br />
Obr. 2. Percentuálny podiel priemerných denných prietokov<br />
nad zvolené prahové hodnoty, 1,0- resp. 0,2-krát v priemere za<br />
zimný hydrologický polrok v jednotlivých dekádach<br />
za 40-ročné obdobie v povodí Rybárik.<br />
[%]<br />
80<br />
70<br />
60<br />
50<br />
40<br />
30<br />
20<br />
10<br />
0<br />
POT 1<br />
POT 0,2<br />
1965-1974 1975-1984 1985-1994 1995-2004<br />
Fig. 3. Portion (in percentages) <strong>of</strong> mean daily discharge<br />
exceeding <strong>threshold</strong>s yielding, on average, 1.0 and 0.2 events<br />
per summer hydrological year in single decades <strong>over</strong><br />
the 40-years period in the Rybárik basin.<br />
Obr. 3. Percentuálny podiel priemerných denných prietokov<br />
nad zvolené prahové hodnoty, 1,0- resp. 0,2-krát v priemere za<br />
letný hydrologický polrok v jednotlivých dekádach za 40-ročné<br />
obdobie v povodí Rybárik.<br />
18