Here - Chicago Executive Airport
Here - Chicago Executive Airport
Here - Chicago Executive Airport

You also want an ePaper? Increase the reach of your titles
YUMPU automatically turns print PDFs into web optimized ePapers that Google loves.
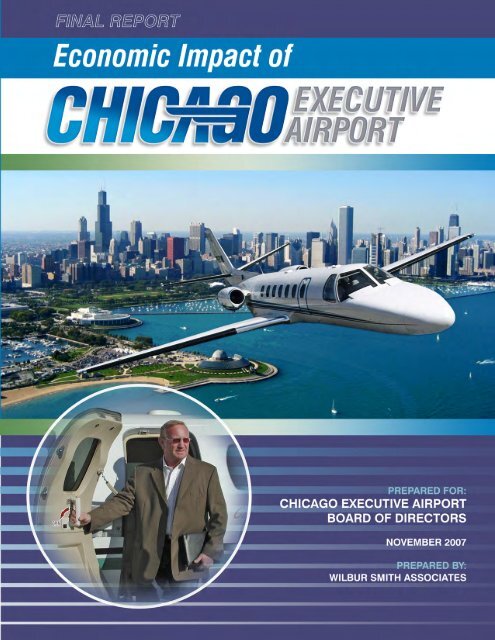
<strong>Chicago</strong> <strong>Executive</strong> <strong>Airport</strong> Economic Impact Study – 2007<br />
Page i<br />
Table of Contents<br />
Chapter 1 - Economic Impact Methodology ..........................................................................1-1<br />
1.1 Study Overview ..........................................................................................................1-1<br />
1.2 <strong>Airport</strong> Activities..........................................................................................................1-2<br />
1.3 Impact Analysis ..........................................................................................................1-3<br />
1.3.1 Direct Impacts..................................................................................................1-3<br />
1.3.2 Indirect Impacts ...............................................................................................1-5<br />
1.3.3 Multiplier and Total Impacts.............................................................................1-6<br />
1.4 Report Outline ............................................................................................................1-8<br />
Chapter 2 - Demographic & Economic Trends .....................................................................2-1<br />
2.1 Population ..................................................................................................................2-1<br />
2.2 Employment ...............................................................................................................2-2<br />
2.3 Income........................................................................................................................2-4<br />
2.4 Gross State Product...................................................................................................2-6<br />
Chapter 3 - <strong>Chicago</strong> <strong>Executive</strong> <strong>Airport</strong> Economic Impacts..................................................3-1<br />
3.1 Direct Impacts ............................................................................................................3-1<br />
3.2 Indirect Impacts..........................................................................................................3-3<br />
3.3 Multiplier and Total Impacts .......................................................................................3-5<br />
Chapter 4 - <strong>Airport</strong>-Related Tax Impacts ...............................................................................4-1<br />
4.1 Income Taxes.............................................................................................................4-1<br />
4.2 Personal Property Taxes and Registration Fees........................................................4-1<br />
4.3 Business Taxes..........................................................................................................4-2<br />
4.4 Total Taxes.................................................................................................................4-3<br />
Chapter 5 - Business User Impacts and Other Benefits.......................................................5-1<br />
5.1 Aviation-Dependent Industries ...................................................................................5-1<br />
5.2 Typical Value-Added Impacts.....................................................................................5-2<br />
5.2.1 Previous Study Business User Surveys ..........................................................5-3<br />
5.2.2 <strong>Chicago</strong> <strong>Executive</strong> <strong>Airport</strong> Business User Survey...........................................5-4<br />
5.3 Business Aviation at <strong>Chicago</strong> <strong>Executive</strong> <strong>Airport</strong>.........................................................5-4<br />
5.4 Other Qualitative Benefits ..........................................................................................5-5<br />
5.5 Business User Impacts and Other User Benefits Summary.......................................5-6<br />
Appendix<br />
Wilbur Smith Associates November 2007
<strong>Chicago</strong> <strong>Executive</strong> <strong>Airport</strong> Economic Impact Study– 2007<br />
Page ii<br />
Exhibits<br />
No. Title Page<br />
1-1 <strong>Airport</strong> Location ..............................................................................................................1-2<br />
1-2 Based Aircraft and Aircraft Operations by <strong>Airport</strong> ..........................................................1-2<br />
1-3 Economic Impact Types.................................................................................................1-3<br />
1-4 <strong>Airport</strong> Tenants and Through-the-Fence-Operators.......................................................1-5<br />
1-5 Components of Economic Impact Types .......................................................................1-6<br />
1-6 Economic Impact Types and Measures .........................................................................1-8<br />
2-1 Historical Population Trends, 1970-2006 .......................................................................2-1<br />
2-2 Forecasted Population Trends .......................................................................................2-2<br />
2-3 Industry Employment, 2006 ..........................................................................................2-3<br />
2-4 Industrial Location Quotient Based on Employment, 2006 ............................................2-4<br />
2-5 Industry Average Earnings, 2006...................................................................................2-5<br />
2-6 Mean Household Income ...............................................................................................2-5<br />
2-7 Illinois Gross State Product by Industry .........................................................................2-6<br />
3-1 Economic Impact Summary ...........................................................................................3-1<br />
3-2 Direct Economic Impacts ...............................................................................................3-2<br />
3-3 Indirect General Aviation Visitor Impacts .......................................................................3-4<br />
3-4 Impact Breakdown by Measure and Type......................................................................3-5<br />
4-1 Real Property Tax Assessed Value and Amount Paid...................................................4-2<br />
4-2 Business Taxes by Type ................................................................................................4-3<br />
4-3 Total Taxes by Type.......................................................................................................4-3<br />
5-1 Business Location Factors and GA Business Use.........................................................5-3<br />
5-2 Business User Survey Firm Characteristics...................................................................5-4<br />
5-3 Qualitative Activity Benefits............................................................................................5-6<br />
Wilbur Smith Associates November 2007
<strong>Chicago</strong> <strong>Executive</strong> <strong>Airport</strong> Economic Impact Study–2007 Page 1-1<br />
Chapter 1 - Economic Impact Methodology<br />
The economic impact of the <strong>Chicago</strong> <strong>Executive</strong> <strong>Airport</strong> is calculated using a methodology that<br />
evolved over the past two decades and is nationally recognized as the standard for conducting<br />
economic impact studies of airports. The methodology is consistent with that advocated by the<br />
Federal Aviation Administration (FAA), and explicitly follows the FAA-suggested procedures. 1<br />
The study also uses the IMPLAN input/output model with multipliers specific to the Cook and<br />
Lake County, Illinois.<br />
The study methodology is an "impact" approach rather than a "transportation benefits"<br />
approach. Therefore, the study does not explore the efficiencies, the productivity, or the travel<br />
benefits from, air travel. Rather, it measures the importance of the airport as an industry, in<br />
terms of the employment and earnings it generates, and the locally produced goods and<br />
services which it consumes. All impacts are expressed in annual terms, with all impact<br />
calculations based on the latest year for which data are available (generally for the year 2007).<br />
1.1 Study Overview<br />
<strong>Chicago</strong> <strong>Executive</strong> <strong>Airport</strong> serves the general and business aviation sector. With approximately<br />
300 based aircraft and over 100,000 aircraft operations annually, <strong>Chicago</strong> <strong>Executive</strong> is the third<br />
busiest airport in the <strong>Chicago</strong> area, after O'Hare International and Midway. Originally a modest<br />
grass strip created by an early aviation enthusiast, the airport was known as Gauthier's Flying<br />
Field in the early 1920’s. In the 1928, the field was renamed Pal-Waukee, after the two highways<br />
that formed its southern and eastern boarders. The airport was purchased in 1953 by George<br />
Priester who expanded the facility until it was purchased by the Village of Wheeling and the City of<br />
Prospect Heights with FAA and State funding in 1986. Renamed <strong>Chicago</strong> <strong>Executive</strong> <strong>Airport</strong> in<br />
2006, to more accurately reflect its regional importance, the facility now covers over 400 acres<br />
and is a key building block and powerful economic engine for both communities as well as the<br />
surrounding area.<br />
This study was sponsored by the <strong>Chicago</strong> <strong>Executive</strong> <strong>Airport</strong> with the purpose of developing an<br />
unbiased, thorough quantification of the airport’s economic impact on the airport’s service region.<br />
To do so, the airport operator and tenants were surveyed regarding number of people employed<br />
and typical annual operating expenditures. Further, corporate users were identified to understand<br />
nature and magnitude of major corporate users who depend on the airport. The airport location is<br />
shown on the map in Exhibit 1-1. Lastly, this report also provides estimates of state and local tax<br />
collections associated with airport activity.<br />
1 “Estimating the Regional Economic Significance of <strong>Airport</strong>s,” Federal Aviation Administration, Washington, DC, 1992.<br />
Wilbur Smith Associates November 2007
<strong>Chicago</strong> <strong>Executive</strong> <strong>Airport</strong> Economic Impact Study–2007 Page 1-2<br />
Exhibit 1-1<br />
<strong>Airport</strong> Location<br />
<strong>Chicago</strong> <strong>Executive</strong> <strong>Airport</strong> Economic Impact Study<br />
Source: www.chiexec.com<br />
1.2 <strong>Airport</strong> Activities<br />
<strong>Chicago</strong> <strong>Executive</strong> <strong>Airport</strong> is a major general aviation airport catering to the corporate aviation<br />
user. In doing so, the airport alleviates the demand for corporate activity at O’Hare International<br />
by providing quick, efficient airside and groundside access. The associated 112,911 annual<br />
aircraft operations and the 294 based aircraft are presented by type in Exhibit 1-2.<br />
Exhibit 1-2<br />
Based Aircraft and Aircraft Operations – 2007<br />
<strong>Chicago</strong> <strong>Executive</strong> <strong>Airport</strong> Economic Impact Study<br />
Aircraft Operations<br />
Based Aircraft<br />
Type Number Type Number<br />
Air Taxi 12,126 Single Engine 192<br />
Itinerant 75,336 Multi-Engine 45<br />
G.A. Local 25,410 Jet 52<br />
Military 39 Helicopter 5<br />
Total Operations 112,911 Total Aircraft 294<br />
Source: <strong>Chicago</strong> <strong>Executive</strong> <strong>Airport</strong><br />
Wilbur Smith Associates November 2007
<strong>Chicago</strong> <strong>Executive</strong> <strong>Airport</strong> Economic Impact Study–2007 Page 1-3<br />
1.3 Impact Analysis<br />
The airport economic impacts associated with <strong>Chicago</strong> <strong>Executive</strong> <strong>Airport</strong> are generated in three<br />
ways: Direct, Indirect, and Multiplier Impacts. Combined, the three impact types yield an airport’s<br />
total economic impact, as shown in Exhibit 1-3. The following discussion describes these impact<br />
types and how they are calculated. In addition, the discussion describes the three impact<br />
measures – jobs, earnings and economic activity.<br />
Exhibit 1-3<br />
Economic Impact Types<br />
<strong>Chicago</strong> <strong>Executive</strong> <strong>Airport</strong> Economic Impact Study<br />
+<br />
Direct Impacts<br />
+<br />
+<br />
Indirect Impacts<br />
Multiplier Impacts<br />
=<br />
Total Impacts<br />
1.3.1 Direct Impacts<br />
The "Direct" impacts include local expenditures at or near an airport by firms involved in the<br />
provision of aviation services, such as the airlines, fixed-base operators, aviation component<br />
manufacturing firms, flight and ground schools, the control tower, etc. The direct impacts<br />
associated with the provision of aviation services consist of three general classifications:<br />
1. Direct Payroll – The annual gross payroll for any employed person at the airport whose job<br />
is attributable to the tenant firm. When possible these figures also include payroll taxes,<br />
unemployment insurance and other related payroll expenses.<br />
2. Capital Expenditures – Investment at or near the airport by either the airport operator or by<br />
the airport's public and private tenants associated with buildings, structures, runway<br />
improvements, terminals, etc. Since capital expenditures fluctuate significantly by year, a<br />
ten-year average is used. Aircraft purchases, however, are excluded since they are not<br />
manufactured locally and represent little, if any, local impacts.<br />
3. Operating Expenses – The annual operation costs of the airport operator, businesses,<br />
tenants and agencies at the airport. These costs include utilities, repair, maintenance,<br />
supplies, legal and professional services, etc. Operation expenses made by one entity at<br />
the airport to another airport entity are excluded. For example, tenant rent, leases, fees,<br />
etc. made to the airport operator are excluded, because these operator revenues are paid<br />
Wilbur Smith Associates November 2007
<strong>Chicago</strong> <strong>Executive</strong> <strong>Airport</strong> Economic Impact Study–2007 Page 1-4<br />
out to operator employees and other operator expenses. To include such expenditures<br />
under both the tenant and the airport operator would be to “double-count” the<br />
expenditures.<br />
Calculation of the "direct" impacts comprises a four-step process:<br />
1. <strong>Airport</strong> Operator Data Request – Background information from the <strong>Airport</strong> was obtained<br />
regarding capital expenditures, aircraft operations, etc. In addition, a tenant listing – both<br />
on-airport and through-the-fence operation was obtained including contact name, address<br />
and phone number. <strong>Airport</strong> operator information concerning jobs, revenues and<br />
expenditures also was obtained, as was financial operating data included information<br />
regarding revenues, expenses, and rents, fees and taxes paid by airport tenants.<br />
2. <strong>Airport</strong> Surveys – With the information provided by the <strong>Airport</strong>, a list was developed of<br />
airport tenants. Surveys were developed and either mailed out or distributed in person to<br />
all tenants and related firms. The surveys requested information on employment,<br />
operations, revenue, and expenditures. A copy of the survey form and letter of<br />
introduction is presented in the Appendix.<br />
3. <strong>Airport</strong> Visits – The Consultant also visited the <strong>Airport</strong>, interviewing the airport operator<br />
and tenants. Previously collected information was verified and missing information was<br />
collected. This provided insight into the <strong>Airport</strong>'s overall operation, layout, and the<br />
economic roles, which the various entities play.<br />
4. Direct Impact Calculations – The collected data was verified to check reasonableness,<br />
e.g., payroll per employed person, etc. In doing so, the impacts were compared to<br />
benchmarks established through other airport impact studies.<br />
Tenant List – A list of all aviation-related tenants and through-the-fence operators evaluated in<br />
the analysis is presented in Exhibit 1-4. All of the on-airport aviation tenants responded to the<br />
survey or were interviewed, as did all but three of the through-the-fence aviation-oriented<br />
businesses. Conversely, corporate operators are often reluctant to participate in impact<br />
surveys. At <strong>Chicago</strong> <strong>Executive</strong> this was also witnessed to some degree, especially from smaller<br />
operators. However, the larger operators were quite responsive and helpful in gaining insight to<br />
the relative size and nature of non-responding corporate tenants and general airport impacts.<br />
<strong>Airport</strong> data on jet and piston aircraft by corporate operator also provided another useful tool<br />
used to estimate the impact of non-responding corporate operators. Combined, the different<br />
perspectives of the major corporate operators and the airport management representatives,<br />
combined with the extensive airport data provided a sound basis for generating a<br />
comprehensive understanding of the direct impacts associated with firms located at the airport<br />
as well as the indirect visitor impacts associated with airport operations.<br />
Wilbur Smith Associates November 2007
<strong>Chicago</strong> <strong>Executive</strong> <strong>Airport</strong> Economic Impact Study–2007 Page 1-5<br />
Exhibit 1-4<br />
<strong>Airport</strong> Tenants and Through-the-Fence-Operators<br />
<strong>Chicago</strong> <strong>Executive</strong> <strong>Airport</strong> Economic Impact Study<br />
Aviaton<br />
Corporate<br />
On-<strong>Airport</strong> Tenants<br />
<strong>Chicago</strong> <strong>Executive</strong> <strong>Airport</strong> Gov't C.F. Industries<br />
FAA (Control Tower) Gov't Maranatha Ministries<br />
U.S. Customs Gov't Newberg<br />
Signature Flight Support FBO Potomac<br />
Atlantic Aviation FBO Lake Capital<br />
Northern Illinois Flight Center Air Taxi PAS-Keller Systems<br />
Preister Aviation Air Taxi Klein Tools<br />
Windy City Flyers Air Taxi/Training Woodhill<br />
American Flyers Training CED<br />
Boram Aviation Training Allmetal<br />
Palwaukee Flyers Training SG III<br />
<strong>Chicago</strong> <strong>Executive</strong> Srv. Center Maint Indeck/IPOII<br />
North American Jet Maint. Maint/Air Taxi EJM<br />
Duncan Aviation Maint DS Advisors<br />
Landmark Aviation Maint Alpha Mike Aviation<br />
Hertz Car J&S Aviation<br />
Flight World Limited Flying Club MMA Investments<br />
Paragon Flying Club Flying Club McLennan Companies<br />
20 Other Corporate @ Atlantic Aviation<br />
Off-<strong>Airport</strong> Firms and Through-the-Fence Operators<br />
Great Bear Aviation Air Taxi Alberto Culver<br />
Propeller Service, Inc. Maint Allstate<br />
Avis Car Duchossois<br />
Enterprise Car Henry Crown (Including HSBC)<br />
T.C. Becks Catering JCG Aviation<br />
Georgies Catering McClean Fogg<br />
94th Aero Squadron Restaurant Motorola<br />
Phil Young<br />
Redleaf Management<br />
1.3.2 Indirect Impacts<br />
"Indirect" impacts reflect expenditures made by airport users in the impact area. These typically<br />
consist of expenditures by visitors at hotels, restaurants, etc. General aviation visitor expenditures<br />
were calculated in a manner consistent with the methodology advocated by the Aircraft Owners<br />
and Pilot Association (AOPA). The methodology estimates the number of visitors arriving at the<br />
airport and multiplies the number of visitors by an estimated average expenditure rate per visitor.<br />
Visitors are defined as persons who reside in places external to the airport's region of impact who<br />
arrive via <strong>Chicago</strong> <strong>Executive</strong> <strong>Airport</strong>. The average expenditure per visitor (e.g., lodging, food,<br />
retail etc.), persons per party and average length of stay, were compiled from a transient pilot<br />
survey, discussions with airport management, corporate tenants, fixed-base-operators and from<br />
Wilbur Smith Associates November 2007
<strong>Chicago</strong> <strong>Executive</strong> <strong>Airport</strong> Economic Impact Study–2007 Page 1-6<br />
previous studies. The <strong>Airport</strong> provided information on registered aircraft operations as well as<br />
insight on the estimated share of itinerant and air taxi aircraft operations conducted by local<br />
residents versus regional visitors.<br />
1.3.3 Multiplier and Total Impacts<br />
The primary direct and indirect economic impacts represent increases in final demand in the<br />
airport impact areas. Such final demand increases, however, do not represent the total<br />
economic impact value attributable to an airport. Rather, a secondary or multiplier impact also<br />
occurs. The components of these three impact types are shown in Exhibit 1-5. The secondary<br />
multiplier effect is measured using IMPLAN 2 multiplier coefficients for the primary impact areas,<br />
(i.e., Cook and Lake Counties). These multipliers are based on the U.S. Regional Input/Output<br />
tables, as developed by the U.S. Department of Commerce, Bureau of Economic Analysis.<br />
Exhibit 1-5<br />
Components of Economic Impact Types<br />
<strong>Chicago</strong> <strong>Executive</strong> <strong>Airport</strong> Economic Impact Study<br />
Aircraft Services<br />
<strong>Airport</strong> Mgmt & Oper.<br />
Air Taxi/Charter<br />
Car Rental Agencies<br />
Corporate Flight Ops.<br />
Fixed-base Operator<br />
Government Oper.<br />
Other Tenants/Users<br />
DIRECT<br />
IMPACTS<br />
INDIRECT<br />
IMPACTS<br />
General Aviation Visitors<br />
Corporate Aviation Visitors<br />
MULTIPLIER<br />
IMPACTS<br />
Intermediate Suppliers<br />
Induced Expenditures<br />
TOTAL<br />
IMPACTS<br />
Economic Activity<br />
Earnings<br />
Jobs<br />
2 The Minnesota Implan Group’s Regional Input Output Modeling System (IMPLAN)<br />
Wilbur Smith Associates November 2007
<strong>Chicago</strong> <strong>Executive</strong> <strong>Airport</strong> Economic Impact Study–2007 Page 1-7<br />
Multipliers trace money flows through a regional economy. The longer money circulates in the<br />
region, the better-off the region is and the higher the multiplier. The multiplier exemplifies, through<br />
supplier expenditures and the respending of earnings, that many people and businesses benefit,<br />
even those who do not use or directly serve the airports.<br />
For example, if an airline employee earns $100 at the airport, and uses it to buy $100 worth of<br />
groceries, he is better off by $100 because he has $100 worth of groceries, and the local grocer is<br />
better off because he has the $100. The grocer then pays his employees, the delivery truck<br />
operator, etc. all of whom then are slightly better off due to the airport. The multiplier traces this<br />
flow of funds until the money ultimately leaks to places outside the impact area, or reaches the<br />
source of its raw material. Therefore, the larger and more developed the impact area, the longer<br />
the money remains in the regional economy, resulting in a higher average multiplier.<br />
Secondary Multiplier Model – To estimate the multipliers, The Minnesota Implan Group’s Regional<br />
Input-Output Modeling System (IMPLAN) is used. Final demand expenditures (i.e., primary direct<br />
and indirect impact values) are categorized into industrial codes and applied to a variety of<br />
different multiplier classifications, depending on the nature of the final demand activities. The size<br />
of the multipliers varies depending on the study area’s size (population) and economic base.<br />
Typically, the larger and more developed the impact area, the longer the money re-circulates in<br />
the regional economy, resulting in a higher multiplier. For this study, multipliers for the Illinois<br />
Counties of Cook and Lake are used.<br />
Three Measures of "Economic Impact" – The IMPLAN model provides three measures of the<br />
total economic impact attributable to the airports: Economic Activity (Output), Earnings (Payroll),<br />
and Jobs. The total impacts include the aviation sector itself (i.e. the "direct and indirect<br />
impacts"), as well as the "multiplier effect" of the aviation sector. The impacts are estimated for<br />
the Year 2007. All three indicators of economic impact are useful, however the monetary<br />
measures should not be added together, as explained below:<br />
• Economic Activity – The value of the aviation primary expenditures (aviation or airport<br />
service), plus the secondary multiplier effect (the sum of all of the intermediate goods and<br />
services needed to provide aviation services, plus the induced impacts of increased<br />
household consumption). Total economic activity equals the sum of intermediate demand,<br />
consumption demand, government demand, investment demand, and net export demand.<br />
Because Economic Activity includes intermediate demand it should not be compared to<br />
Gross State Product.<br />
• Earnings – The primary and secondary wages and salaries, other labor income and<br />
proprietors’ income paid to all employed persons that deliver final demand output and<br />
services. Earnings Impacts are part of Economic Activity, so they should not be added to<br />
the Economic Activity impact.<br />
• Jobs – The number of employees who provide aviation service or manufacture aircraft,<br />
plus the aviation-oriented share of those that are employed in sectors that support the air<br />
passenger (hotels, restaurants, etc.), plus those employed in the industries included in the<br />
Wilbur Smith Associates November 2007
<strong>Chicago</strong> <strong>Executive</strong> <strong>Airport</strong> Economic Impact Study–2007 Page 1-8<br />
multiplier effect impacts. Jobs are expressed in terms of annual “full-time-equivalents”<br />
(FTEs), where two part-time jobs are represented as one full-time job.<br />
These three impact "measures" and the three impact "types" explained earlier are<br />
inter-related. Specifically. the economic activity, earnings and job impact measures comprise<br />
direct, indirect, and multiplier impact types. The interaction of the three impact measures<br />
and their three impact types are presented below in Exhibit 1-6. The total economic activity,<br />
earnings and jobs impact measures presented in Chapter 3 comprises these three impact<br />
types.<br />
Exhibit 1-6<br />
Economic Impact Types and Measures<br />
<strong>Chicago</strong> <strong>Executive</strong> <strong>Airport</strong> Economic Impact Study<br />
Impact Measures<br />
Economic<br />
Activity Earnings Jobs<br />
Direct Impacts<br />
Indirect Impacts<br />
Multiplier Impacts<br />
T o t a l I m p a c t s<br />
Impact Types<br />
1.4 Report Outline<br />
Background demographics and economic trends for the Illinois are first summarized in Chapter 2.<br />
The <strong>Chicago</strong> <strong>Executive</strong> <strong>Airport</strong> economic impacts are described in Chapter 3. Chapter 4<br />
summarizes the local and state-related tax impacts associated with the <strong>Airport</strong>. Lastly, Chapter 5<br />
addresses the nature and magnitude of the businesses that depend on the airport for<br />
transportation.<br />
Wilbur Smith Associates November 2007
<strong>Chicago</strong> <strong>Executive</strong> <strong>Airport</strong> Economic Impact Study–2007 Page 2-1<br />
Chapter 2 - Demographic & Economic Trends<br />
Various industries in the State of Illinois, and specifically within the greater <strong>Chicago</strong> area, are<br />
dependent on air transportation for the sustainability of current operations and for expanding<br />
market access to customers, suppliers, and business collaborations. Air transportation enables<br />
industries and specific companies to become and remain competitive in an economic<br />
environment that persistently compels an increasingly quicker and more efficient exchange of<br />
goods, services, and ideas. This section summarizes recent trends in population, current<br />
employment, and household income levels. This data provides the context from which to<br />
compare the airport economic impact findings presented in the subsequent sections.<br />
2.1 Population<br />
Cook County is, by far, the largest populated county in the State of Illinois and the second<br />
largest populated county in the United States, next only to Los Angeles County, California. In<br />
fact, with nearly 5.3 million people in 2006, Cook County has a population greater than the<br />
population of 31 states. 3 <strong>Chicago</strong> is located within the entirety of Cook County and contributes<br />
to the large population. However, Cook County population declined slightly (3.7%) from about<br />
5.49 million in 1970 to 5.29 million in 2006, as shown in Exhibit 2-1. Conversely, Lake County,<br />
Illinois, which is located between the borders of Cook County and the State of Wisconsin, nearly<br />
doubled over the same historical time period, growing from about 382,000 to 713,000 people.<br />
Exhibit 2-1<br />
Historical Population Trends (1970 to 2006)<br />
<strong>Chicago</strong> <strong>Executive</strong> <strong>Airport</strong> Economic Impact Study<br />
Population Year<br />
Change<br />
Geography 1970 1980 1990 2000 2006 1970-2006<br />
Study Area<br />
Cook County 5,493,766 5,253,628 5,105,067 5,376,741 5,288,655 -3.7%<br />
Lake County 382,638 440,388 516,418 644,356 713,076 86.4%<br />
Subtotal 5,876,404 5,694,016 5,621,485 6,021,097 6,001,731 2.1%<br />
State of Illinois 11,110,285 11,427,409 11,430,602 12,419,293 12,831,970 15.5%<br />
Source: 1990 Census of Population and Housing, Population and Housing Unit Counts, and 2000 Census<br />
Between 2000 and 2030, population in the Cook-Lake County study area is expected to grow, in<br />
nearly 14% while the State of Illinois is expected to grow at almost 22%, as shown in Exhibit 2-<br />
2. Lake County is expected to grow more quickly than Cook County and Illinois, due lack of<br />
physical room for expansion due to high population density.<br />
3 US Census Bureau: Annual Estimates of the Population for the United States, Regions, and States and<br />
for Puerto Rico: April 1, 2000 to July 1, 2006<br />
Wilbur Smith Associates November 2007
<strong>Chicago</strong> <strong>Executive</strong> <strong>Airport</strong> Economic Impact Study–2007 Page 2-2<br />
Exhibit 2-2<br />
Forecasted Population Trends (1970 to 2006)<br />
<strong>Chicago</strong> <strong>Executive</strong> <strong>Airport</strong> Economic Impact Study<br />
Population Year<br />
Change<br />
Geography 2000 2010 2020 2030 2000-2030<br />
Study Area<br />
Cook County 5,386,673 5,472,429 5,707,832 5,990,243 11%<br />
Lake County 645,503 762,918 820,250 873,024 35%<br />
Subtotal 6,032,176 6,235,347 6,528,082 6,863,267 14%<br />
State of Illinois 12,440,846 13,279,091 14,316,487 15,138,849 22%<br />
Source: Illinois Dept. of Commerce and Economic Opportunity; Business Assistance, Facts & Figures, Population Projections<br />
2.2 Employment<br />
The study area employed 2.5 million in year 2006, half of all private sector employees in the<br />
State of Illinois, as shown in Exhibit 2-3. Major study area industries include health care and<br />
social assistance, manufacturing, and retail trade.<br />
Industry Concentration – Location quotient is a measure of the relative industrial concentration<br />
of a specific geographic or economic region in comparison to a broader base geographic or<br />
economic region. It is calculated as the ratio of a specific industry’s share of the local economy<br />
to the respective industry’s share of the base economy typically calculated by the number of<br />
persons employed in the specified industry to total employment within the economy. An<br />
industry with a location quotient less than 1 has a share of the local economy proportionally<br />
smaller to the same industry share in the base economy, indicating that the local economy is a<br />
net importer of the goods and services of that industry from the base economy. An industry with<br />
a location quotient greater than 1 has a share of the local economy proportionally larger than<br />
the same industry share in the base economy. A location quotient greater than one indicates<br />
that the local production of an industry generally exceeds the local demand for the goods and<br />
services of that industry (given the assumption that the demand for the goods and services of<br />
that industry in proportion to the entire economy are the same at both the local and base<br />
geographic area) allowing the excess production to be exported to the geographic or economic<br />
base area.<br />
Wilbur Smith Associates November 2007
<strong>Chicago</strong> <strong>Executive</strong> <strong>Airport</strong> Economic Impact Study–2007 Page 2-3<br />
Exhibit 2-3<br />
Industry Employment (2006)<br />
<strong>Chicago</strong> <strong>Executive</strong> <strong>Airport</strong> Economic Impact Study<br />
Study Area<br />
State of<br />
Industry Cook Lake Subtotal Illinois<br />
Total Private Sector 2,224,051 289,669 2,513,719 5,021,458<br />
Agriculture, Forestry, Fishing & Hunting 553 na 553 15,877<br />
Mining 919 na 919 10,156<br />
Construction 96,864 17,982 114,846 278,318<br />
Manufacturing 245,100 50,083 295,183 683,877<br />
Wholesale Trade 115,911 21,971 137,882 308,803<br />
Retail Trade 239,224 42,891 282,115 623,426<br />
Transportation & Warehousing 117,557 4,708 122,265 221,684<br />
Utilities 4,109 469 4,578 23,080<br />
Information 59,172 4,520 63,692 116,638<br />
Finance & Insurance 171,131 17,057 188,188 314,484<br />
Real Estate & Rental & Leasing 48,102 4,043 52,145 85,076<br />
Professional, Scientific & Technical Services 201,035 21,703 222,738 358,157<br />
Management of Companies & Enterprises 46,966 7,725 54,690 94,776<br />
Administrative & Waste Services 186,100 25,799 211,899 403,551<br />
Educational Services 70,905 5,699 76,604 115,220<br />
Health Care & Social Assistance 290,062 26,928 316,990 635,840<br />
Arts, Entertainment & Recreation 34,979 7,568 42,547 83,071<br />
Accommodations & Food Services 196,626 21,562 218,188 445,708<br />
Other Services 94,829 8,670 103,499 196,729<br />
Unclassified 3,905 291 4,196 6,988<br />
Source: Illinois Department of Employment Security: LMI Source, Quarterly Census of Employment and Wages (ES 202)<br />
Exhibit 2-4 depicts the industrial location quotient for the study area and is sorted by<br />
decreasing industrial concentrations. Service industries are heavily concentrated in the study<br />
area as educational services, professional, scientific, and technical services, financial and<br />
insurance services, information services, other services, and administrative and waste services<br />
all have location quotients greater than 1, at 1.33, 1.24, 1.20, 1.09, 1.05, and 1.05, respectively.<br />
Real estate, company management, transportation and warehousing, and arts, entertainment,<br />
and recreation industries are also concentrated industries in the study area relative to Illinois.<br />
Those three industries that are very ill concentrated in the two counties study area are the<br />
utilities, mining, and agricultural, forestry, and fishing industries.<br />
Wilbur Smith Associates November 2007
<strong>Chicago</strong> <strong>Executive</strong> <strong>Airport</strong> Economic Impact Study–2007 Page 2-4<br />
Exhibit 2-4<br />
Industrial Location Quotient based on Employment (2006)<br />
<strong>Chicago</strong> <strong>Executive</strong> <strong>Airport</strong> Economic Impact Study<br />
Study Area<br />
Industry Cook Lake Subtotal<br />
Educational Services 1.39 0.86 1.33<br />
Professional, Scientific & Technical Services 1.27 1.05 1.24<br />
Real Estate & Rental & Leasing 1.28 0.82 1.22<br />
Unclassified 1.26 0.72 1.20<br />
Finance & Insurance 1.23 0.94 1.20<br />
Management of Companies & Enterprises 1.12 1.41 1.15<br />
Transportation & Warehousing 1.20 0.37 1.10<br />
Information 1.15 0.67 1.09<br />
Other Services 1.09 0.76 1.05<br />
Administrative & Waste Services 1.04 1.11 1.05<br />
Arts, Entertainment & Recreation 0.95 1.58 1.02<br />
Health Care & Social Assistance 1.03 0.73 1.00<br />
Accommodations & Food Services 1.00 0.84 0.98<br />
Retail Trade 0.87 1.19 0.90<br />
Wholesale Trade 0.85 1.23 0.89<br />
Manufacturing 0.81 1.27 0.86<br />
Construction 0.79 1.12 0.82<br />
Utilities 0.40 0.35 0.40<br />
Mining 0.20 na 0.18<br />
Agriculture, Forestry, Fishing & Hunting 0.08 na 0.07<br />
Source: Illinois Dept. of Employment Security: LMI Source, Quarterly Census of Employment and Wages (ES 202)<br />
Unemployment Rate – The annual average adjusted unemployment rates for the United States<br />
was 4.6% in 2006. Illinois unemployment rate of 4.5% is just slightly below the national rate.<br />
Lake County’s unemployment rate of 4.2% is below both the national and state unemployment<br />
rates, and Cook County’s at 4.7% is slightly higher. Weighted more heavily by greater<br />
employment in Cook County than Lake County, the two counties study area exhibited a 4.6%<br />
rate, equal to the national rate and slightly higher than the state rate.<br />
2.3 Income<br />
Average earnings, by industry in year 2006, are higher within the two county study area than in<br />
the State of Illinois as a whole for all industries with the exception of farming, see Exhibit 2-5.<br />
Total average earnings across all industries are just over $60,500 and $51,100, respectively.<br />
Wilbur Smith Associates November 2007
<strong>Chicago</strong> <strong>Executive</strong> <strong>Airport</strong> Economic Impact Study–2007 Page 2-5<br />
Exhibit 2-5<br />
Industry Average Earnings (2006$)<br />
<strong>Chicago</strong> <strong>Executive</strong> <strong>Airport</strong> Economic Impact Study<br />
Study Area<br />
State of<br />
Industry Cook Lake Subtotal Illinois<br />
Total Average Earnings $60,500 $60,700 $60,500 $51,900<br />
Farm 11,300 15,900 13,700 16,300<br />
Agricultural Services, Other 26,900 33,300 29,100 25,500<br />
Mining 107,400 65,700 98,200 78,000<br />
Construction 74,200 60,700 72,100 61,700<br />
Manufacturing 85,900 98,300 87,800 76,800<br />
Transport, Comm. And Public Utilities 68,600 66,900 68,500 65,900<br />
Wholesale Trade 78,600 103,600 83,100 73,100<br />
Retail Trade 27,600 32,400 28,300 24,800<br />
Finance, Insurance, and Real Estate 83,700 65,700 81,700 64,800<br />
Services 53,500 49,000 53,000 46,300<br />
Federal Civilian Govt 93,800 86,000 92,900 89,700<br />
Federal Military Govt 43,600 66,100 58,000 57,300<br />
State and Local Govt 61,900 56,300 61,300 53,900<br />
Source: Woods & Poole Economics, Inc., 2006<br />
Illinois exhibits higher mean household income than the nation, at about $97,000 and $90,000,<br />
respectively. Cook and Lake Counties both have higher mean household income than the State<br />
at almost $106,000 and $149,000, respectively, with a combined mean household income of<br />
$110.5 thousand, see Exhibit 2-6.<br />
Exhibit 2-6<br />
Mean Household Income (2006)<br />
<strong>Chicago</strong> <strong>Executive</strong> <strong>Airport</strong> Economic Impact Study<br />
Geography 2006<br />
Cook County $105,728<br />
Lake County $148,897<br />
Counties Sum $110,504<br />
Illinois $97,056<br />
United States $90,285<br />
Source: Woods & Poole Economics, Inc., 2006 4<br />
4 Woods & Poole Economics, Inc. Washington D.C. Copyright 2006. Woods & Poole does not<br />
guarantee the accuracy of this data. The use of this data and the conclusions drawn from it are solely the<br />
responsibility of Wilbur Smith Associates, Inc.<br />
Wilbur Smith Associates November 2007
<strong>Chicago</strong> <strong>Executive</strong> <strong>Airport</strong> Economic Impact Study–2007 Page 2-6<br />
2.4 Gross State Product<br />
Real Gross State Product (GSP) in Illinois is shown by industry in Exhibit 2-7. Between 1999 and<br />
2006, overall GSP grew by 12% with the largest growth occurring in the retail trade and<br />
information sectors, 28.8% and 28.5%, respectively. Transportation and warehousing was the<br />
third largest growth sector, at 24.1%.<br />
Exhibit 2-7<br />
Illinois Gross State Product by Industry (Million 2000$)<br />
<strong>Chicago</strong> <strong>Executive</strong> <strong>Airport</strong> Economic Impact Study<br />
Industry 1999 2000 2001 2002 2003 2004 2005 2006 Change<br />
Total GSP 452,859 464,194 464,910 466,150 479,293 488,016 492,341 507,037 12.0%<br />
Ag., Frstry., Fish., Hunt. 1,545 2,090 2,038 2,516 2,889 3,663 1,897 1,852 19.9%<br />
Mining 1,226 1,151 1,149 1,063 1,017 948 910 889 -27.5%<br />
Utilities 9,808 10,428 9,679 10,073 10,361 10,375 10,591 10,597 8.0%<br />
Construction 20,472 20,685 20,621 20,603 20,094 19,281 19,314 19,384 -5.3%<br />
Manufacturing 66,420 68,990 64,983 64,633 65,551 70,718 70,599 72,069 8.5%<br />
Wholesale trade 33,192 33,419 35,291 35,254 35,472 35,559 36,033 36,539 10.1%<br />
Retail trade 25,704 27,445 29,367 29,769 30,499 31,021 32,073 33,109 28.8%<br />
Trans. & Warehousing 16,476 17,149 17,014 17,204 17,159 18,764 19,328 20,444 24.1%<br />
Information 18,728 17,822 18,811 18,942 19,027 21,141 22,898 24,073 28.5%<br />
Finance &Insurance 43,429 45,362 45,469 44,072 46,816 47,269 45,352 47,321 9.0%<br />
Real Estate 55,229 57,341 58,550 58,843 58,111 59,926 61,090 65,380 18.4%<br />
Prof. & Tech. Serv. 36,761 38,587 38,479 37,503 37,990 40,313 42,858 44,365 20.7%<br />
Management 10,751 9,571 9,649 10,650 10,900 11,670 11,386 11,510 7.1%<br />
Admin. & Waste Serv. 14,952 13,930 13,163 12,920 13,925 14,149 14,730 15,350 2.7%<br />
Educational Services 3,976 4,019 3,995 4,007 4,198 4,286 4,342 4,482 12.7%<br />
Health Care & Social Assis. 25,973 26,775 27,461 28,056 29,049 29,592 30,547 31,370 20.8%<br />
Arts, Entertnmnt, & Rec. 3,858 3,854 4,013 4,291 4,328 4,277 4,273 4,319 11.9%<br />
Accom. & Food Serv. 10,203 10,436 10,149 10,024 10,306 10,719 10,994 11,362 11.4%<br />
Other Services 11,244 11,102 10,744 10,921 11,053 10,883 10,718 10,780 -4.1%<br />
Government 43,056 44,037 44,432 44,947 50,455 44,577 44,201 44,105 2.4%<br />
Source: Bureau of Economic Analysis, U.S. Chamber of Commerce: Regional Economic Accounts<br />
Wilbur Smith Associates November 2007
<strong>Chicago</strong> <strong>Executive</strong> <strong>Airport</strong> Economic Impact Study–2007 Page 3-1<br />
Chapter 3 - <strong>Chicago</strong> <strong>Executive</strong> <strong>Airport</strong> Economic Impacts<br />
The detailed analysis of aviation at <strong>Chicago</strong> <strong>Executive</strong> <strong>Airport</strong> indicates the combined annual<br />
economic impacts of the airport’s operation, visitors and multiplier impacts totals over $330.8<br />
million in economic activity, of which $124.2 million is paid in earnings to 2,426 jobs. These<br />
impacts result from the direct provision of aviation services, the indirect use of aviation services,<br />
and the multiplier effect of subsequent transactions in the <strong>Chicago</strong> land area economy. The<br />
impact flow is summarized in Exhibit 3-1 and is detailed in the ensuing chapter.<br />
Exhibit 3-1<br />
Economic Impact Summary<br />
<strong>Chicago</strong> <strong>Executive</strong> <strong>Airport</strong> Economic Impact Study<br />
Direct Impacts<br />
$128,075,700<br />
Indirect Impacts<br />
$17,673,700<br />
Multiplier Impacts<br />
$185,026,800<br />
Economic Activity<br />
Earnings<br />
Jobs<br />
Total Impacts<br />
$330,776,200<br />
$124,223,800<br />
2,426<br />
3.1 Direct Impacts<br />
The 73 firms and agencies located at the airport that provide aviation services and equipment<br />
generate $128.1 million in direct aviation related impacts. These at-airport direct impacts are<br />
presented by impact component and expense type in Exhibit 3-2. A major share (26%) of these<br />
expenditures is paid in the form of earnings, $33.3 million, to the 547 full-time equivalent (FTE)<br />
jobs. The capital expenses of $19.3 million comprise (15%) and the operations expenses account<br />
for $75.4 million (59%).<br />
Wilbur Smith Associates November 2007
<strong>Chicago</strong> <strong>Executive</strong> <strong>Airport</strong> Economic Impact Study–2007 Page 3-2<br />
Exhibit 3-2<br />
Direct Economic Impacts<br />
<strong>Chicago</strong> <strong>Executive</strong> <strong>Airport</strong> Economic Impact Study<br />
Jobs<br />
Expenses<br />
Full Part Total FEQ Payroll Capital Operations Total<br />
<strong>Airport</strong> Firms<br />
Government 27 7 34 31 $2,950,600 $16,299,600 $1,225,600 $20,475,800<br />
Aviation Services 226 34 260 245 10,039,600 2,027,100 20,334,500 32,401,200<br />
Corporate 110 0 110 110 9,585,700 577,200 25,078,400 35,241,300<br />
Sub total 363 41 404 386 $22,575,900 $18,903,900 $46,638,500 $88,118,300<br />
Through-the-Fence<br />
Corporate 90 1 91 91 $8,271,400 $361,800 $26,531,700 $35,164,900<br />
Aviation Services 41 0 41 41 1,927,100 43,700 1,663,400 3,634,200<br />
Others 24 7 31 29 541,700 34,400 582,200 1,158,300<br />
Subtotal 155 8 163 161 $10,740,200 $439,900 $28,777,300 $39,957,400<br />
Total 518 49 567 547 $33,316,100 $19,343,800 $75,415,800 $128,075,700<br />
Source: Wilbur Smith Associates<br />
Location of Impacts – Breakdown of expenses by location suggest that 71% of the FTE jobs (386)<br />
and 69% of the expenditures ($88.1 million) occur on airport property, versus 29% of the FTE jobs<br />
(161) and 31% of the expenditures ($40.0 million) arise from through-the-fence operations.<br />
Business Type Expenditure Impacts – Impact breakdown between payroll, capital and operation<br />
expenses varies by business type. The vast majority of capital expenses are incurred by airport<br />
operations, namely the <strong>Chicago</strong> <strong>Executive</strong> <strong>Airport</strong> – who finance various landside and airside<br />
infrastructure improvement projects required to accommodate the aviation training and corporate<br />
demand. In addition, the FAA has a notable presence on the airport. Combined with U.S.<br />
Customs, government operations account for 16% ($20.5 million), of the direct airport-related<br />
expenditures.<br />
Comparatively, the 48 corporate operations identified in the study account for 55% ($70.4 million),<br />
of the airport expenses a large share of which reflects fuel costs. The extensive flight training,<br />
fixed-base-operators, flight clubs and other general aviation related service firms account for 28%<br />
($36.0 million) of the airport-related direct expenditure impacts. Lastly, car rental, catering and the<br />
restaurant account for the remaining impacts ($1.2 million).<br />
Jobs Impacts – An estimated total of 567 people work at the airport on either a full or part-time<br />
basis. Of these, a vast majority (518, 95%) are employed on a full-time basis versus the<br />
remaining (49, 5%) employed on a part-time basis. Combined, an estimated 547 FTE jobs occur<br />
at <strong>Chicago</strong> <strong>Executive</strong> <strong>Airport</strong>. The majority of these FTE jobs (286, 52%) work for aviation service<br />
related firms. Corporate aviation firms employ 201 (37%) FTE jobs, while government firms<br />
account for 31 jobs (6%) and other jobs account for 30 FTE jobs (5%).<br />
Payroll Expenses – Payroll to people who work at the <strong>Airport</strong> and typically live in the region<br />
totals $33.3 million annually. This payroll goes to the estimated 567 people who work at the<br />
airport (547 FTE jobs). Many of these jobs are high paying, with the average FTE employee<br />
Wilbur Smith Associates November 2007
<strong>Chicago</strong> <strong>Executive</strong> <strong>Airport</strong> Economic Impact Study–2007 Page 3-3<br />
earning an annual salary of $60,900. However, average payrolls range significantly between<br />
business type and firm. Government employees, which includes many traffic controllers as well<br />
as other airport operation services, generate the highest average payroll of $95,200, Corporate<br />
operations, which employee pilots, mechanics and other support services ($88,800). The<br />
airport service-related firms average $41,900.<br />
Capital Expenses –The $19.3 million in “capital impacts” (see Exhibit 3.2) comprise capital<br />
investments made in which the recipient of the expenditures typically is located in the region.<br />
Capital investment represents physical improvements to airport facilities, either public or private.<br />
However, capital expenditures on aircraft are excluded because the recipient, the aircraft<br />
manufacturer, is located outside of the study region. Funds may come from private sources such<br />
as leaseholders, government agencies such as the airport operator, or through aid grants from the<br />
Federal Aviation Administration (FAA), or the State of Illinois.<br />
The largest share of capital impacts typically originate from the airport operator who manages the<br />
airport, and finances airside and landside improvements. Total airport operator capital costs<br />
evaluated in this study comprise an annual average of the capital costs over the past ten years<br />
and those programmed over the next five years, inclusive of the matching state and federal<br />
contributions. The annual average estimation approach better reflects the typical annual impact<br />
that large capital investment projects have on the local community. For example, actual airside<br />
and landslide improvements averaged $8.5 million over the last 10 years (1998-2007), the vast<br />
majority attributable to the $46.5 million allocated in 2007. This spike in capital expenditures is<br />
expected to continue with an annual average of $24.1 million in programmed expenditures<br />
between 2008 to 2012.<br />
Operation Expenses – Operation expenses include expenditures for local utilities, operations,<br />
parts and supplies, services, aviation fuel, and other local purchases. All of these are of economic<br />
value to the <strong>Chicago</strong> <strong>Executive</strong> <strong>Airport</strong> service area – totaling an estimated $75.4 million. It is<br />
recognized that a significant portion of the airport operation expenses is made by one airport<br />
business to another at-airport business.<br />
3.2 Indirect Impacts<br />
The estimated $17.7 million in total indirect impacts at <strong>Chicago</strong> <strong>Executive</strong> <strong>Airport</strong> include visitor<br />
impacts associated with air taxi, corporate and personal aircraft operations. Each visitor type<br />
demonstrates different travel patterns regarding percent visitors, percent staying overnight and<br />
expenditures per day, etc. Based on these differences, a composite of the visitor impact<br />
estimation is diagramed in Exhibit 3-3.<br />
Wilbur Smith Associates November 2007
<strong>Chicago</strong> <strong>Executive</strong> <strong>Airport</strong> Economic Impact Study–2007 Page 3-4<br />
Exhibit 3-3<br />
Indirect General Aviation Visitor Impacts<br />
<strong>Chicago</strong> <strong>Executive</strong> <strong>Airport</strong> Economic Impact Study<br />
General Aviation Operations<br />
Total Takeoffs<br />
43,731<br />
Itinerant & Air Taxi<br />
Operations<br />
87,462<br />
Visitor<br />
Landings<br />
18,434<br />
Total Landings<br />
43,731<br />
Resident<br />
Landings<br />
25,297<br />
Average People<br />
Per Aircraft<br />
3.3<br />
Total General<br />
Aviation Visitors<br />
61,026<br />
Indirect Impacts<br />
Day Only<br />
Visitors<br />
22,292 (37%)<br />
Average Daily<br />
Visitor Expenditures<br />
$28<br />
Overnight<br />
Visitors<br />
36,614 (63%)<br />
Average<br />
Length of Stay<br />
2.0 days<br />
Average Daily<br />
Visitor Expenditures<br />
$233<br />
Day Only<br />
Visitor Expenditures<br />
$637,000<br />
Overnight<br />
Visitor Expenditures<br />
$17,036,700<br />
Total GA<br />
Visitor Impacts<br />
$17,673,700<br />
Wilbur Smith Associates November 2007
<strong>Chicago</strong> <strong>Executive</strong> <strong>Airport</strong> Economic Impact Study–2007 Page 3-5<br />
The general aviation visitor impact estimates were derived from a transient pilot survey,<br />
discussions with airport management, corporate tenants, fixed-base-operators and from previous<br />
studies. Of the 87,462 itinerant and air-taxi annual operations (in 2006) at <strong>Chicago</strong> <strong>Executive</strong><br />
<strong>Airport</strong>, there were a total of 43,731 landings (one aircraft operation equals one take-off or one<br />
landing), with an estimated 18,434 (42%) visitor landings. Assuming an average of 3.3 people per<br />
aircraft, the visitor landings translate into a total of 61,026 annual General Aviation visitors in<br />
2005.<br />
Many of these General Aviation visitors (22,292 or 37%) involve people who stay in the region for<br />
less than an entire day. These visitors fly into <strong>Chicago</strong>-land area, conduct business and depart<br />
the same day. The other 36,614 General Aviation visitors (63%) are people who stay in the<br />
region overnight. It is estimated that the average length of stay of the General Aviation visitor at<br />
<strong>Chicago</strong> <strong>Executive</strong> <strong>Airport</strong> is 2.0 days, with an average daily expenditure of $233 per day.<br />
Combined, the regional visitor expenditures (food, lodging, entertainment, etc.) made by<br />
passengers and pilots who arrive at <strong>Chicago</strong> <strong>Executive</strong> <strong>Airport</strong> via general aviation aircraft total<br />
$17.7 million annually.<br />
3.3 Multiplier and Total Impacts<br />
The “direct” and “indirect” economic impacts represent final demand increases in the airport<br />
impact area. Such “final demand” increases, however, do not represent the total economic impact<br />
value attributable for the <strong>Chicago</strong> <strong>Executive</strong> <strong>Airport</strong>. Rather, a “multiplier” effect also exists from<br />
the respending of these final demand expenditures through the local economy.<br />
As shown at the beginning of this Chapter (see Exhibit 3-1), an aviation-related multiplier impact<br />
of $185.0 million is generated from the combined direct and indirect impacts. In total, the aviation<br />
related impacts are $330.8 million in economic activity, with $124.2 million in earnings paid to the<br />
2,426 jobs. These direct, indirect and multiplier impact types are presented by impact measure<br />
(i.e., output, income and jobs) in Exhibit 3-4.<br />
Exhibit 3-4<br />
Impact Breakdown by Measure and Type<br />
<strong>Chicago</strong> <strong>Executive</strong> <strong>Airport</strong> Economic Impact Study<br />
Impacts Output Income<br />
Output Income Jobs per Job Per Job<br />
Direct $128,075,700 $33,316,100 547 $234,100 $60,900<br />
Indirect 17,673,700 6,999,900 297 $59,600 $23,600<br />
Multiplier 185,026,800 83,907,800 1,583 $116,900 $53,000<br />
Total $330,776,200 $124,223,800 2,426 $136,300 $51,200<br />
Source: Wilbur Smith Associates use of IMPLAN<br />
The typical direct at-airport job is high paying. Impact comparison suggests that every direct job<br />
generates an estimated $234,100 in output with an average salary of $60,900. Comparatively,<br />
every indirect job typically pays much less ($23,600).<br />
Wilbur Smith Associates November 2007
<strong>Chicago</strong> <strong>Executive</strong> <strong>Airport</strong> Economic Impact Study–2007 Page 4-1<br />
Chapter 4 - <strong>Airport</strong>-Related Tax Impacts<br />
The following tax analysis addresses the taxes paid by businesses, property taxes paid by<br />
airport firms, as well as the income taxes paid by the 2,426 people employed directly or<br />
indirectly by the airport. Combined, the State and Cook County collect a total of $17.4 million in<br />
taxes annually that is directly or indirectly attributable to <strong>Chicago</strong> <strong>Executive</strong> <strong>Airport</strong>. The<br />
income, property and business related tax components are presented below.<br />
4.1 Income Taxes<br />
While the marginal tax rate in Illinois is 3% on income earned in Illinois, tax refunds, exemptions<br />
and other factors result in an effective state income tax that is significantly less. Specifically,<br />
comparison of state income tax receipts in FY 2003 ($7.4 billion) 5 to that of total personal<br />
income ($355.7 billion) 6 yield an effective state income tax rate of 2.08%. This effective tax rate<br />
of 2.08% is applied to the $124.3 million in airport-related income, suggesting a net income tax<br />
contribution of $2.6 million paid to State coffers. This state income tax benefit includes the<br />
income associated with jobs both at the airport as well as the indirect and multiplier jobs that<br />
occur off-airport.<br />
4.2 Personal Property Taxes and Registration Fees<br />
Personal property taxes are paid by airport tenants on buildings and structures, but not on<br />
aircraft. These taxes are discussed be<br />
Aircraft Taxes and Fees – Personal property taxes are not assessed on either personal or<br />
commercial aircraft in the State of Illinois. Aviation aircraft, though not taxed as personal<br />
property, is subject to registration fees. A flat rate $20 registration fee is imposed on all<br />
aviation aircraft that is valid for a two year term. Aviation aircraft registration is conducted<br />
through the Illinois Department of Transportation, Division of Aeronautics. With 294 7 based<br />
aircraft at <strong>Chicago</strong> <strong>Executive</strong>, an estimated $2,940 in registration fees are collected annually by<br />
the State. Exclusion of aircraft property taxes and the imposition of the very low, marginal<br />
registration fee helps ensure that aviation is competitively priced compared to other states.<br />
Real Property Taxes – Individuals and commercial entities, though not required to pay personal<br />
property taxes, are obliged to pay taxes on real property. Real property is classified as land or<br />
permanent infrastructure improvements which include buildings, paving projects, drainage<br />
systems, fences, landscaping, etc. <strong>Airport</strong> leaseholders are obliged to pay real property taxes if<br />
5 Illinois Department of Revenue, http://www.revenue.state.il.us/Businesses/TaxInformation/Income/individual.htm<br />
6 Illinois Department of Revenue, http://www.revenue.state.il.us/TaxStats/TY03IncomeTaxData.pdf<br />
7 KPWK, <strong>Chicago</strong> <strong>Executive</strong> <strong>Airport</strong>. <strong>Airport</strong> Operational Statistics. airnav.com<br />
Wilbur Smith Associates November 2007
<strong>Chicago</strong> <strong>Executive</strong> <strong>Airport</strong> Economic Impact Study–2007 Page 4-2<br />
leasing from a tax exempt property owner 8 , as in the case of the hangar tenants at <strong>Chicago</strong><br />
<strong>Executive</strong>. As seen in Exhibit 4-1, in 2006, the total assessed real property value at <strong>Chicago</strong><br />
<strong>Executive</strong> was $6,089,800 and the actual real property taxes paid was $1,310,100. From 2003<br />
to 2005, the assessed real property value and the actual real property tax paid more than<br />
doubled, and in 2006, only slightly decreasing from the previous year.<br />
Exhibit 4-1:<br />
Real Property Tax Assessed Value and Paid Amount<br />
<strong>Chicago</strong> <strong>Executive</strong> <strong>Airport</strong> Economic Impact Study<br />
Year Assessed Value Paid by Lessees<br />
1993 1,283,561 225,193<br />
1994 1,304,630 232,248<br />
1995 1,311,920 227,011<br />
1996 1,321,926 231,546<br />
1997 1,311,920 233,287<br />
1998 2,085,267 375,047<br />
1999 1,875,446 338,137<br />
2000 2,917,837 438,804<br />
2001 2,917,837 458,415<br />
2002 3,648,552 599,044<br />
2003 3,562,192 733,684<br />
2004 1 5,405,355 1,055,771<br />
2005 7,248,517 1,377,858<br />
2006 6,089,811 1,310,076<br />
Source: Palwaukee Municipal <strong>Airport</strong> 2006 Comprehensive Annual<br />
Financial Report, p.36 and 2005/2006 Real Estate Taxes Assessments<br />
1<br />
Actual data unavailable, interpolated from years 2003 and 2005<br />
In addition to this <strong>Airport</strong> information, through the fence operators also pay similar property<br />
taxes. Property tax survey information collected from the through the fence operators suggest<br />
an additional $1.3 million is collected by Cook County. (Note that property tax estimates derived<br />
from the survey of airport tenants yielded property estimates of $1.4 million – just slightly higher<br />
than the actual values reported in the CAFR.) In total, the airport tenants and through-thefence-operators<br />
collect an estimated $2.7 million annually in local county property taxes.<br />
4.3 Business Taxes<br />
The IMPLAN model also provides an estimate of the taxes paid by businesses associated with<br />
normal operations, including sales taxes, excise taxes, fees, and licenses. Indirect business<br />
taxes are considered a portion of the value added aspect of total output. These tax impact<br />
estimates exclude income taxes and the property taxes paid by at-airport businesses. In total,<br />
8 The Illinois Property Tax System: A Guide to the Local Property Tax Cycle. Illinois Department of<br />
Revenue. page 6.<br />
Wilbur Smith Associates November 2007
<strong>Chicago</strong> <strong>Executive</strong> <strong>Airport</strong> Economic Impact Study–2007 Page 4-3<br />
an estimated $12,151,800 in business taxes is paid by firms who are directly or indirectly related<br />
to airport activity, as shown in Exhibit 4-2. The on profits or income.<br />
Exhibit 4-2<br />
Business Taxes by Type<br />
<strong>Chicago</strong> <strong>Executive</strong> <strong>Airport</strong> Economic Impact Study<br />
Type<br />
Amount<br />
Direct $4,884,700<br />
Indirect 1,333,800<br />
Multiplier 5,933,300<br />
Total $12,151,800<br />
4.4 Total Taxes<br />
A total of $17.4 million in annual taxes were identified as affiliated with airport operations.<br />
These include the property taxes paid by airport tenants, income taxes associated with<br />
individuals who work both on and off the airport, and business taxes paid by firms directly or<br />
indirectly affected by airport operations.<br />
Exhibit 4-3<br />
Business Taxes by Type<br />
<strong>Chicago</strong> <strong>Executive</strong> <strong>Airport</strong> Economic Impact Study<br />
Type<br />
Amount<br />
At-<strong>Airport</strong> Real Property Tax $2,700,100<br />
Income Tax 2,583,900<br />
Business Taxes 12,151,800<br />
Total $17,435,700<br />
Wilbur Smith Associates November 2007
<strong>Chicago</strong> <strong>Executive</strong> <strong>Airport</strong> Economic Impact Study–2007 Page 5-1<br />
Chapter 5 - Business User Impacts and Other Benefits<br />
As regional business markets become more national and even global in scale, airports are<br />
increasingly seen as prerequisites for local economic development. However, insufficient<br />
transportation systems can seriously impede actual economic development. As time constraints<br />
and dependability become increasingly important, the role of air transport for both goods and<br />
personnel continues to increase. Further, the commercial air transportation system struggles to<br />
accommodate demand as airline load factors continue to reach new highs. 9 Given this<br />
paradigm, corporations increasingly use the more direct, dependable and controllable flight<br />
options that general aviation transport provides in moving key personnel and essential freight.<br />
This is especially evident in the <strong>Chicago</strong> area where O’Hare International <strong>Airport</strong>, one of the<br />
busiest in the world, is continually plagued by flight delays and/or cancellations due to<br />
congestion and severe weather. While the preceding economic impact analysis evaluated the<br />
jobs, income and output associated with the businesses that provide air transport, it did not<br />
address the value of air transport to the businesses that depend on <strong>Chicago</strong> <strong>Executive</strong> <strong>Airport</strong>.<br />
This user impact is vital to the <strong>Chicago</strong> area economy. However, no definitive manner exists to<br />
measure the value of the airport to the major business users.<br />
Nonetheless, the value is real and is addressed below. This section begins with an overview of<br />
the National Business Aviation Association (NBAA) and General Aviation Manufactures<br />
Association (GAMA) perspective, followed by a summary of typical business user surveys. A<br />
quantitative perspective is then provided through an estimate of employment levels at the<br />
businesses who have corporate aircraft based at <strong>Chicago</strong> <strong>Executive</strong>. The chapter concludes<br />
with qualitative description of the qualitative benefits of how the <strong>Airport</strong>’s activities affect the<br />
community’s quality of life.<br />
5.1 Aviation-Dependent Industries<br />
Many of the nation's leading employers that use general aviation as a business tool are<br />
members of the NBAA. The NBAA’s Business Aviation Fact Book 2004 indicates that<br />
approximately 75% of all businesses included in the Fortune 500 operate general aviation<br />
aircraft. Moreover, 92 of the Fortune 100 companies operate general aviation aircraft. A<br />
detailed analysis conducted for NBAA in 2004 also indicated that among the Fortune 500 there<br />
were more than twice as many companies operating general aviation aircraft as non-operators.<br />
Business use of general aviation aircraft at <strong>Chicago</strong> <strong>Executive</strong> <strong>Airport</strong> ranges from small singleengine<br />
aircraft rental to multiple aircraft corporate fleets supported by dedicated flight crews and<br />
9 The ATA Factbook – 2007 reports seat load factors (occupied percent of commercial aircraft seats) of<br />
77.6% in 2005 and 79.2% in 2006. While these factors fluctuate monthly, the general annual trend<br />
continues to rise.<br />
Wilbur Smith Associates November 2007
<strong>Chicago</strong> <strong>Executive</strong> <strong>Airport</strong> Economic Impact Study–2007 Page 5-2<br />
mechanics. The use of general aviation aircraft enables employers to efficiently transport<br />
personnel and air cargo. Businesses use general aviation aircraft to link multiple office locations<br />
and to reach existing and potential customers. Small to mid-size company use of business<br />
aircraft escalated through the dramatic emergence of various chartering, leasing, time-sharing,<br />
interchange agreements, partnerships, and management contracts. Fractional ownership<br />
arrangements have also experienced recent rapid growth. The NBAA estimated that between<br />
2000 and 2004 the number of companies and individuals indicating fractional ownership<br />
increased 62%, from 3,834 to 6,217. Similar general aviation usage trends were observed at<br />
<strong>Chicago</strong> <strong>Executive</strong> <strong>Airport</strong>.<br />
Regardless of who owns the aircraft or what type of aircraft is flown, businesses increasingly<br />
choose to use general aviation because it provides safe, efficient, flexible, and reliable transport.<br />
Of all the benefits provided to business by general aviation, flexibility is the highest ranked factor<br />
by all businesses using general aviation aircraft. Many reasons exist for why businesses use<br />
general aviation in their day-to-day operation; NBAA identified the following seven key factors:<br />
1. Employee time savings<br />
2. Increased productivity<br />
3. Minimization of non-business hours away from home<br />
4. Assurance of industrial security<br />
5. Maximization of personal safety and peace of mind<br />
6. More control of business travel scheduling<br />
7. Better facilitation of the entrepreneurial spirit<br />
The use of general aviation as a business tool adds to productivity and to the bottom line.<br />
According to an NBAA survey of key Forbes and Fortune 500 companies, those businesses that<br />
use general aviation aircraft routinely and significantly outperform businesses that do not.<br />
Performance indicators such as annual sales, number of employees, value of assets, and<br />
annual income are significantly higher for employers using general aviation aircraft.<br />
5.2 Typical Value-Added Impacts<br />
Considering the number and variety of businesses in the <strong>Chicago</strong> area, it is impossible to<br />
quantify the value-added benefit that area businesses derive from using the <strong>Chicago</strong> <strong>Executive</strong><br />
<strong>Airport</strong>. It is possible, however, to obtain perspective on the importance of aviation to the<br />
business community through surveys. Surveys of businesses in industries that typically use<br />
aviation (i.e., manufacturing, transportation, telecommunications, engineering/consulting, and<br />
utility sectors) are often conducted as part of larger State Aviation System Plans to assess their<br />
dependence on aviation.<br />
Wilbur Smith Associates November 2007
<strong>Chicago</strong> <strong>Executive</strong> <strong>Airport</strong> Economic Impact Study–2007 Page 5-3<br />
5.2.1 Previous Study Business User Surveys<br />
Business user surveys have been conducted over many years for several studies. While each<br />
study yields differences, some general trends emerge. For this reason, recent survey results for<br />
other studies were collected and reviewed. A summary of the Location Factor Ranking and<br />
General Aviation Business Use for the last six major statewide studies is summarized below<br />
Location Factor Ranking – The off-airport business user survey asked respondents to rank the<br />
importance of 14 various factors considered in relocation or expansion decisions. Overall, the<br />
availability of an airport with scheduled commercial airline service ranked between 4 th and 6 th ,<br />
while proximity to general aviation facilities ranked between 7 th and 10 th , as shown below in<br />
Exhibit 5-1. Highway access, as one might expect, ranked 1 st in all six studies, followed by<br />
labor supply and trained workforce.<br />
Exhibit 5-1<br />
Business Location Factors and GA Business Use<br />
<strong>Chicago</strong> <strong>Executive</strong> <strong>Airport</strong> Economic Impact Study<br />
Missouri<br />
South<br />
Carolina Nebraska Ohio Texas Arkansas<br />
Location Factor Ranking<br />
Academic or cultural centers 7 7 7 6 6 10<br />
Commercial service airport 6 4 5 5 4 5<br />
General aviation airport 10 8 9 9 10 7<br />
Highway access 1 1 1 1 1 1<br />
Historic location 13 14 12 10 9 12<br />
Labor supply availability 2 2 2 2 2 2<br />
Natural Resources 11 11 11 12 12 11<br />
Rail transportation facilities 14 13 13 14 13 13<br />
Raw Materials 9 10 10 11 14 9<br />
Supplier proximity 5 6 6 8 8 6<br />
Tax incentives 4 5 4 4 5 4<br />
Trained workforce availability 3 3 3 3 3 3<br />
Urban business district 8 9 8 7 7 8<br />
Water Transportation Facilities 12 12 14 13 11 14<br />
General Aviation Business Use<br />
Own, lease, charter aircraft 15% 19% 18% 24% 24% 29%<br />
Supplier and/or customer use 35% 40% 32% 35% 28% 33%<br />
Source: Wilbur Smith Associates, Statewide Studies<br />
Business Use of General Aviation Services – Survey results also indicate that many businesses<br />
depend on general aviation airports on a daily basis. Without access to general aviation,<br />
businesses indicated a need to cut employment or possibly relocate to other states. Of the<br />
responding businesses in each study 15% to 29% either own (outright or fractionally), lease or<br />
charter aircraft on a regular basis. Further, an even greater share of their customers and/or<br />
suppliers (e.g., 32% to 40%) rely on general aviation aircraft.<br />
Wilbur Smith Associates November 2007
<strong>Chicago</strong> <strong>Executive</strong> <strong>Airport</strong> Economic Impact Study–2007 Page 5-4<br />
5.2.2 <strong>Chicago</strong> <strong>Executive</strong> <strong>Airport</strong> Business User Survey<br />
The targeted sectors represent those with greater propensities to use scheduled commercial<br />
airline service and general aviation in their location/expansion decisions. For this study, a<br />
survey mailing list was developed based on a random sampling of five hundred business<br />
establishments within a ten-mile radius of the <strong>Airport</strong>, with a minimum revenue threshold of $1<br />
million and a minimum employment threshold of 50 employees. A breakdown of surveyed firm<br />
sales volume, employment levels and industry SIC codes is shown in Exhibit 5-2.<br />
Exhibit 5-2<br />
Business User Survey Firm Characteristics<br />
<strong>Chicago</strong> <strong>Executive</strong> <strong>Airport</strong> Economic Impact Study<br />
Sales Volume Employee Size SIC Code<br />
Range Firms % Range Firms % Range Firms %<br />
$10M-$20M 193 38.6% 50-99 186 37.2% 15-17 49 9.8%<br />
$20M-$50M 168 33.6% 100-249 204 40.8% 20-39 234 46.8%<br />
$50M-$100M 69 13.8% 250-499 60 12.0% 40-49 29 5.8%<br />
$100M-$500M 51 10.2% 500-999 23 4.6% 60-67 51 10.2%<br />
$500M-$1B 10 2.0% 1000-4999 20 4.0% 70-79 73 14.6%<br />
$1B+ 9 1.8% 5000-9999 7 1.4% 80,87 64 12.8%<br />
Total 500 100.0% Total 500 100.0% Total 500 100.0%<br />
Unfortunately, the response rate was disappointing. Of the 500 firms surveyed only 15<br />
responded. Given the poor response rate, it was not possible to draw any meaningful<br />
conclusions from the local business user survey.<br />
5.3 Business Aviation at <strong>Chicago</strong> <strong>Executive</strong> <strong>Airport</strong><br />
Identification of the airport users, by aircraft operations, was obtained from the IFR (Instrument<br />
Flight Rule) records at the <strong>Airport</strong>. IFR records identify the tag registration of the aircraft and the<br />
commercial owner of the aircraft for each operation. <strong>Chicago</strong> <strong>Executive</strong> <strong>Airport</strong> initially identified<br />
over 3,500 different businesses, operating throughout the country, with over 46,000 annual<br />
operations and almost 5,500 aircraft.<br />
To determine the economic implications of airport users within the study area, the data was<br />
filtered and narrowed to identify locally based firms that regularly use the <strong>Airport</strong>. Of the over<br />
3,500 businesses identified as airport business users, the list was narrowed to those physically<br />
located in the State of Illinois (approximately 14,200), and then further narrowed to only those<br />
within the greater <strong>Chicago</strong> metropolitan area (3,500). Further, firms with less than twenty<br />
annual airport operations annually were considered as intermittent users and not significantly<br />
dependent on the <strong>Chicago</strong> <strong>Executive</strong> <strong>Airport</strong>. Lastly, firms that provide air taxi, training and<br />
other strictly aviation-oriented services were also filtered (since their impacts are typically<br />
addressed under the preceding impact analysis). The at-airport recognizance and tenant<br />
interviews also helped identify non-business users.<br />
Wilbur Smith Associates November 2007
<strong>Chicago</strong> <strong>Executive</strong> <strong>Airport</strong> Economic Impact Study–2007 Page 5-5<br />
Given these filters, 51 locally based firms were identified that use the <strong>Airport</strong> regularly (i.e., at<br />
least twice per month) for business purposes. These 51 firms operate about 5,500 flights<br />
annually with 117 aircraft. On average, this suggests that each of the 51 firms had two aircraft<br />
(2.3 aircraft per firm) and operated each aircraft once per week (47 operations per year).<br />
Employment and annual sales revenues figures were obtained where available and estimated<br />
where unavailable for those identified airport users to estimate employment and sales volumes<br />
for study area firms that regularly rely on the airport. 10 The direct effect of these 51 firms on the<br />
local <strong>Chicago</strong> area economy is an estimated 12,600 jobs and $1.3 billion in sales.<br />
5.4 Other Qualitative Benefits<br />
Lastly, qualitative benefits arise from regular airport activities that improve people’s quality of<br />
life. While it is difficult to place a dollar value on such impacts, these activities benefit local<br />
residents, business and visitors in a variety of ways. These include health, welfare and safety<br />
benefits that arise form medical flights, police patrol, traffic reporting, educational opportunities,<br />
economic development marketing, etc. The airport management survey conducted as part of<br />
this study identified specific examples of qualitative benefits supported at <strong>Chicago</strong> <strong>Executive</strong><br />
<strong>Airport</strong>, and is summarized in Exhibit 5-3.<br />
While this matrix is not all-encompassing, it does provide an overview of the diversity of benefits<br />
that the <strong>Airport</strong> supports, beyond the creation of jobs, payroll, and output. In addition to both<br />
recreational and corporate/business activity, very frequent activities include career training/flight<br />
instruction, search & rescue (CAP), and medical transport (both emergency and physician). In<br />
addition, law enforcement, traffic/news reporting and essential air cargo just-in-time (JIT)<br />
operations are frequently conducted at <strong>Chicago</strong> <strong>Executive</strong> <strong>Airport</strong>.<br />
10 Data obtained from both Dunn and Bradstreet and InfoUSA databases. Estimates for firms lacking<br />
data were calculated based on the average employees or annual sales revenue per aircraft operation.<br />
Wilbur Smith Associates November 2007
<strong>Chicago</strong> <strong>Executive</strong> <strong>Airport</strong> Economic Impact Study–2007 Page 5-6<br />
Exhibit 5-3<br />
Qualitative Activity Benefits<br />
<strong>Chicago</strong> <strong>Executive</strong> <strong>Airport</strong> Economic Impact Study<br />
Activity<br />
Frequency<br />
Recreational flying<br />
Corporate/business activity<br />
Aerial inspections (pipeline, electric. etc.)<br />
Air cargo<br />
Gateway for recreational visitors<br />
Police/law enforcement<br />
Prisoner transport<br />
Military exercises/training<br />
Career training/Flight instruction<br />
Search & rescue/Civil Air Patrol<br />
Environmental patrol (i.e. wildlife)<br />
Emergency medical evacuation<br />
Physician/Medical Transportation<br />
Medical shipments/patient transfer<br />
Aerial photography/surveying<br />
Real estate tours<br />
Traffic/news reporting<br />
Air shows<br />
Food service<br />
Very Frequent<br />
Frequent<br />
Infrequent<br />
Source: Wilbur Smith Survey of <strong>Airport</strong> Management<br />
5.5 Business User Impacts and Other User Benefits Summary<br />
Today’s global economy increasingly requires the safe, efficient, and timely transport of key<br />
personnel and essential freight. Flexibility, efficiency and reliability associated with general<br />
aviation business service continues to attract business aviation users as load factors, weather<br />
delays and congestion increase at commercial service airports. In the <strong>Chicago</strong> area, the<br />
<strong>Chicago</strong> <strong>Executive</strong> <strong>Airport</strong> has become a vital transport node for over 50 local firms. These<br />
businesses employ over 12,600 people and generate $1.3 billion in annual sales. Lastly, the<br />
medical transport, police patrol, traffic reporting, etc. provide health, welfare and safety benefits<br />
to the region.<br />
Wilbur Smith Associates November 2007
<strong>Chicago</strong> <strong>Executive</strong> <strong>Airport</strong> Economic Impact Study–2007<br />
Appendix<br />
Appendix Exhibits<br />
A<br />
B<br />
C<br />
D<br />
<strong>Chicago</strong> <strong>Executive</strong> <strong>Airport</strong> Management Survey<br />
<strong>Chicago</strong> <strong>Executive</strong> <strong>Airport</strong> Tenant Survey<br />
<strong>Chicago</strong> <strong>Executive</strong> <strong>Airport</strong> Business Survey<br />
<strong>Chicago</strong> <strong>Executive</strong> <strong>Airport</strong> Transient Pilot Survey<br />
Wilbur Smith Associates November 2007
AIRPORT MANAGEMENT SURVEY<br />
Contact: __________________________________________________________________________________<br />
Name<br />
Phone Number<br />
EMPLOYMENT<br />
1. During 2006, how many full-time and part-time employees were employed by the <strong>Airport</strong><br />
Operator<br />
Full-time employees: FT Part-time employees: PT<br />
EXPENDITURES<br />
2. Please estimate the total annual wages and benefits paid to all employees shown in Question 1.<br />
2006 Total Wages/Benefits: $<br />
3. Please estimate the total annual taxes paid by the <strong>Airport</strong> in 2006.<br />
Property taxes: $<br />
Other Non-Federal taxes: $<br />
4. Please estimate past and future capital improvements in the following years (include AIP, Federal,<br />
State and local funds/grants) per the below table:<br />
Programmed<br />
2012<br />
2011<br />
2010<br />
2009<br />
2008<br />
Historical<br />
2007<br />
2006<br />
2005<br />
2004<br />
2003<br />
2002<br />
2001<br />
2000<br />
1999<br />
1998<br />
<strong>Airport</strong> Capital Expenditures by Source<br />
<strong>Airport</strong><br />
Operator State Federal Total
REVENUE<br />
5. For 2006, please provide the following for your airport:<br />
Estimated annual operating profit / (loss): $<br />
Annual operating funds provided by your airport’s sponsor: $<br />
6. Does the airport own and lease hangars Yes No<br />
If so, please provide average monthly lease rates:<br />
Monthly T-Hangar Rental Rates: $<br />
Monthly Conventional Hangar Rental Rates: $<br />
7. Does the airport owner/sponsor collect a fuel flowage fee Yes No<br />
If so, please provide the following:<br />
Fuel flowage rate for jet fuel:<br />
Annual gallons sold:<br />
Fuel flowage rate for 100LL:<br />
Annual gallons sold:<br />
8. Does your airport collect landing fees Yes No<br />
If so, how much did the <strong>Airport</strong> collect in landing fees from general aviation aircraft in 2005<br />
$<br />
AIRPORT ACTIVITY<br />
9. Please provide aircraft operation data for 2006 (annual landings and takeoffs) by type:<br />
Local<br />
Air Taxi<br />
Itinerant<br />
Total<br />
10. Please estimate (by percentage) the distribution of your annual operations for trip purpose.<br />
Business Only %<br />
Pleasure/Personal Only %<br />
Business/Personal Mix %<br />
Recreational %<br />
Training %<br />
Other %<br />
11. Does your airport have regular activity by air cargo/air freight carrier Yes No<br />
If so, please list the firms:<br />
__________________<br />
__________________<br />
__________________
12. Please review tenant list below and those firms identified in previous study. Please check those<br />
firms still at the airport (on- and off-property) as well as the thru-the-fence-operators:<br />
2004<br />
Study Current<br />
Original Tenant List<br />
<strong>Chicago</strong> <strong>Airport</strong> Authority<br />
Y<br />
American Flyers Y Y<br />
Atlantic Aviation Y Y<br />
<strong>Chicago</strong> Flight Training<br />
Y<br />
Crosscom<br />
Y<br />
Duncan Aviation<br />
Y<br />
Flight World Limited Y Y<br />
Hertz Corporation<br />
Y<br />
North American Jet Y Y<br />
Palwaukee Service Center Y Y<br />
Priester Charter<br />
Y<br />
Signature Flight Support<br />
Y<br />
Other Firms Identified in Previous Study<br />
The Flight Center<br />
Y<br />
Windy City Flyers<br />
Y<br />
<strong>Chicago</strong> Flight Training<br />
Y<br />
CF Industries ()<br />
Y<br />
Helinet<br />
Y<br />
Rubin Consulting<br />
Y<br />
US Customs<br />
Y<br />
LJ Ventures<br />
Y<br />
Klein Tools<br />
Y<br />
General Aviaiton Services<br />
Y<br />
Nrthrn IL Flight Center<br />
Y<br />
Woodhill<br />
Y<br />
Motorola<br />
Y<br />
Willis Stein & Partners<br />
Y<br />
Dean Witter<br />
Y<br />
Allstate<br />
Y<br />
Alberto Culver<br />
Y<br />
MacLean-Fogg<br />
Y<br />
Household Finance<br />
Y<br />
Duchossios Industries<br />
Y<br />
Airways Flight<br />
Y<br />
Other Aviation-Oriented Firms Currently At/Next to <strong>Airport</strong><br />
Thru-<br />
Fence<br />
<strong>Airport</strong> Total
13. What activities occur at your airport (Check all that apply).<br />
Activity Never Infrequently Frequently<br />
Recreational flying<br />
Agricultural spraying<br />
Corporate/business activity<br />
Aerial inspections (pipeline, electric. etc.)<br />
Air cargo<br />
Gateway for recreational visitors<br />
Police/law enforcement<br />
Prisoner transport<br />
Military exercises/training<br />
Career training/Flight instruction<br />
Search & rescue/Civil Air Patrol<br />
Environmental patrol (i.e. wildlife)<br />
Emergency medical evacuation<br />
Physician/Medical Transportation<br />
Medical shipments/patient transfer<br />
Forest firefighting<br />
Aerial photography/surveying<br />
Real estate tours<br />
Aerial advertising/banner towing<br />
Traffic/news reporting<br />
Air shows<br />
Location of community facilities (parks,<br />
fire station, meeting rooms)<br />
Skydiving<br />
Gliders/soaring<br />
Food service<br />
Other (specify)________________<br />
Very<br />
Frequently<br />
Thank You!
AIRPORT TENANT SURVEY<br />
Business Name: ___________________________________________________________________________<br />
Contact: __________________________________________________________________________________<br />
Name<br />
Phone Number<br />
1. What area of aviation activity applies to your business at the airport (Check ALL that apply.)<br />
Concession<br />
FBO<br />
Corporate Flight Department<br />
Government/<strong>Airport</strong> Management/Owner<br />
Air Freight/Cargo Carrier<br />
Aerial Applicator<br />
EMPLOYMENT<br />
<br />
<br />
<br />
<br />
<br />
<br />
Rental Car<br />
Air Taxi/Charter Operator<br />
Aircraft Maintenance<br />
Flight Instruction<br />
Non-Aviation Business<br />
Other (please specify)<br />
2. During 2005, how many full-time and part-time employees were employed by your business at the<br />
<strong>Airport</strong><br />
2005 Full-time employees: FT 2005 Part-time employees: PT<br />
EXPENDITURES<br />
3. Please estimate the total annual wages and benefits paid to all employees shown in Question 2.<br />
2005 Total Wages/Benefits: $<br />
4. Please estimate the total annual taxes paid by your business in 2005.<br />
Property taxes in 2005: $<br />
Non-Federal taxes paid in 2005: $<br />
5. Please estimate how much your business spent for capital improvements in the following years:<br />
2002: $ 2003: $<br />
2004: $ 2005: $<br />
6. Omitting the expenditure categories above (i.e., payroll, taxes, and capital improvements) please<br />
estimate how much your business spent for all other operating expenses in 2005.<br />
2005 Operating Expense: $<br />
PLEASE CONTINUE ON THE REVERSE SIDE
GROSS SALES<br />
7. What were your business’ total gross sales at the airport in 2005<br />
2005 Gross Sales: $<br />
8. Aircraft and Fuel Sales:<br />
If your business sells aircraft, how many aircraft did you sell during 2004<br />
What was the approximate value of these planes $<br />
How many aircraft did you sell during 2005<br />
What was the approximate value of these planes $<br />
If your business sells fuel, how many gallons of jet fuel did you sell in 2005<br />
How many gallons of 100LL fuel did you sell in 2005<br />
9. Please comment on any additional economic benefits or services that your business provides to the<br />
local community.<br />
________________________________________________________________________________________<br />
________________________________________________________________________________________<br />
________________________________________________________________________________________<br />
________________________________________________________________________________________<br />
Please complete and return this survey within 10 days of receiving it. If you have any questions regarding this<br />
survey, please contact Mr. Matthew Preisler of Wilbur Smith Associates at 513-233-3700 or<br />
mpreisler@wilbursmith.com. You may also return the survey via FAX at 513-624-5182.<br />
THANK YOU FOR COMPLETING THIS SURVEY.<br />
PLEASE FOLD SO THE PREPAID RETURN POSTAGE ADDRESS IS SHOWING.<br />
___________________________________________________________________________________________<br />
NO POSTAGE<br />
NECESSARY<br />
IF MAILED<br />
IN THE<br />
UNITED STATES<br />
BUSINESS REPLY MAIL<br />
FIRST-CLASS MAIL PERMIT NO. 20245 CINCINNATI<br />
POSTAGE WILL BE PAID BY ADDRESSEE<br />
Wilbur Smith Associates<br />
6600 Clough Pike<br />
Cincinnati, OH 45244<br />
Staple or Tape <strong>Here</strong>
BUSINESS SURVEY<br />
Company Name: _____________________________________________________________________________<br />
Street Address: ______________________________________________________________________________<br />
City: ________________________________________________State: ____________Zip: __________________<br />
Business product or service: ___________________________________________________________________<br />
Number of Employees in <strong>Chicago</strong> Area:<br />
Full Time ____________ Part Time ____________<br />
2005 Estimated annual Gross Sales (<strong>Chicago</strong> Area only): $______________________<br />
2005 Estimated Annual Payroll (<strong>Chicago</strong> Area only): $__________________________<br />
SCHEDULED COMMERCIAL AIRLINE SERVICE<br />
1. Please estimate the total number of airline trips per year taken by your company’s <strong>Chicago</strong> Area employees:<br />
________ Annual Trips<br />
2. If you answered Question 1, what percent of airline trips are:<br />
________ Percent International travel<br />
________ Percent Domestic travel<br />
3. Please estimate the percentage of your business activity that depends on the availability of<br />
Commercial Service <strong>Airport</strong>s: ________________%<br />
General Aviation <strong>Airport</strong>s: ________________%<br />
4. Do any of your clients or vendors use commercial air transportation to visit your local business site<br />
Yes _________ Estimated Air Trips/Year<br />
No<br />
From where (Please list the top 3 locations):<br />
1)__________________________ 2)__________________________ 3)_________________________<br />
GENERAL AVIATION SERVICES<br />
5. Do any of your clients or vendors use general aviation to visit your local business site<br />
Yes _________ Estimated Air Trips/Year No<br />
From where (Please list the top 3 locations):<br />
1)__________________________ 2)__________________________ 3)_________________________<br />
6. Does your company: Yes No<br />
Own general aviation aircraft<br />
Use general aviation charters or air taxis<br />
Lease a general aviation aircraft<br />
Have fractional ownership in an aircraft<br />
PLEASE CONTINUE ON THE REVERSE SIDE
AIR CARGO SERVICES<br />
7. What type of air cargo service does your business use (check all that apply):<br />
None<br />
Documents less than 2 pounds<br />
Parcels 2 to 70 pounds<br />
Freight greater than 70 pounds<br />
8. If your company were considering expansion or relocation, how important would the following factors be to<br />
your decision-making process<br />
CATEGORY NOT IMPORTANT VERY IMPORTANT<br />
Convenient highway access 1 2 3 4 5<br />
A commercial service airport 1 2 3 4 5<br />
A general aviation airport 1 2 3 4 5<br />
Water transportation facilities 1 2 3 4 5<br />
Available trained labor supply 1 2 3 4 5<br />
Rail transportation facilities 1 2 3 4 5<br />
An urban business district 1 2 3 4 5<br />
Raw materials 1 2 3 4 5<br />
Natural resources 1 2 3 4 5<br />
Academic or cultural centers 1 2 3 4 5<br />
Tax incentives 1 2 3 4 5<br />
Proximity of suppliers 1 2 3 4 5<br />
Historic location of business 1 2 3 4 5<br />
Please complete and return this survey within 10 days of receiving it. If you have any questions regarding this<br />
survey, please contact Mr. Matthew Preisler of Wilbur Smith Associates at 513-233-3700 or<br />
mpreisler@wilbursmith.com. You may also return the survey via FAX at 513-624-5182.<br />
THANK YOU FOR COMPLETING THIS SURVEY.<br />
PLEASE FOLD SO THE PREPAID RETURN POSTAGE ADDRESS IS SHOWING.<br />
___________________________________________________________________________________________<br />
NO POSTAGE<br />
NECESSARY<br />
IF MAILED<br />
IN THE<br />
UNITED STATES<br />
BUSINESS REPLY MAIL<br />
FIRST-CLASS MAIL PERMIT NO. 20245 CINCINNATI<br />
POSTAGE WILL BE PAID BY ADDRESSEE<br />
Wilbur Smith Associates<br />
6600 Clough Pike<br />
Cincinnati, OH 45244<br />
Staple or Tape <strong>Here</strong>
TRANSIENT PILOT SURVEY<br />
This survey, sponsored by the <strong>Chicago</strong> <strong>Executive</strong> <strong>Airport</strong>, will be used to help measure the positive<br />
economic benefits of daily aircraft operations at the <strong>Airport</strong>. Please take a few moments to complete the<br />
survey and drop it in the mail (pre-paid postage is on the back of the survey).<br />
Thank you for your time.<br />
1. Please indicate the number of travelers, including the pilot, in your aircraft today:<br />
2. Please indicate the type of aircraft you are operating today:<br />
Make:<br />
Model _________________<br />
Did you file an IFR Flight Plan today Yes No<br />
3. Please indicate the purpose of your trip today (please check one box):<br />
Business<br />
Fuel/Maintenance<br />
Flight Training<br />
Recreation<br />
Other (please specify)<br />
4. How long was your visit to <strong>Chicago</strong> <strong>Executive</strong> <strong>Airport</strong>/<strong>Chicago</strong> Area<br />
Day only – How many hours<br />
Overnight – How many days<br />
Hours<br />
Days<br />
5. Please estimate expenditures for this trip:<br />
Hotel/Lodging: $<br />
Food & Beverage: $<br />
Rental Car/Taxi/Limo : $<br />
Retail/Entertainment: $<br />
Aircraft services (fuel, etc): $<br />
Other: $<br />
Total: $<br />
6. How many people, including you, accounted for these expenditures<br />
7. Where is your aircraft based<br />
<strong>Airport</strong> Name City State
PLEASE CONTINUE ON THE REVERSE SIDE<br />
8. In the last 12 months, approximately how many trips by general aviation aircraft did you make to<br />
<strong>Chicago</strong> <strong>Executive</strong> <strong>Airport</strong>:<br />
Business: Pleasure: Training:<br />
9. Please provide us with any comments that you may have regarding the ways in which <strong>Chicago</strong><br />
<strong>Executive</strong> <strong>Airport</strong> airports benefit your business:<br />
Please complete and return this survey within 10 days of receiving it. If you have any questions regarding this<br />
survey, please contact Mr. Matthew Preisler of Wilbur Smith Associates at 513-233-3700 or<br />
mpreisler@wilbursmith.com. You may also return the survey via FAX at 513-624-5182.<br />
THANK YOU FOR COMPLETING THIS SURVEY.<br />
PLEASE FOLD SO THE PREPAID RETURN POSTAGE ADDRESS IS SHOWING.<br />
___________________________________________________________________________________________<br />
NO POSTAGE<br />
NECESSARY<br />
IF MAILED<br />
IN THE<br />
UNITED STATES<br />
BUSINESS REPLY MAIL<br />
FIRST-CLASS MAIL PERMIT NO. 20245 CINCINNATI<br />
POSTAGE WILL BE PAID BY ADDRESSEE<br />
Wilbur Smith Associates<br />
6600 Clough Pike<br />
Cincinnati, OH 45244<br />
Staple or Tape <strong>Here</strong>