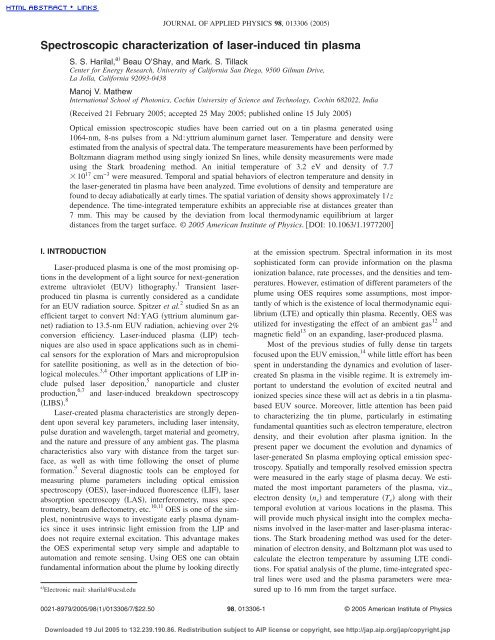
Spectroscopic characterization of laser-induced tin plasma
Spectroscopic characterization of laser-induced tin plasma
Spectroscopic characterization of laser-induced tin plasma

Create successful ePaper yourself
Turn your PDF publications into a flip-book with our unique Google optimized e-Paper software.
JOURNAL OF APPLIED PHYSICS 98, 013306 2005<br />
<strong>Spectroscopic</strong> <strong>characterization</strong> <strong>of</strong> <strong>laser</strong>-<strong>induced</strong> <strong>tin</strong> <strong>plasma</strong><br />
S. S. Harilal, a Beau O’Shay, and Mark. S. Tillack<br />
Center for Energy Research, University <strong>of</strong> California San Diego, 9500 Gilman Drive,<br />
La Jolla, California 92093-0438<br />
Manoj V. Mathew<br />
International School <strong>of</strong> Photonics, Cochin University <strong>of</strong> Science and Technology, Cochin 682022, India<br />
Received 21 February 2005; accepted 25 May 2005; published online 15 July 2005<br />
Optical emission spectroscopic studies have been carried out on a <strong>tin</strong> <strong>plasma</strong> generated using<br />
1064-nm, 8-ns pulses from a Nd:yttrium aluminum garnet <strong>laser</strong>. Temperature and density were<br />
estimated from the analysis <strong>of</strong> spectral data. The temperature measurements have been performed by<br />
Boltzmann diagram method using singly ionized Sn lines, while density measurements were made<br />
using the Stark broadening method. An initial temperature <strong>of</strong> 3.2 eV and density <strong>of</strong> 7.7<br />
10 17 cm −3 were measured. Temporal and spatial behaviors <strong>of</strong> electron temperature and density in<br />
the <strong>laser</strong>-generated <strong>tin</strong> <strong>plasma</strong> have been analyzed. Time evolutions <strong>of</strong> density and temperature are<br />
found to decay adiabatically at early times. The spatial variation <strong>of</strong> density shows approximately 1/z<br />
dependence. The time-integrated temperature exhibits an appreciable rise at distances greater than<br />
7 mm. This may be caused by the deviation from local thermodynamic equilibrium at larger<br />
distances from the target surface. © 2005 American Institute <strong>of</strong> Physics. DOI: 10.1063/1.1977200<br />
I. INTRODUCTION<br />
Laser-produced <strong>plasma</strong> is one <strong>of</strong> the most promising options<br />
in the development <strong>of</strong> a light source for next-generation<br />
extreme ultraviolet EUV lithography. 1 Transient <strong>laser</strong>produced<br />
<strong>tin</strong> <strong>plasma</strong> is currently considered as a candidate<br />
for an EUV radiation source. Spitzer et al. 2 studied Sn as an<br />
efficient target to convert Nd:YAG yttrium aluminum garnet<br />
radiation to 13.5-nm EUV radiation, achieving over 2%<br />
conversion efficiency. Laser-<strong>induced</strong> <strong>plasma</strong> LIP techniques<br />
are also used in space applications such as in chemical<br />
sensors for the exploration <strong>of</strong> Mars and micropropulsion<br />
for satellite positioning, as well as in the detection <strong>of</strong> biological<br />
molecules. 3,4 Other important applications <strong>of</strong> LIP include<br />
pulsed <strong>laser</strong> deposition, 5 nanoparticle and cluster<br />
production, 6,7 and <strong>laser</strong>-<strong>induced</strong> breakdown spectroscopy<br />
LIBS. 8<br />
Laser-created <strong>plasma</strong> characteristics are strongly dependent<br />
upon several key parameters, including <strong>laser</strong> intensity,<br />
pulse duration and wavelength, target material and geometry,<br />
and the nature and pressure <strong>of</strong> any ambient gas. The <strong>plasma</strong><br />
characteristics also vary with distance from the target surface,<br />
as well as with time following the onset <strong>of</strong> plume<br />
formation. 9 Several diagnostic tools can be employed for<br />
measuring plume parameters including optical emission<br />
spectroscopy OES, <strong>laser</strong>-<strong>induced</strong> fluorescence LIF, <strong>laser</strong><br />
absorption spectroscopy LAS, interferometry, mass spectrometry,<br />
beam deflectometry, etc. 10,11 OES is one <strong>of</strong> the simplest,<br />
nonintrusive ways to investigate early <strong>plasma</strong> dynamics<br />
since it uses intrinsic light emission from the LIP and<br />
does not require external excitation. This advantage makes<br />
the OES experimental setup very simple and adaptable to<br />
automation and remote sensing. Using OES one can obtain<br />
fundamental information about the plume by looking directly<br />
a Electronic mail: sharilal@ucsd.edu<br />
at the emission spectrum. Spectral information in its most<br />
sophisticated form can provide information on the <strong>plasma</strong><br />
ionization balance, rate processes, and the densities and temperatures.<br />
However, estimation <strong>of</strong> different parameters <strong>of</strong> the<br />
plume using OES requires some assumptions, most importantly<br />
<strong>of</strong> which is the existence <strong>of</strong> local thermodynamic equilibrium<br />
LTE and optically thin <strong>plasma</strong>. Recently, OES was<br />
utilized for investiga<strong>tin</strong>g the effect <strong>of</strong> an ambient gas 12 and<br />
magnetic field 13 on an expanding, <strong>laser</strong>-produced <strong>plasma</strong>.<br />
Most <strong>of</strong> the previous studies <strong>of</strong> fully dense <strong>tin</strong> targets<br />
focused upon the EUV emission, 14 while little effort has been<br />
spent in understanding the dynamics and evolution <strong>of</strong> <strong>laser</strong>created<br />
Sn <strong>plasma</strong> in the visible regime. It is extremely important<br />
to understand the evolution <strong>of</strong> excited neutral and<br />
ionized species since these will act as debris in a <strong>tin</strong> <strong>plasma</strong>based<br />
EUV source. Moreover, little attention has been paid<br />
to characterizing the <strong>tin</strong> plume, particularly in estima<strong>tin</strong>g<br />
fundamental quantities such as electron temperature, electron<br />
density, and their evolution after <strong>plasma</strong> ignition. In the<br />
present paper we document the evolution and dynamics <strong>of</strong><br />
<strong>laser</strong>-generated Sn <strong>plasma</strong> employing optical emission spectroscopy.<br />
Spatially and temporally resolved emission spectra<br />
were measured in the early stage <strong>of</strong> <strong>plasma</strong> decay. We estimated<br />
the most important parameters <strong>of</strong> the <strong>plasma</strong>, viz.,<br />
electron density n e and temperature T e along with their<br />
temporal evolution at various locations in the <strong>plasma</strong>. This<br />
will provide much physical insight into the complex mechanisms<br />
involved in the <strong>laser</strong>-matter and <strong>laser</strong>-<strong>plasma</strong> interactions.<br />
The Stark broadening method was used for the determination<br />
<strong>of</strong> electron density, and Boltzmann plot was used to<br />
calculate the electron temperature by assuming LTE conditions.<br />
For spatial analysis <strong>of</strong> the plume, time-integrated spectral<br />
lines were used and the <strong>plasma</strong> parameters were measured<br />
up to 16 mm from the target surface.<br />
0021-8979/2005/981/013306/7/$22.50<br />
98, 013306-1<br />
© 2005 American Institute <strong>of</strong> Physics<br />
Downloaded 19 Jul 2005 to 132.239.190.86. Redistribution subject to AIP license or copyright, see http://jap.aip.org/jap/copyright.jsp
013306-2 Harilal et al. J. Appl. Phys. 98, 013306 2005<br />
FIG. 1. Schematic <strong>of</strong> the experimental setup used for optical emission spectroscopic<br />
studies. EM, energy monitor; R, reflector; BS, beam splitter; L,<br />
lens; PTG, programmable timing generator; and ICCD, intensified CCD<br />
camera.<br />
II. EXPERIMENTAL SETUP<br />
We have performed time- and space-resolved spectroscopic<br />
analyses for estima<strong>tin</strong>g the temperature and density <strong>of</strong><br />
the <strong>tin</strong> <strong>plasma</strong>. A schematic <strong>of</strong> the experimental setup is<br />
given in Fig. 1. 1064-nm, 8-ns full width at half maximum<br />
FWHM pulses from a Nd:YAG <strong>laser</strong> operated at 10 Hz<br />
was used to create <strong>tin</strong> <strong>plasma</strong> in a stainless-steel vacuum<br />
chamber. The vacuum chamber was pumped using a cryogenic<br />
pump and a base pressure <strong>of</strong> 10 −6 Torr was easily<br />
achieved. A 2-mm-thick <strong>tin</strong> target in the form <strong>of</strong> a slab was<br />
translated to provide a fresh surface to avoid errors associated<br />
with local hea<strong>tin</strong>g and drilling. The <strong>laser</strong> beam was<br />
focused onto the target surface at normal incidence using an<br />
f /12 antireflection-coated planoconvex lens. The beam energy<br />
was monitored using a thermal surface absorbing energy<br />
meter Ophir, Model 30A. The <strong>plasma</strong> plume was produced<br />
with a <strong>laser</strong> intensity 2 GW/cm 2 .<br />
The light emitted from the luminous <strong>plasma</strong> was transmitted<br />
though a quartz window mounted orthogonally to the<br />
direction <strong>of</strong> plume expansion. An optical system was used to<br />
image the <strong>plasma</strong> plume onto the entrance slit <strong>of</strong> a 0.5-m<br />
Czerny-Turner spectrograph Acton Pro, Spectra-Pro 500i<br />
so as to have one-to-one correspondence with the sampled<br />
area <strong>of</strong> the plume and the image. The optical system was<br />
translated to monitor the different parts <strong>of</strong> the plume. The<br />
exit port <strong>of</strong> the spectrograph was coupled to an intensified<br />
charge-coupled device CCD camera ICCD, PI MAX<br />
Model 512 RB that was operated with vertical binning <strong>of</strong><br />
the CCD array to obtain spectral intensities versus wavelength.<br />
A programmable timing generator was used to control<br />
the delay time between the <strong>laser</strong> pulse and the detector system<br />
with an overall temporal resolution <strong>of</strong> 1 ns. The spectrograph<br />
was equipped with three gra<strong>tin</strong>gs: 150, 600, and<br />
2400 g/mm. The effective dispersion with 150, 600, and<br />
2400 grooves/mm was 12.6, 3.1, and 0.6 nm/mm, respectively.<br />
For the <strong>plasma</strong> temperature measurement the spectral<br />
details <strong>of</strong> the plume were collected using the 600<br />
-grooves/mm gra<strong>tin</strong>g, and for Stark broadening studies the<br />
holographic gra<strong>tin</strong>g with 2400 grooves/mm was used. The<br />
recorded maximum resolution <strong>of</strong> the spectrograph with the<br />
2400-g/mm gra<strong>tin</strong>g with a frequency-stabilized He–Ne <strong>laser</strong><br />
was 0.025 nm. The spectral response calibration <strong>of</strong> the system<br />
spectrograph and detector was performed using a tungsten<br />
lamp for the wavelength range <strong>of</strong> 350–800 nm.<br />
FIG. 2. Time-resolved emission spectra from <strong>laser</strong>-produced <strong>tin</strong> <strong>plasma</strong>. The<br />
spectra were recorded at a distance <strong>of</strong> 1 mm from the target surface and the<br />
gate time <strong>of</strong> the intensifier was set at 20 ns. Most <strong>of</strong> the emission lines in the<br />
figure are due to singly charged <strong>tin</strong> ions.<br />
III. RESULTS AND DISCUSSION<br />
The <strong>laser</strong> ablation process can be classified into three<br />
regimes: evaporation <strong>of</strong> the target material, interaction <strong>of</strong> the<br />
evaporated cloud with incident <strong>laser</strong> beam resul<strong>tin</strong>g in cloud<br />
hea<strong>tin</strong>g and <strong>plasma</strong> formation, and expansion and rapid cooling<br />
<strong>of</strong> the <strong>plasma</strong>. The dynamic, transient behavior <strong>of</strong> the<br />
LIP is challenging for diagnostics since the fundamental<br />
<strong>plasma</strong> quantities vary dramatically in time and space. We<br />
performed spatial and temporal analyses <strong>of</strong> visible emission<br />
from the <strong>laser</strong>-produced <strong>tin</strong> plume. Observations were made<br />
<strong>of</strong> the <strong>plasma</strong> created by the interaction <strong>of</strong> the <strong>laser</strong> beam<br />
with the target in a direction perpendicular to that <strong>of</strong> the <strong>laser</strong><br />
beam.<br />
For recording the time-resolved spectra, the gate <strong>of</strong> the<br />
intensifier was set to 20 ns. Typical emission spectra <strong>of</strong> the<br />
<strong>laser</strong>-produced Sn <strong>plasma</strong> at different times after the peak <strong>of</strong><br />
the <strong>laser</strong> pulse are given in Fig. 2. As seen in the figure<br />
during the initial stages, especially 60 ns, con<strong>tin</strong>uum emission<br />
dominates the spectral line emission, making OES inadequate<br />
for diagnosing the plume. As time evolves, the lineto-con<strong>tin</strong>uum<br />
ratio increases. The con<strong>tin</strong>uum radiation, or<br />
bremsstrahlung, occurs when a free electron collides with<br />
another particle and makes a transition to another free state<br />
<strong>of</strong> lower energy, with the emission <strong>of</strong> a photon. In a <strong>plasma</strong><br />
that is sufficiently hot, most <strong>of</strong> the atoms are stripped <strong>of</strong> their<br />
orbital electrons, hence making electron-ion recombination<br />
and bremsstrahlung the dominant emission mechanisms.<br />
This situation typically occurs for electron temperatures on<br />
the order <strong>of</strong> a few eV. With time, the line-to-con<strong>tin</strong>uum ratio<br />
increases and finally, the spectrum consists <strong>of</strong> mainly ionic<br />
and atomic lines. At shorter time delays, ionic species are<br />
predominant, but for time delays exceeding 200 ns, excited<br />
atomic emissions are evident. The spectral details showed at<br />
early times that most <strong>of</strong> the emission from the <strong>tin</strong> plume was<br />
contributed by singly charged ions. At later times some excited<br />
neutral species were observed.<br />
A. Time <strong>of</strong> flight and velocity<br />
Time-and space-resolved OESs <strong>of</strong> LIP species at various<br />
distances from the target could be used to estimate the<br />
Downloaded 19 Jul 2005 to 132.239.190.86. Redistribution subject to AIP license or copyright, see http://jap.aip.org/jap/copyright.jsp
013306-3 Harilal et al. J. Appl. Phys. 98, 013306 2005<br />
FIG. 3. Time-<strong>of</strong>-flight pr<strong>of</strong>ile <strong>of</strong> the Sn + ion at 556.2 nm obtained from<br />
spectral data is given for two distances from the target surface. The expansion<br />
velocity <strong>of</strong> the species is obtained from this plot. The solid points in the<br />
plot represent the experimental data and the solid curves represent the best<br />
fit.<br />
<strong>plasma</strong> expansion rate near the target. The temporal evolution<br />
<strong>of</strong> spectral line intensity at a constant distance can be<br />
used to construct the time-<strong>of</strong>-flight TOF pr<strong>of</strong>ile. TOF studies<br />
<strong>of</strong> the <strong>plasma</strong> provide vital information regarding the<br />
time taken for a particular species to evolve after the <strong>plasma</strong><br />
has formed. Specifically, this technique gives details <strong>of</strong> the<br />
velocity <strong>of</strong> the emitted particles. This procedure for determination<br />
<strong>of</strong> <strong>plasma</strong> velocity should be used with care due to the<br />
superposition <strong>of</strong> both expansion and forward movements <strong>of</strong><br />
the <strong>plasma</strong> plume. Moreover, the procedure does not take<br />
into account the different populations or origins <strong>of</strong> the same<br />
species. In a LIP, it has been observed that the propagation<br />
velocity <strong>of</strong> a particular species depends upon its charge state.<br />
The expansion velocities <strong>of</strong> the ionized species are found to<br />
increase with degree <strong>of</strong> ionization, while excited neutral species<br />
and molecules are the slowest moving particles. 15 Figure<br />
3 shows a normalized TOF pr<strong>of</strong>ile <strong>of</strong> Sn + species at 556.2 nm<br />
in vacuum. From the temporal shift <strong>of</strong> the TOF peaks at<br />
sequential spatial points, it is possible to obtain the mean<br />
velocity <strong>of</strong> the LIP along the propagation axis. The estimated<br />
expansion velocities <strong>of</strong> Sn + species at distances <strong>of</strong> 1 and 3<br />
mm from the target surface are 0.8110 6 and 1.3<br />
10 6 cm/s, respectively. The estimated expansion velocity<br />
for excited neutral <strong>tin</strong> species at 3 mm from the target is<br />
4.510 5 cm/s, showing that neutrals are moving much<br />
slower than ions. The expansion velocities <strong>of</strong> the species are<br />
found to increase with a distance from the target surface.<br />
This trend in the LIP velocity has been reported previously,<br />
and is due to the initial acceleration <strong>of</strong> the ablated particles<br />
from zero velocity before the <strong>laser</strong>-pulse energy reaches the<br />
ablation threshold, to a maximum velocity. 16<br />
B. Density measurement using Stark broadening<br />
The shape and width <strong>of</strong> the spectral lines emitted by a<br />
<strong>plasma</strong> are governed by collisional processes perturbing the<br />
emit<strong>tin</strong>g atoms and ions. We have selected the linebroadened<br />
pr<strong>of</strong>ile <strong>of</strong> the Sn + line at 645.4 nm 6p 2 P 0<br />
→6s 2 S for the density measurements. The main mechanisms<br />
contribu<strong>tin</strong>g to the broadening <strong>of</strong> the spectral lines are<br />
Stark, resonance, Doppler, and instrumental broadening. The<br />
FIG. 4. Stark-broadened pr<strong>of</strong>iles <strong>of</strong> Sn + lines at 645.4 nm at different distances<br />
from the target surface. The smooth curves represent the fitted<br />
Lorentzian pr<strong>of</strong>iles.<br />
effect <strong>of</strong> resonance broadening is proportional to the groundstate<br />
number density and the transition oscillator strength.<br />
For ablation in vacuum, where ablated species exhibit high<br />
expansion velocities, one <strong>of</strong> the dominant contributions to<br />
the spectral line broadening is Doppler broadening. This is<br />
due to Doppler shifts i.e., D =v z /c experienced by the<br />
various species in the plume exhibi<strong>tin</strong>g different velocity<br />
components v z in the direction <strong>of</strong> observation. Since the expansion<br />
velocities <strong>of</strong> the Sn + ions are found to be on the<br />
order <strong>of</strong> 10 6 cm/s which corresponds to a Doppler linewidth<br />
FWHM <strong>of</strong> 0.02 nm, the effect due to Doppler broadening<br />
may be safely neglected. Set<strong>tin</strong>g the spectrograph at its<br />
maximum resolution can minimize the instrumental broadening.<br />
Stark broadening <strong>of</strong> spectral lines in <strong>plasma</strong>s is caused<br />
by collisions <strong>of</strong> charged species, resul<strong>tin</strong>g in both a broadening<br />
<strong>of</strong> the line and a shift in the peak wavelength. The<br />
FWHM <strong>of</strong> a Stark-broadened line in angstroms without an<br />
ionic contribution is given by the simple relation 17<br />
1/2 =2W 16 n e<br />
Å, 1<br />
10<br />
where W is the electron-impact parameter which can be selected<br />
for different temperatures. 17 The impact parameters <strong>of</strong><br />
the 645.4-nm Sn + line are obtained from Ref. 18 for two<br />
temperatures, viz., 0.86 and 2.86 eV. The uncertainties in the<br />
impact parameters are within 50% for 0.86 eV and within<br />
40% for 2.86 eV. 18 We estimated the density <strong>of</strong> the <strong>plasma</strong><br />
by assuming the impact parameters would vary linearly in<br />
the temperature range mentioned above. Typical Starkbroadened<br />
pr<strong>of</strong>iles <strong>of</strong> Sn + lines recorded at different distances<br />
from the target are given in Fig. 4. Stark-broadened<br />
line pr<strong>of</strong>iles are approximately Lorentzian and the experimental<br />
curves shown here in Fig. 4 fit fairly well with a<br />
typical Lorentzian pr<strong>of</strong>ile.<br />
C. Temperature measurement<br />
The most widely used method in determining the temperature<br />
<strong>of</strong> <strong>laser</strong>-<strong>induced</strong> <strong>plasma</strong>s is Boltzmann plot technique.<br />
Using the intensity <strong>of</strong> line emission from a single<br />
species, it provides the excitation temperature <strong>of</strong> the<br />
<strong>plasma</strong>. 19,20 In its simplest form, only two emission lines are<br />
necessary to obtain the excitation temperature, provided<br />
Downloaded 19 Jul 2005 to 132.239.190.86. Redistribution subject to AIP license or copyright, see http://jap.aip.org/jap/copyright.jsp
013306-4 Harilal et al. J. Appl. Phys. 98, 013306 2005<br />
FIG. 5. Typical Boltzmann plot used for estima<strong>tin</strong>g temperature <strong>of</strong> the<br />
<strong>plasma</strong>. Emission lines from singly ionized <strong>tin</strong> species are used for obtaining<br />
the Boltzmann plot.<br />
there is sufficient difference between their upper energy levels.<br />
Boltzmann plot, however, uses several emission lines,<br />
thus providing a more accurate estimate <strong>of</strong> electron temperature.<br />
A linear fit to experimental data not only validates the<br />
assumption <strong>of</strong> a Maxwellian electron distribution, but serves<br />
as a check for errors in line assignment or transition probability<br />
value. 19 A second method used to obtain the <strong>plasma</strong><br />
temperature is based on the Saha equation. This combines<br />
the number densities <strong>of</strong> consecutive ionization stages <strong>of</strong> a<br />
gas with their Maxwell-Boltzmann factor, resul<strong>tin</strong>g in the<br />
population distribution for each constituent species. In the<br />
present experiment, the <strong>plasma</strong> electron temperature was deduced<br />
from the Boltzmann plot method. If the <strong>plasma</strong> is<br />
assumed to be in LTE, the Boltzmann distribution can be<br />
used to estimate the population <strong>of</strong> the excited state and is<br />
written as 17<br />
g m<br />
n nm = n n<br />
Z e−E m /kT ,<br />
2<br />
where n nm is the population <strong>of</strong> the mth excited level; g m , the<br />
statistical weight <strong>of</strong> the upper level <strong>of</strong> the transition; E m , the<br />
excitation energy; k, Boltzmann’s constant; and T, the temperature.<br />
The emission intensity <strong>of</strong> a line is related to the<br />
population <strong>of</strong> the excited level through the following relation<br />
hc g m hc<br />
I nm A nm n nm = A nm n n e −E m /kT ,<br />
3<br />
nm Z nm<br />
where A nm is the atomic transition probability and nm is the<br />
wavelength <strong>of</strong> the line. For a LTE <strong>plasma</strong>, a plot <strong>of</strong><br />
lnI/Ag against E for several spectral lines should be a<br />
straight line <strong>of</strong> slope −1/kT. The <strong>plasma</strong> temperature was<br />
estimated from the Boltzmann plot <strong>of</strong> 684.4 nm 6p 2 P 0<br />
→6s 2 S, 645.4 nm 6p 2 P 0 →6s 2 S, 559.0 nm 4f 2 F 0<br />
→5d 2 D, 556.2 nm 6d 2 D→6p 2 P 0 , and 533.2 nm 6d 2 D<br />
→6p 2 P 0 line intensities <strong>of</strong> Sn + for which absolute transition<br />
probabilities are well known. The energy levels, transition<br />
probabilities, 21,22 and lifetimes 23 <strong>of</strong> singly ionized Sn are<br />
well documented in recent articles. The uncertainties in the<br />
transition probability values are ±25%. 24 A typical Boltzmann<br />
plot used for calcula<strong>tin</strong>g the temperature is given in<br />
Fig. 5. All the data exhibited a linear fit with a correlation<br />
coefficient better than 0.98.<br />
FIG. 6. The temporal evolution <strong>of</strong> density at different distances from the<br />
target surface.<br />
The measurement <strong>of</strong> temperature and density using spectral<br />
line intensities and broadening requires the use <strong>of</strong> optically<br />
thin sources to avoid self-absorption effects. We assumed<br />
that the <strong>plasma</strong> was optically thin for the lines<br />
considered for temperature and density estimations. The effect<br />
<strong>of</strong> self-absorption depends on the parameters that are<br />
characteristic <strong>of</strong> a particular line including oscillator<br />
strength, level energies, and degeneracies, as well as on<br />
<strong>plasma</strong> quantities such as density and temperature. The resonance<br />
lines are most affected by self-absorption because <strong>of</strong><br />
the high population <strong>of</strong> lower levels and large oscillator<br />
strengths. An estimate <strong>of</strong> the upper limit on the absorption<br />
coefficient for the spectral lines used in temperature and density<br />
estimations showed self-absorption to be negligible. 25 In<br />
addition, all <strong>of</strong> these lines originate at high-lying levels and<br />
terminate in excited levels, making them optically thin. This<br />
is also evidenced by the fact that the branching ratio <strong>of</strong> various<br />
spectral lines at different times <strong>of</strong> plume evolution<br />
showed no variation. Moreover, in a LIP expansion into<br />
vacuum, the ejected <strong>plasma</strong>s have highly directed kinetic energies<br />
as well as steep velocity and density gradients, all <strong>of</strong><br />
which will reduce the effective optical depth appreciably.<br />
D. Temporal evolution <strong>of</strong> temperature and<br />
density<br />
The temporal evolution <strong>of</strong> electron temperature and electron<br />
density is <strong>of</strong> prime importance since many kinetic reaction<br />
rates depend directly or indirectly on these parameters.<br />
We studied the temporal evolution <strong>of</strong> plume parameters at<br />
different distances from the target surface. Figures 6 and 7<br />
show the temporal evolution <strong>of</strong> density and <strong>of</strong> temperature <strong>of</strong><br />
<strong>tin</strong> <strong>plasma</strong> recorded at 1, 3, and 5 mm from the target surface.<br />
The errors provided for density and temperature measurements<br />
considered the uncertainty in the impact<br />
parameters, 18 transition probabilities, 24 and the experimental<br />
error. At shorter times, the line-to-con<strong>tin</strong>uum ratio is very<br />
small and the temperature measurement is very sensitive to<br />
errors in set<strong>tin</strong>g the true con<strong>tin</strong>uum level. This problem is<br />
particularly acute for times up to 60 ns. For times 60 ns,<br />
the line-to-con<strong>tin</strong>uum ratio is within a reasonable limit, and<br />
interference with the con<strong>tin</strong>uum measurement is not severe.<br />
Therefore, the values <strong>of</strong> n e and T e shown in the figures are<br />
reliable. For the temperature and density measurements the<br />
Downloaded 19 Jul 2005 to 132.239.190.86. Redistribution subject to AIP license or copyright, see http://jap.aip.org/jap/copyright.jsp
013306-5 Harilal et al. J. Appl. Phys. 98, 013306 2005<br />
FIG. 7. The temporal evolution <strong>of</strong> temperature at different distances from<br />
the target surface.<br />
gate width <strong>of</strong> the intensifier was set to 20 ns. It is evident<br />
from the figures that the density and temperature attain their<br />
peak values close to the target surface, and then decrease due<br />
to the expansion <strong>of</strong> the plume. An initial electron temperature<br />
<strong>of</strong> about 3.2 eV and a density <strong>of</strong> 7.710 17 cm −3 are<br />
observed at 1 mm from the target. Initially, the <strong>plasma</strong> expands<br />
isothermally during the <strong>laser</strong> pulse. After termination<br />
<strong>of</strong> the pulse, no more energy is pumped into the <strong>plasma</strong>, and<br />
both the temperature and density decrease rapidly with time.<br />
Thermal energy is converted into directed kinetic energy, and<br />
the <strong>plasma</strong> cools through adiabatic expansion. According to<br />
an adiabatic expansion model, the density and temperature<br />
should follow, respectively, a t −3 and t −2 dependence with<br />
time t. The temperature is found to exhibit approximately t −2<br />
dependence at 1 mm from the target surface, which is consistent<br />
with an adiabatic expansion.<br />
Observations show a higher rate <strong>of</strong> decay <strong>of</strong> density at 1<br />
mm than for 3 or 5 mm from the target. For example, at 1<br />
mm the density drops from 7.710 17 to 1.610 17 cm −3<br />
within 200 ns <strong>of</strong> <strong>plasma</strong> evolution, while at 3 mm, the density<br />
slightly increases at earlier times and only drops at later<br />
times. It can be seen from Fig. 7 that, similar to the density<br />
variation with time, the electron temperature decreases rapidly<br />
at 1 mm from the target surface. Within 200 ns <strong>of</strong> plume<br />
evolution, the temperature at 1 mm decays from 3.2 to 0.5<br />
eV. A slight increase in temperature with time is noted at<br />
later times at 1 mm. A weak dependence <strong>of</strong> temperature on<br />
time is observed at 3 mm from the target surface. The temperature<br />
is almost constant around 1 eV at this distance. It<br />
can be seen from Fig. 7 that the electron temperature is significantly<br />
larger at later times. This is more noticeable at 5<br />
mm from the target surface where temperature is found to be<br />
an increasing function <strong>of</strong> time up to 400 ns. One source <strong>of</strong><br />
electron temperature increase is the <strong>laser</strong> energy absorption<br />
through inverse bremsstrahlung that occurs during the <strong>laser</strong><strong>plasma</strong><br />
interaction. The increase in <strong>plasma</strong> temperature is<br />
most likely due to energy released through recombination,<br />
which compensates the expansive cooling. Since the density<br />
<strong>of</strong> the plume is 10 16 cm −3 , the three-body recombination<br />
will eventually dominate radiative recombination. In threebody<br />
recombination the electron is initially captured into an<br />
upper excited level and then cascades down to the ground<br />
state either through radiative transitions or by transferring<br />
FIG. 8. Time-integrated density as a function <strong>of</strong> distance from the target<br />
surface.<br />
energy to free electrons in collisions. Three-body recombination<br />
becomes important when the thermal energy <strong>of</strong> the free<br />
electrons has fallen to much less than the ionization energy.<br />
In this situation a very small three-body recombination rate<br />
can lead to sufficient transfer <strong>of</strong> energy to the electrons to<br />
make a large change in the electron temperature decay rate<br />
without affec<strong>tin</strong>g the density decay rate. This will effectively<br />
reduce the cooling rate caused by adiabatic expansion. A rise<br />
in temperature with time at larger distances was also noted<br />
by Gordillo-Vazquez et al. 26 for a <strong>laser</strong>-produced LiNbO 3<br />
plume and was explained by atom-atom collisions at greater<br />
distances from the target.<br />
E. Spatial dependence <strong>of</strong> temperature and density<br />
We observed an increase in temperature with time for <strong>tin</strong><br />
plumes that became especially noticeable at larger distances<br />
from the target. In order to gain a better understanding <strong>of</strong> the<br />
spatial behavior <strong>of</strong> the plume, spectral measurements were<br />
made at sequential distances from the target surface up to 16<br />
mm. Spectral and line-shape analyses were repeated at different<br />
distances from the target. This provided details about<br />
the evolution <strong>of</strong> electron temperature and density in space as<br />
well as insight into the basic ionization processes occurring<br />
in the pulsed <strong>laser</strong> ablation. In a <strong>laser</strong>-produced <strong>plasma</strong> species<br />
with different charge states propagate with different velocities.<br />
This behavior is more relevant at larger distances<br />
from the target surface where all species begin to separate<br />
out in time. In order to compensate this phenomenon, we<br />
selected a large gate width 1 s for doing the spatial analysis<br />
<strong>of</strong> the plume, where the gate was delayed for increasing<br />
separation from the target surface. Hence, temperature and<br />
density values estimated at various distances are indicative<br />
<strong>of</strong> the average local conditions rather than the defining conditions<br />
at a particular stage <strong>of</strong> the <strong>plasma</strong>’s evolution.<br />
The variation <strong>of</strong> density with distance from the target<br />
surface is given in Fig. 8. The density shows a decreasing<br />
behavior with distance. With increasing separation from the<br />
target surface, the electron density falls from 2.9<br />
10 17 cm −3 at1mmto110 16 cm −3 at 15 mm. The decay<br />
<strong>of</strong> the density is much faster at shorter distances from the<br />
target surface, especially 3 mm after which it levels <strong>of</strong>f.<br />
The variation <strong>of</strong> density with distance z approximately follows<br />
a 1/z law, which indicates that the initial expansion <strong>of</strong><br />
Downloaded 19 Jul 2005 to 132.239.190.86. Redistribution subject to AIP license or copyright, see http://jap.aip.org/jap/copyright.jsp
013306-6 Harilal et al. J. Appl. Phys. 98, 013306 2005<br />
FIG. 9. The variation <strong>of</strong> temperature with distance from the target surface is<br />
given. Time-integrated spectra are used for temperature estimation. The temperature<br />
is found to increase at distances 6 mm and may be caused by<br />
deviations from LTE.<br />
the plume is one dimensional, and is in good agreement with<br />
the predictions <strong>of</strong> the plume expansion model given by Singh<br />
et al. 27<br />
The time-integrated temperature variation with distance<br />
from the target surface is given in Fig. 9. The temperature is<br />
found to be more or less constant at distances 6 mm but at<br />
greater distances the temperature is found to increase. This is<br />
contrary to what has been reported for <strong>plasma</strong>s produced by<br />
<strong>laser</strong> ablation <strong>of</strong> carbon, 28 aluminum, 13 and other targets. 26<br />
The typical spatial variation <strong>of</strong> temperature in these <strong>laser</strong>created<br />
<strong>plasma</strong>s was a rapid decay near the target, but at<br />
larger distances the temperature became a slowly varying<br />
function <strong>of</strong> space. The leveling <strong>of</strong>f <strong>of</strong> the temperature at<br />
larger distances is mainly due to the energy gained from<br />
three-body recombination that compensates the expansive<br />
cooling. In the present studies, the temperature is found to<br />
increase for distances greater than 5 mm. This is also consistent<br />
with our time-resolved temperature measurements where<br />
we noted an appreciable temperature increase at later times.<br />
In <strong>plasma</strong>s three-body recombination hea<strong>tin</strong>g occurs through<br />
the release <strong>of</strong> the ionization energy as electrons and ions<br />
recombine. This process is generally observed for <strong>plasma</strong><br />
temperatures on the order <strong>of</strong> 1 eV. It was noted that the<br />
three-body recombination rate coefficient strongly depended<br />
on the nature <strong>of</strong> the ambient gas used. 29 Gordillo-Vazquez et<br />
al. 29 estimated the ionization rate coefficient and three-body<br />
recombination rate coefficient for <strong>laser</strong>-produced lithium niobate<br />
<strong>plasma</strong> and found these values to vary with distance for<br />
different ambient gases. Compared to the expansion into a<br />
vacuum, the interaction <strong>of</strong> the plume with an ambient gas is<br />
a far more complex gas dynamic process that involves deceleration,<br />
attenuation, thermalization <strong>of</strong> the ablated species,<br />
confinement, formation <strong>of</strong> shock waves, etc. 12 The observed<br />
temperature and density in this experiment favor three-body<br />
recombination. However, in the present experiment where<br />
the plume expands freely into vacuum, the efficiency <strong>of</strong> this<br />
process will be reduced. When the <strong>plasma</strong> expands into<br />
vacuum, the plume species move with different expansion<br />
velocities. It is well known that species with higher charge<br />
states propagate much faster than their less-ionized counterparts<br />
and neutrals. Therefore, at larger distances where the<br />
differential expansion becomes noticeable, the various species<br />
will become separated out and collide less frequently<br />
with one another. This will reduce the rate <strong>of</strong> temperature<br />
equilibration and cooling, and perhaps violate the assumption<br />
<strong>of</strong> local thermodynamic equilibrium in the <strong>plasma</strong>.<br />
We have considered the <strong>plasma</strong> to be in LTE in the estimation<br />
<strong>of</strong> temperature from spectral data. The issue <strong>of</strong> LTE<br />
in <strong>laser</strong>-produced <strong>plasma</strong>s has been discussed by several<br />
authors. 17,30,31 In a transient system, such as a <strong>plasma</strong> formed<br />
by a pulsed <strong>laser</strong> source, the existence <strong>of</strong> LTE requires that<br />
the electron-atom and electron-ion collisional processes occur<br />
sufficiently fast and dominate radiative processes. In a<br />
system that is in LTE, particles will have Maxwellian velocity<br />
distributions, population levels will be distributed according<br />
to Boltzmann’s statistics, ionization states will be described<br />
by Saha’s equation, and the radiation density will<br />
obey Planck’s law. In the present experiment we believe that<br />
the plume is in LTE because <strong>of</strong> the following facts. The<br />
Boltzmann plot, which is used for estima<strong>tin</strong>g the temperature<br />
from line intensities <strong>of</strong> various Sn + lines showed a straight<br />
line fit with high correlation value. We confirm the validity<br />
<strong>of</strong> the McWhirter criterion 32 in the present experiment,<br />
which states that the minimum density for LTE should be<br />
n e 1.4 10 14 T 1/2 e E 3 cm −3 ,<br />
4<br />
where T e and E the energy difference between the upper<br />
and lower energy levels are in eV. For the transition with the<br />
largest energy-gap E=2.325 eV, applying the peak plume<br />
temperature <strong>of</strong> 3.2 eV to this criterion predicts a lower limit<br />
for n e <strong>of</strong> 3.1510 15 cm −3 . Our observed values <strong>of</strong> n e are<br />
always greater than this lower bound, implying that the LTE<br />
approximation assumed for our analysis is valid. These are<br />
necessary conditions for LTE, but not sufficient. At larger<br />
distances and greater times, the number densities <strong>of</strong> the<br />
<strong>plasma</strong> are low and the movement <strong>of</strong> the boundary region is<br />
rapid, so LTE is probably not a good assumption. This is<br />
supported by the fact that the time-integrated density<br />
dropped to 110 16 cm −3 which is considerably lower than<br />
the measured initial density values obtained from timeresolved<br />
studies 710 17 cm −3 . The large drop in density<br />
will affect the thermal equilibrium established between the<br />
upper levels <strong>of</strong> Sn + ions used for the Boltzmann plot. Therefore<br />
we conclude that LTE may not be a good approximation<br />
for large distances and late stages <strong>of</strong> <strong>plasma</strong> evolution.<br />
IV. SUMMARY<br />
Optical emission spectroscopy is used to characterize the<br />
<strong>laser</strong>-produced <strong>plasma</strong> from <strong>tin</strong> in vacuum. Time-and spaceresolved<br />
measurements <strong>of</strong> electron density and temperature<br />
have been carried out using emission lines <strong>of</strong> singly ionized<br />
<strong>tin</strong>. Line intensities from the same ionization stage <strong>of</strong> <strong>tin</strong><br />
species were used in the Boltzmann plot for determining<br />
electron temperature, and the Stark-broadened pr<strong>of</strong>iles <strong>of</strong><br />
first ionized <strong>tin</strong> species were used to calculated the electron<br />
density. At earlier times, especially below 60 ns the intense<br />
con<strong>tin</strong>uum radiation is dominant, making it difficult to extract<br />
line intensities and pr<strong>of</strong>iles. The line-to-con<strong>tin</strong>uum ratio<br />
increases as time evolves. An initial temperature <strong>of</strong> 3.2 eV<br />
Downloaded 19 Jul 2005 to 132.239.190.86. Redistribution subject to AIP license or copyright, see http://jap.aip.org/jap/copyright.jsp
013306-7 Harilal et al. J. Appl. Phys. 98, 013306 2005<br />
and density <strong>of</strong> 7.710 17 cm −3 were measured. In the early<br />
stage <strong>of</strong> <strong>plasma</strong> evolution, the electron temperature and density<br />
rapidly decrease which is characteristic <strong>of</strong> an adiabatic<br />
expansion. The density is found to decay much slower at<br />
larger distances from the target. At later times, a rise in temperature<br />
is observed that becomes more evident at 5 mm<br />
from the target surface. Measurements <strong>of</strong> the spatial variation<br />
<strong>of</strong> temperature and density were carried out using timeintegrated<br />
intensities from <strong>tin</strong> ion lines. The density approximately<br />
followed a 1/z dependence on distance, which is<br />
consistent with an adiabatic expansion. The temperature near<br />
the target was more or less constant, but increased significantly<br />
for distances greater than 7 mm. A deviation from the<br />
assumption <strong>of</strong> LTE for temperature estimation may be the<br />
source <strong>of</strong> this rise in temperature at larger distances.<br />
1 B. Marx, Laser Focus World 39, 342003.<br />
2 R. C. Spitzer, R. L. Kauffman, T. Orzechowski, D. W. Phillion, and C.<br />
Cerjan, J. Vac. Sci. Technol. B 11, 2986 1993.<br />
3 J. D. Hybl, G. A. Lithgow, and S. G. Buckley, Appl. Spectrosc. 57, 1207<br />
2003.<br />
4 A. K. Knight, N. L. Scherbarth, D. A. Cremers, and M. J. Ferris, Appl.<br />
Spectrosc. 54, 3312000.<br />
5 Pulsed Laser Deposition <strong>of</strong> Thin Films, edited by D. B. Chrisey and G. K.<br />
Hubler Wiley, New York, 1994.<br />
6 M. S. Tillack, D. W. Blair, and S. S. Harilal, Nanotechnology 15, 390<br />
2004.<br />
7 S. Arepalli, J. Nanosci. Nanotechnol. 4, 317 2004.<br />
8 C. V. Bindhu, S. S. Harilal, M. S. Tillack, F. Najmabadi, and A. C. Gaeris,<br />
Appl. Spectrosc. 58, 719 2004.<br />
9 S. S. Harilal, C. V. Bindhu, V. P. N. Nampoori, and C. P. G. Vallabhan,<br />
Appl. Phys. Lett. 72, 167 1998.<br />
10 D. B. Geohegan, in Pulsed Laser Deposition <strong>of</strong> Thin Films, edited by D.<br />
B. Chrisey and G. K. Hubler Wiley, New York, 1994, p.115.<br />
11 S. Amoruso, R. Bruzzese, N. Spinelli, and R. Velotta, J. Phys. B 32, R131<br />
1999.<br />
12 S. S. Harilal, C. V. Bindhu, M. S. Tillack, F. Najmabadi, and A. C. Gaeris,<br />
J. Appl. Phys. 93, 2380 2003.<br />
13 S. S. Harilal, M. S. Tillack, B. O’Shay, C. V. Bindhu, and F. Najmabadi,<br />
Phys. Rev. E 69, 026413 2004.<br />
14 Y. Tao et al., Appl. Phys. Lett. 85, 1919 2004.<br />
15 S. S. Harilal, C. V. Bindhu, M. S. Tillack, F. Najmabadi, and A. C. Gaeris,<br />
J. Phys. D 35, 2935 2002.<br />
16 S. S. Harilal, R. C. Issac, C. V. Bindhu, V. P. N. Nampoori, and C. P. G.<br />
Vallabhan, J. Appl. Phys. 80, 3561 1996.<br />
17 H. R. Griem, Principles <strong>of</strong> Plasma Spectroscopy Cambridge, New York,<br />
1997.<br />
18 N. Konjevic, A. Lesage, J. R. Fuhr, and W. L. Wiese, J. Phys. Chem. Ref.<br />
Data 31, 819 2002.<br />
19 J. A. Aguilera and C. Aragon, Spectrochim. Acta, Part B 59, 1861 2004.<br />
20 J. A. Aguilera and C. Aragon, Appl. Surf. Sci. 197, 273 2002.<br />
21 T. Wujec and S. Weniger, J. Quant. Spectrosc. Radiat. Transf. 18, 509<br />
1977.<br />
22 A. Alonso-Medina and C. Colon, Phys. Scr. 61, 6462000.<br />
23 R. M. Schectman, S. Cheng, L. J. Curtis, S. R. Federman, M. C. Fritts, and<br />
R. E. Irving, Astrophys. J. 542, 4002000.<br />
24 A. Alonso-Medina, C. Colon, and C. Rivero, Phys. Scr. 71, 1542005.<br />
25 B. Mar<strong>tin</strong>ez and F. Blanco, J. Phys. B 32, 241 1999.<br />
26 F. J. Gordillo-Vazquez, A. Perea, J. A. Chaos, J. Gonzalo, and C. N.<br />
Afonso, Appl. Phys. Lett. 78, 72001.<br />
27 R. K. Singh, O. W. Holland, and J. Narayan, J. Appl. Phys. 68, 233<br />
1990.<br />
28 S. S. Harilal, C. V. Bindhu, R. C. Issac, V. P. N. Nampoori, and C. P. G.<br />
Vallabhan, J. Appl. Phys. 82, 2140 1997.<br />
29 F. J. Gordillo-Vazquez, A. Perea, and C. N. Afonso, Appl. Spectrosc. 56,<br />
381 2002.<br />
30 E. Perez-Tijerina, J. Bohigas, and R. Machorro, J. Appl. Phys. 90, 3192<br />
2001.<br />
31 O. Barthelemy, J. Margot, S. Laville, F. Vidal, M. Chaker, B. Le Drog<strong>of</strong>f,<br />
T. W. Johnston, and M. Sabsabi, Appl. Spectrosc. 59, 5292005.<br />
32 G. Bekefi, Principles <strong>of</strong> Laser Plasmas Wiley-Interscience, New York,<br />
1976.<br />
Downloaded 19 Jul 2005 to 132.239.190.86. Redistribution subject to AIP license or copyright, see http://jap.aip.org/jap/copyright.jsp