The applicability of soil density measurements ... - Geo-Engineering
The applicability of soil density measurements ... - Geo-Engineering
The applicability of soil density measurements ... - Geo-Engineering

Create successful ePaper yourself
Turn your PDF publications into a flip-book with our unique Google optimized e-Paper software.
<strong>The</strong> <strong>applicability</strong> <strong>of</strong> <strong>soil</strong> <strong>density</strong> <strong>measurements</strong> using a<br />
<strong>soil</strong> penetrating probe<br />
J. Dijkstra, W. Broere<br />
<strong>Geo</strong>-<strong>Engineering</strong>, Delft University <strong>of</strong> Technology, Delft, <strong>The</strong> Netherlands<br />
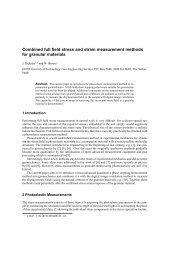
ABSTRACT: This paper presents the results <strong>of</strong> a series <strong>of</strong> laboratory tests used to and<br />
validate a newly developed sensor to measure <strong>soil</strong> <strong>density</strong> around a penetrating probe.<br />
A probe incorporating three <strong>of</strong> these sensors is jacked into a saturated sand sample<br />
during a centrifuge test. <strong>The</strong> sensors correlate the change in electrical resistivity <strong>of</strong> the<br />
<strong>soil</strong> to the pore volume change. For loose to dense initial densities the <strong>density</strong> change<br />
near the probe is indicating an increase in pore volume. <strong>The</strong> measured porosity<br />
change varies between on the three instrument locations as it depends on the penetration<br />
distance.<br />
1 INTRODUCTION<br />
<strong>The</strong> cone penetration test (CPT) is a well established in-situ measurement method,<br />
especially in s<strong>of</strong>t <strong>soil</strong>s. <strong>The</strong> test, which is originally designed to support pile bearing<br />
capacity design, still shows its merit in that discipline. <strong>The</strong> measured cone resistance<br />
is directly and indirectly converted to a pile bearing capacity, using. for instance direct<br />
limit state methods have been developed by. De Ruiter & Beringen (1979),<br />
Bustamante & Gianeselli (1982), Schmertmann (1978) or Eslami & Fellenius (1997).<br />
However, the CPT potentially <strong>of</strong>fer even more versatility by correlating the cone<br />
resistance and measured pore pressures to strength and stiffness properties or even<br />
<strong>soil</strong> state (e.g. Teferra 1974, Been et al. 1986, Jamiolkowski et al. 1988). <strong>The</strong><br />
calibration <strong>of</strong> these empirical relationships involves laboratory tests in which the CPT<br />
cone is penetrated in a sample <strong>of</strong> known initial conditions. For non-cohesive <strong>soil</strong>s<br />
these are the initial <strong>density</strong> and the stress state. As Eiksund (1994) pointed out it can<br />
be questionable if the horizontal stress applied on the side <strong>of</strong> the sample really<br />
produces a similar horizontal stress in the middle <strong>of</strong> the sample where the tests is<br />
performed. Also, the preparation <strong>of</strong> large homogenous samples still is very difficult.<br />
Some authors equipped the CPT cone with additional instrumentation for the in-situ<br />
measurement <strong>of</strong> <strong>soil</strong> <strong>density</strong>. For <strong>soil</strong> <strong>density</strong> characterization, or more precisely<br />
water content, nuclear probes or electrical resistivity probes are used. Neutron scatter<br />
techniques, in which the source (radio-isotope) and detector (photomultiplier) are
mounted on the same cone are most <strong>of</strong>ten used. <strong>The</strong> fast neutron (high energy levels)<br />
source radiates in the <strong>soil</strong> (and will be slowed in the pore water), whilst the slow neutron<br />
(also called thermal neutrons, low energy level neutrons) detector gives an indication<br />
for the received radiation level <strong>of</strong> slow neutrons. This neutron count when<br />
calibrated in known <strong>soil</strong> conditions is a measure for water content (or <strong>density</strong> for fully<br />
saturated <strong>soil</strong>s). An overview <strong>of</strong> possible configurations used in the past is given in<br />
Ruygrok (1977). More recently the execution procedure and the detector quality has<br />
been improved by compensating for natural background radiation by Shibata et al.<br />
(1992). <strong>The</strong> background count is measured first by a cone that is only equipped with a<br />
detector, afterwards the source-detector cone is used. <strong>The</strong> natural background scatter<br />
is compensated in this measurement procedure. <strong>The</strong> method can be improved by<br />
adding an additional detector far from the source. This second detector, therefore,<br />
will only register the background count (Karthikeyan et al. 2007).<br />
Electrical resistivity probes (Vlasblom 1977) measure the apparent resistivity <strong>of</strong><br />
the pore water that is correlated to the <strong>soil</strong> <strong>density</strong>. <strong>The</strong> probe has a current source<br />
that is applied on two conductors, whereas the resulting electrical field in the <strong>soil</strong><br />
from this injected current is measured on two other conductors.<br />
All correlations in fact correlate the undisturbed initial properties to a cone resistance<br />
reading in disturbed conditions as the penetration <strong>of</strong> the CPT will influence the stress<br />
and <strong>density</strong> dependent <strong>soil</strong> properties adjacent to the CPT cone. This is also the case<br />
for the in-situ <strong>density</strong> <strong>measurements</strong>. Ruygrok (1977) already noted the possible influence<br />
<strong>of</strong> the CPT installation on the measured results.<br />
<strong>The</strong> current paper will investigate the possible influence <strong>of</strong> the penetration process <strong>of</strong><br />
the measurement probe on the measured in-situ <strong>density</strong>. For this a series <strong>of</strong><br />
geotechnical centrifuge tests is performed in which an instrumented probe is pushed<br />
in a saturated sand sample with loose-dense initial densities. <strong>The</strong> <strong>density</strong> change is<br />
measured with an apparent resistance measurement technique. <strong>The</strong> test was originally<br />
designed to investigate jacked pile installation, but also contributes to a better understanding<br />
<strong>of</strong> CPT penetration.<br />
2 MEASURING DENSITY NEAR A PROBE<br />
Resistivity <strong>measurements</strong> have been used in geophysics for some time; see e.g. Telford<br />
and Geldart (1990) for an introduction. Such <strong>measurements</strong> yield information on<br />
the stratigraphy <strong>of</strong> the deep sub<strong>soil</strong>. <strong>The</strong> method was first adopted for the use in combination<br />
with a CPT cone by <strong>Geo</strong>Delft (Vlasblom 1977). Four conducting rings were<br />
added to a CPT rod, with two rings providing a constant current and two rings measuring<br />
the resulting potential field. In this setup electrical resistance <strong>measurements</strong><br />
were only made while the probe was stationary. In the analysis geometrical effects<br />
are not accounted for. <strong>The</strong>refore, an apparent resistance is found instead <strong>of</strong> an<br />
absolute value for the electrical resistance. Implementation<br />
Similar to the field probe used by Vlasblom (1977) in the current model tests the<br />
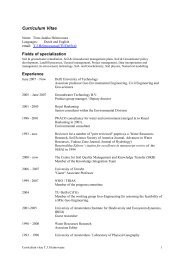
probe is equipped with four conductors for each instrument level. A potential field
Fig. 1: Electrical fiel around the <strong>density</strong> probe.<br />
with constant current I is applied to the outer set <strong>of</strong> conductors, vertically spaced at<br />
10 mm. <strong>The</strong> inner set <strong>of</strong> conductors, spaced 3.3 mm apart, is used to measure the<br />
voltage drop V within this section <strong>of</strong> the potential field. All conductors are made <strong>of</strong><br />
1.5 mm thick stainless steel rings and are isolated from each other and the remainder<br />
<strong>of</strong> the pile. Combined, I and V yield the apparent resistance. <strong>The</strong> current I is derived<br />
from the measurement <strong>of</strong> a voltage V c over a reference resistor R ref , located in the<br />
power supply. <strong>The</strong> voltage drop in the <strong>soil</strong> V s is measured over two inner conductors.<br />
This yields:<br />
R<br />
V R<br />
s ref<br />
<strong>soil</strong><br />
= (1)<br />
Vc<br />
in which R <strong>soil</strong> is the apparent resistance. A schematized representation <strong>of</strong> the electrical<br />
field around such a sensor is shown in Figure 1. <strong>The</strong> change in R <strong>soil</strong> is converted to a<br />
porosity change by a calibrated linear relationship for each sensor. In order to allow<br />
this method to work properly saturated conditions are required, as well as a<br />
reasonable conductivity <strong>of</strong> the pore water. For this reason in all tests to the pore water<br />
NaCl was added to improve the <strong>measurements</strong>. Due to the averaging over a <strong>soil</strong> volume<br />
<strong>of</strong> about three times the probe diameter the method cannot distinguish porosity<br />
differences close the probe, or further than 15 mm into the far field. A full description<br />
<strong>of</strong> the measurement method is given in Dijkstra (2009).<br />
3 MODEL TESTS<br />
3.1 Test Setup & Preparation<br />
During preparation the probe, equipped with three instrument levels, is embedded<br />
into the saturated sand sample. A fourth reference sensor is placed on the bottom <strong>of</strong><br />
the sample. Figure 2 shows the geometry <strong>of</strong> the strongbox and the locations <strong>of</strong> the<br />
probe and additional sensor.
Due to the rather high temperature sensitivity <strong>of</strong> the resistance measurement<br />
method the temperature as well as the pore pressures is monitored near the reference<br />
sensor. <strong>The</strong> maximum temperature deviation found was approximately 0.02 o C,<br />
which has a negligible influence on the <strong>measurements</strong>. <strong>The</strong> pore pressures did not<br />
measure an appreciable change other than the effects <strong>of</strong> the increase <strong>of</strong> gravitational<br />
acceleration. <strong>The</strong>refore, the results are not shown.<br />
Next to the <strong>density</strong> <strong>measurements</strong> on the probe and in the sample, also the force on<br />
the (flat) base and on the top is registered during penetration.<br />
<strong>The</strong> sand was prepared by pumping it in suspension into the model container in<br />
which the probe was already fixed in place, and allowing the sand to settle. In this<br />
way the probe was initially embedded in the sand sample. A loose sample was obtained,<br />
with a porosity n <strong>of</strong> approximately 0.455. <strong>The</strong> sample could subsequently<br />
densified by a vertical shock wave propagating through the sample and allowing top<br />
and bottom drainage <strong>of</strong> the excess pore water at the same time. In this way porosities<br />
up to n = 0.382 were reached very consistently. During preparation care was taken to<br />
prevent excess vibration <strong>of</strong> both pile and model container. Still, <strong>density</strong> variations<br />
near the pile cannot be prevented by this method. This results in an uncertainty <strong>of</strong> the<br />
initial porosity near the pile at the start <strong>of</strong> the test. All tests have been performed in<br />
the beam centrifuge <strong>of</strong> Deltares (<strong>The</strong> Netherlands) at an acceleration level <strong>of</strong> 35g.<br />
Fig. 2: Model setup for geotechnical centrifuge tests (insert shows the mechanical dimensions <strong>of</strong> one<br />
instrument level).
3.2 Test Series<br />
Five tests have been performed where only initial porosity has been varied between<br />
loose and dense conditions (n 0 = 0.439 - 0.386), the dense and medium dense tests are<br />
repeated to test consistency. In the first test (n 0 = 0.386) an overshoot <strong>of</strong> the hydraulic<br />
plunger was observed. This was corrected by a progressive deceleration starting 2<br />
mm before the desired installation depth was reached. <strong>The</strong> penetration rate was 1<br />
mm/s at model scale.<br />
4 RESULTS<br />
4.1 Stress<br />
<strong>The</strong> measured base load is converted to a stress reading and the average shaft friction<br />
is derived from the difference <strong>of</strong> the head and base load divided with the embedded<br />
shaft surface area. <strong>The</strong> (submerged) weight <strong>of</strong> the probe is corrected for in the original<br />
force readings, before converting these to stress readings.<br />
Figures 3a & 3b show the base and shaft response during penetration, whereas in<br />
Figures 4a & 4b these results are plotted for the subsequent unloading reloading<br />
stage. <strong>The</strong> displacements are plotted on the vertical axis the stress readings are plotted<br />
horizontally.<br />
<strong>The</strong> duplex test show reproducible base resistances at 17-18 MPa for the dense conditions<br />
(n 0 = 0.386-0.389), and 6 MPa for the medium dense conditions (n 0 = 0.414-<br />
0.415). In the loose conditions (n 0 = 0.439) only one test is performed which yielded<br />
approximately 4 MPa.<br />
When the average shaft friction is compared, a gradually decreasing increase in<br />
shaft resistance with depth is found for the penetration in loose and medium conditions.<br />
<strong>The</strong> dense tests still show a constant linear increase with depth <strong>of</strong> the shaft friction.<br />
A distinct difference in shaft response is found for the two medium dense tests.<br />
One test is yielding a 37% lower shaft resistance.<br />
displacement (mm)<br />
0<br />
−20<br />
−40<br />
−60<br />
−80<br />
−100<br />
−120<br />
−140<br />
n 0<br />
= 0.439<br />
n 0<br />
= 0.415<br />
n 0<br />
= 0.414<br />
n 0<br />
= 0.389<br />
n 0<br />
= 0.386<br />
−160<br />
−180<br />
−200<br />
−5000 0 5000 10000 15000 20000<br />
Q (kPa)<br />
a) Base resistance
displacement (mm)<br />
0<br />
−20<br />
−40<br />
−60<br />
−80<br />
−100<br />
−120<br />
−140<br />
n 0<br />
= 0.439<br />
n 0<br />
= 0.415<br />
n 0<br />
= 0.414<br />
n 0<br />
= 0.389<br />
n 0<br />
= 0.386<br />
−160<br />
−180<br />
−200<br />
−20 −10 0 10 20 30 40 50 60 70<br />
Q (kPa)<br />
b) Average shaft friction during penetration<br />
Fig. 3: Evolution <strong>of</strong> the measured base resistance and shaft friction during penetration at 1 mm/s.<br />
4.2 Density Measurements<br />
<strong>The</strong> measured porosity change ∆n as measured during the penetration is plotted in<br />
Figures 4a-4c for one <strong>of</strong> the dense tests (n 0 = 0.389), one <strong>of</strong> the medium dense tests<br />
(n 0 = 0.414) and the loose test (n 0 = 0.439). Three data series are plotted in each Figure:<br />
one for each instrumentation level. <strong>The</strong> upper instrument level is not shifted and<br />
as a result <strong>of</strong> this starts at a displacement <strong>of</strong> 0 mm. the second instrument level is 90<br />
mm located below the top instrument level the plot for this instrument starts at -90<br />
mm. Finally, the first instrument level near the pile base is shifted 165 mm below the<br />
top instrument.<br />
<strong>The</strong> grey bands indicate the systematic error in the measured porosity change. For<br />
overlapping bands no significant differences have been measured.<br />
All tests and all instrument levels show an increase <strong>of</strong> porosity with an increase <strong>of</strong><br />
penetration. Most probably the initial porosity around the probe in the loose test is not<br />
as large as the average porosity in the complete sample, resulting in densification in<br />
the test.<br />
<strong>The</strong> densification notch around -200 mm is the moment when the instrument level<br />
is leaving the hole created by its installation in the suspended sand. This feature is<br />
found in all tests for all instrument levels.<br />
<strong>The</strong>se plots allow for the monitoring <strong>of</strong> the porosity change on a fixed depth below<br />
the surface. <strong>The</strong> arrival <strong>of</strong> a second instrument level at a certain depth shows a further<br />
increase in porosity<br />
5 CONCLUSIONS<br />
A new method to investigate the porosity change during penetration <strong>of</strong> a probe based<br />
on electrical resistance change is presented. Despite the uncertainty in the <strong>measurements</strong><br />
and the inability to measure absolute densities consistent qualitative results are<br />
obtained in the current tests.<br />
<strong>The</strong> installation <strong>of</strong> a probe in a non-cohesive material will quite significantly distort<br />
the <strong>soil</strong> located within one diameter around the probe. For in-situ <strong>density</strong> <strong>measurements</strong><br />
one has to consider this polluting effect <strong>of</strong> the probe installation on the den-
a) Loose; n 0 = 0.439<br />
b) medium dense; n 0 = 0.414<br />
c) dense; n 0 = 0.386<br />
Fig. 4: Evolution <strong>of</strong> the measured porosity change adjacent to the probe during penetration
sity <strong>measurements</strong>. <strong>The</strong> measured porosity change depends on the instrument location<br />
and is a function <strong>of</strong> the penetration distance. This support the sensitivity <strong>of</strong> the location<br />
<strong>of</strong> the friction sleeve as found in previous research, e.g. DeJong and Frost 2002.<br />
Regardless <strong>of</strong> the loose or dense initial conditions the <strong>soil</strong> near the probe loosened<br />
significantly during monotonic jacking.<br />
REFERENCES<br />
Been, K., Crooks, A. Becker, D.E. and Jeffries, M.G. (1986). <strong>The</strong> cone penetration<br />
test in sands: part I, state parameter interpretation. Géotechnique, 36(2), pp. 239-249.<br />
Bustamante, M. and Gianeselli, L. (1982). Pile Bearing capacity prediction by means<br />
<strong>of</strong> static penetrometer, Proc. 2nd European Symposium on penetration testing, Amsterdam,<br />
pp. 493-500.<br />
DeRuiter, J. and Beringen, F.L. (1979). Pile Foundations for Large North Sea Structures.<br />
Marine <strong>Geo</strong>technology, 3(3), pp. 267-314.<br />
DeJong, J.T. and Frost, J.D. (2002). A Multisleeve Friction Attachment for the Cone<br />
Penetrometer. <strong>Geo</strong>technical Testing Journal, 25(2), pp 111–127.<br />
Dijkstra, J. (2009), On the Modelling <strong>of</strong> Pile Installation, PhD <strong>The</strong>sis Delft University<br />
<strong>of</strong> Technology.<br />
Eiksund, G.R. (1994), Dynamic testing <strong>of</strong> piles, PhD <strong>The</strong>sis NTNU, Trondheim.<br />
Eslami, A. and Fellenius, B.H. (1997). Piezo-friction-cone penetrometer testing in<br />
s<strong>of</strong>t clays. Canadian <strong>Geo</strong>technical Journal, 34(6), pp. 886-904.<br />
Jamiolkowski, M., Ghionna, V.N., Lancellotta, R. and Pasqualini, E. (1988). New<br />
correlations <strong>of</strong> penetration tests for desing practice, Proc. 1st Intl. Symposium on<br />
Penetration Testing, Orlando, pp. 263-296.<br />
Karthikeyan, M., Tan, S.M., Mimura, M.,Yoshimura, M. and Tee, C.R.. (2007).<br />
Moisture Measurement by Neutron Moisture Cone Penetrometer: Design and Application.<br />
Soils & Foundations, 47(1), pp. 109-117.<br />
Ruygrok, P.A. (1977). Density measurement with the aid <strong>of</strong> nuclear radiation. LGMmededelingen,<br />
18(2/3), pp. 70-73.<br />
Schmertmann, J.H..(1978). Guidelines for Cone Penetration Test: Performance and<br />
Design, FHWA-TS-209.<br />
Shibata, T., Mimura, M., Shrivastava, A.K., and Nobuyama, M. (1992). Moisture<br />
Measurement by Neutron Moisture Cone Penetrometer: Design and Application.<br />
Soils & Foundations, 32(4), pp. 58-67.<br />
Teferra, A.(1974).Beziehungen zeischen Reibungswinkel, Lagerungsdichte und<br />
Sondierwiderständen nichtbindiger Böden mit verschiedener Kornverteilung, PhD<br />
<strong>The</strong>sis Technischen Hochschule Aachen.<br />
Telford, W. and Geldart, L. (1990). Applied <strong>Geo</strong>physics Second Edition. Cambridge<br />
University Press, Cambridge.<br />
Vlasblom, A. (1977). Electrical <strong>density</strong> <strong>measurements</strong>. LGM-mededelingen, 18(2/3),<br />
pp. 69-70.