
Create successful ePaper yourself
Turn your PDF publications into a flip-book with our unique Google optimized e-Paper software.
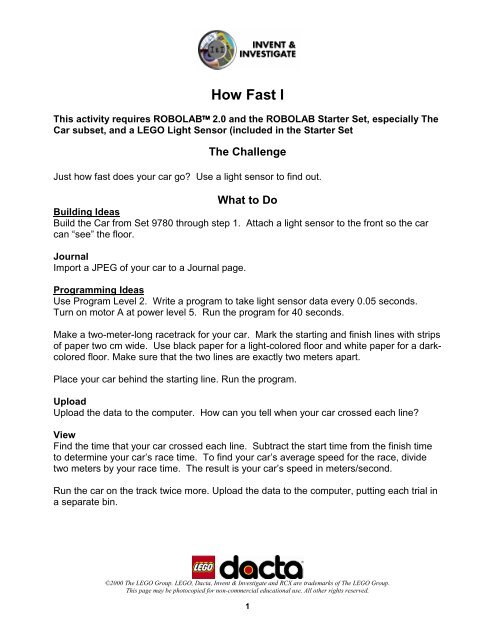
<strong>How</strong> <strong>Fast</strong> I<br />
This activity requires ROBOLAB 2.0 and the ROBOLAB Starter Set, especially The<br />
Car subset, and a LEGO Light Sensor (included in the Starter Set<br />
The Challenge<br />
Just how fast does your car go? Use a light sensor to find out.<br />
What to Do<br />
Building Ideas<br />
Build the Car from Set 9780 through step 1. Attach a light sensor to the front so the car<br />
can “see” the floor.<br />
Journal<br />
Import a JPEG of your car to a Journal page.<br />
Programming Ideas<br />
Use Program Level 2. Write a program to take light sensor data every 0.05 seconds.<br />
Turn on motor A at power level 5. Run the program <strong>for</strong> 40 seconds.<br />
Make a two-meter-long racetrack <strong>for</strong> your car. Mark the starting and finish lines with strips<br />
of paper two cm wide. Use black paper <strong>for</strong> a light-colored floor and white paper <strong>for</strong> a darkcolored<br />
floor. Make sure that the two lines are exactly two meters apart.<br />
Place your car behind the starting line. Run the program.<br />
Upload<br />
Upload the data to the computer. <strong>How</strong> can you tell when your car crossed each line?<br />
View<br />
Find the time that your car crossed each line. Subtract the start time from the finish time<br />
to determine your car’s race time. To find your car’s average speed <strong>for</strong> the race, divide<br />
two meters by your race time. The result is your car’s speed in meters/second.<br />
Run the car on the track twice more. Upload the data to the computer, putting each trial in<br />
a separate bin.<br />
©2000 The LEGO Group. LEGO, Dacta, Invent & Investigate and RCX are trademarks of The LEGO Group.<br />
This page may be photocopied <strong>for</strong> non-commercial educational use. All other rights reserved.<br />
1
Journal<br />
Create a Conclusions page and answer the following questions.<br />
1. <strong>How</strong> fast did your car go in meters/second? Find the average speed <strong>for</strong> your three<br />
trials.<br />
2. Did you get the same speed <strong>for</strong> each of the three trials? If not, why do you think your<br />
answers differed?<br />
Present<br />
Prepare a presentation of the activity. Include the picture of the car, a data page <strong>for</strong> each<br />
trial, and the Conclusions page.<br />
Extensions<br />
Is the car’s speed constant? Place a strip of paper every half-meter on your racetrack and<br />
run the car. Does the car take the same amount of time to travel each interval?<br />
Do It Yourself: Design your own car. Use the light sensor to measure its speed.<br />
©2000 The LEGO Group. LEGO, Dacta, Invent & Investigate and RCX are trademarks of The LEGO Group.<br />
This page may be photocopied <strong>for</strong> non-commercial educational use. All other rights reserved.<br />
2
Teacher’s <strong>Notes</strong> <strong>for</strong> <strong>How</strong> <strong>Fast</strong> I<br />
LEARNING OBJECTIVES<br />
__________________________________________________________________<br />
Students will understand:<br />
• <strong>How</strong> to use the data logging program with a sensor and a motor.<br />
• <strong>How</strong> to compare a graph to actual events.<br />
• <strong>How</strong> to calculate the speed of an object from distance and time measurements.<br />
• The importance of running multiple trials when collecting data.<br />
DISCUSSION<br />
__________________________________________________________________<br />
Building Ideas<br />
Students use the light sensor to find the average speed <strong>for</strong> a car on a two-meter-long<br />
course. The activity rein<strong>for</strong>ces the relationship between distance, time and speed.<br />
©2000 The LEGO Group. LEGO, Dacta, Invent & Investigate and RCX are trademarks of The LEGO Group.<br />
This page may be photocopied <strong>for</strong> non-commercial educational use. All other rights reserved.<br />
3
Students conduct three trials, comparing the data they obtain. The activity can be used to<br />
discuss sources of error and the importance of conducting multiple data runs.<br />
The car goes more slowly at first, since it is starting from a standstill. An alternative set-up<br />
would be to start the car one-half meter behind the first timing line, to give the car time to<br />
reach full speed.<br />
Programming Ideas<br />
This method can also be used to find the speeds of the cars in The <strong>Fast</strong>est Car activity<br />
(worksheet 5B). Students will need to shorten the time that the cars run from the <strong>for</strong>ty<br />
seconds given in the lab.<br />
Answers<br />
1. <strong>How</strong> fast did your car go in meters/second? Find the average speed <strong>for</strong> your three<br />
trials. Answers will vary.<br />
2. Did you get the same speed <strong>for</strong> each of the three trials? If not, why do you think your<br />
answers differed? Students will probably find small variations in the speeds they obtain.<br />
They may think that these differences reflect measurement error, actual differences in the<br />
speed of the car or both.<br />
©2000 The LEGO Group. LEGO, Dacta, Invent & Investigate and RCX are trademarks of The LEGO Group.<br />
This page may be photocopied <strong>for</strong> non-commercial educational use. All other rights reserved.<br />
4