Weather Station Handbook - Part 2C - Manual Weather Stations ...
Weather Station Handbook - Part 2C - Manual Weather Stations ...
Weather Station Handbook - Part 2C - Manual Weather Stations ...

You also want an ePaper? Increase the reach of your titles
YUMPU automatically turns print PDFs into web optimized ePapers that Google loves.
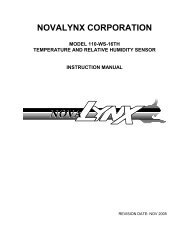
with the temperature trace. Alternatively. the calendar<br />
day maximum temperature may usually be obtained by<br />
taki ng addi tional observations after sunset or early the<br />
following morning. when a supplemental morning reading<br />
is taken, follow this procedure:<br />
At about 7 or 8 a.m. local time , read and reset the maximum<br />
thermometer, If the maximum temperature is<br />
higher than that recorded at yesterday's basic observation<br />
time, but well below the current temperature, the higher<br />
maximum temperature most likely occurred yesterdayafter<br />
the basic observation. Revise yesterday's data entry<br />
accordingly.<br />
When the maximum temperature is read in the morn <br />
ing, using standard liquid-in-glass thermometers , first<br />
read and record the minimum temperature; set the minimum<br />
thennometer last. This is done as a precaution<br />
against error (index dis placement) due to jarri ng of the<br />
minimum thermomete r when the maximu m thermometer<br />
is set (by spinning).<br />
23.3 Psychrometers<br />
For fire-weather obse rvations, the psychrometer (dry<br />
bulb and wet bulb thermometer) readings are usually<br />
recorded to the nearest degree (CF). Be sure to use the<br />
correct psychrometric tables, as designated for the station<br />
elevation (see table 7.1). Increased accuracy, if require d,<br />
can be obtained by recording to the nearest 0.5 or 0.1 "F<br />
an d interpolating in the psychrometric tables. This<br />
greeter resolution will be more significant at lower<br />
temperatures.<br />
CE!'l"ERAL OPERATING INSTRUcnONS<br />
These general instructions apply to all types of psyehrometers,<br />
although some differe nces occur for naturally<br />
ventilated types. Additional, specific details will follow.<br />
1. The two th ermometers should agree within one-half<br />
graduation when both are read as dry bulbs (wet-bulb<br />
wicking completely dry or removed). Thermomete rs having<br />
l_cF graduations should thus agree within 0.5 cF;<br />
those having 2_ cF graduations, within 1.0 "F. Closer<br />
agreement is advised at lower temperatures-within<br />
0.3 cF at 32 cF for thermometers having l_cF graduations.<br />
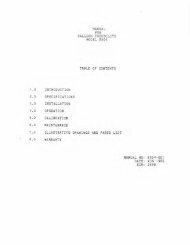
2. Wet-bulb wicking must be clean. snug fitting, and in<br />
good, unfrayed condition. It must thorough ly cover the<br />
bulb, with some overlap. Securi ng the wick by thread is<br />
commonly required, sometimes a tedious task, but closefitting<br />
wicking can merely be slipped over the bulb and<br />
pulled tight or secured only at the uppe r end. The wick<br />
should extend abou t one-half inch up the thermometer<br />
stem, above the bulb, and about three-fourths inch below<br />
the tip of the bulb (fig. 23.3).<br />
Change the wick at the first appearance of dirt, crust ,<br />
or discoloration-but at least every 4 weeks for psychrometers<br />
having daily use and constant exposure in<br />
an instrument shelter. Change the wick whene ver it becomes<br />
difficult to wet completely. Use of only clean .<br />
mineral-free water for observations ....i ll hel p prolong a<br />
wick's serviceability to 4 weeks.<br />
83<br />
Flgur. 23.:1-A properly ins talled psyctlromeler widI..
the maximum, minimum, and dry-bulb thermometers.<br />
Compare the differences over a number of days to see if<br />
there is a persistent diacrepancy or error. Make necessary<br />
alijustments (section 30.5).<br />
5. Compare the current relative humidity on the chart<br />
with that obtained from the psychrometer; compare the<br />
differences over a number of days. Also observe the relative<br />
humidity trace for evidence of too long or short a<br />
range. Make necessary adjustments (section 30.5).<br />
CHAPTER 24. WIND<br />
24.1 Average Windspeed<br />
The following instructions are for anemometers exposed<br />
at a 20-n standard height ( 20 n plus adjustment for<br />
nearby obstructions and surface irregularities; see section<br />
17.1). If the anemometer height is different from the 2O-ft<br />
standard. th e observed windspeed should be corrected as<br />
shown at the end of thi s section.<br />
Windspeed at an observation time ordinarily refers to<br />
the average speed over a period ofa few minutes or<br />
longer, which tends to smooth out gusts and lulls. A standard<br />
period of 10 minutes is used for fire-weather observations.<br />
Record the average to the nearest whole number<br />
(milh); a 0.5 decimal is raised to the next inte ger, Thus,<br />
an observed average windspeed of6.5 miIh is recorded as<br />
7 milh .<br />
Wherever possible , correct the observed windspeeds as<br />
specified in the anemometer manufacturer's instruction<br />
manual. Calibration tests of four anemometer models,<br />
reported by Haines and Frost (1984), indicate typical<br />
errors of ±O.5 to 1.5 miIh at wtndepeede from 5 to 40 milh .<br />
Procedures for obtaining average windspeed with<br />
several types of anemometers and their counter devices<br />
follow:<br />
CONTACTING M "EMOMETERS wrrn If. MILE<br />
CONTACfS<br />
Readout b y Reset Counter Equipped With<br />
Timer-<br />
1. Reset the counter to zero, ifnot done previ ously.<br />
2. Set the timer for exactly 10 minutes (in the case of<br />
fire-weather observations).<br />
3. When the timer stops, read counter.<br />
4. Obtain the 10-minute average windspeed in miles<br />
per hou r by placing a decimal point in front of the final<br />
digit read on counter.<br />
5. Reset the counter to zero.<br />
6. Ifthe average windspeed for a period other than 10<br />
minutes is desired, simply set timer for the desired num <br />
ber of minutes and divide the final count by that number.<br />
Readout by Reset Counter Withou t Timer-<br />
1. Reset the counter to zero, if not done previously.<br />
2. Start both the counter, using the "en-off" switch, and<br />
a stopwatch. Alternatively, a regular analog or digital<br />
watch may be used; start the counter when the digital<br />
watch reads 00 seconds or when the analog watch's second<br />
hand passes 12.<br />
87<br />
3. After exactly 10 minutes (in the case of fire-weather<br />
observa tions), stop the counter.<br />
4. Obtain the 10-min ute average windepeed in miles<br />
per hour by placing a decimal point in fron t of the final<br />
digit read on counter.<br />
5. Reset the counter to zero.<br />
6. If the average windspeed for a period other than 10<br />
minutes is desired, let the counter ru n for the desired<br />
number of minutes and divide final count by that number.<br />
Readout by Nonreset Counter-<br />
1. Record the initial reading of the counter.<br />
2. Start counter and stopwatch (see preceding set of<br />
instructions ifa stopwatch is not available).<br />
3. After exactly 10 minutes (for fire-weather observations),<br />
stop the counter.<br />
4. Record the final reading of the counter.<br />
5. Calculate the 10-minute average windspeed by subtracting<br />
the initial count from the final count. Place a<br />
decimal point in fron t of the resulting final digit.<br />
6. Ifthe average windapeed for a period other than 10<br />
minutes is desired, let counter run for the desired number<br />
of minutes, subtract the initial count from the final count,<br />
and divide by the number of minutes.<br />
Readout by Flasher or Buzzer-<br />
1. Close the switch, turning on the flasher or buzzer.<br />
2. lmmediately after the first flash or buzz, start stopwatch<br />
or record the time to nearest second shown on othe r<br />
type of watch.<br />
3. Count the number of flashes or buzzes for the desired<br />
time period (n umber of minutes).<br />
4. Open the switch, turning off the flasher or buzzer.<br />
5. Calculate the average windspeed by dividing total<br />
count by the number of minutes elapsed.<br />
A..""EMOMETERS WITII SE LF·CO:\"TAD."ED<br />
READour<br />
Rea dout by Self-Co ntaine d Counter-<br />
1. Record the initi al count (miles and ten ths).<br />
2. Record the count at end of time interval for which<br />
average windspeed is desired.<br />
3. Subtract the initial count from the final count. For<br />
short time inte rvals , divide the difference by the number<br />
of elapsed minutes and then multiply by 60, to obtain the<br />
average windspeed in miles per hour. For long time intervals,<br />
divide the difference by the equivalent number of<br />
hours and tenths.<br />
Readout by Self-Conta ined Dial-<br />
1. Read the dial at beginn ing of the period for which<br />
average speed is desired.<br />
8 . Read the inner dial first. The reading index for<br />
the inner dial is located in the outer dia l. It is a small<br />
"aero" through which is drawn a vertical line (fig. 24.1).<br />
The inner dial is graduated in tens and hundreds of miles.<br />
b. Read the outer dial. Its index is a small pointer<br />
located above and just to the len of the large dial (fig.<br />
24.1). When the glass cover is on the dial, seeing the<br />
index requires a slight shin in viewing angle. The outer<br />
dial is graduated in miles and tenths.
A<br />
c<br />
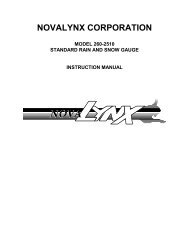
Agure 25.1--Qpetating procedlre lor Universal weighing gauge: A, remove ee collector. after releasing pen<br />
from chart; B, empty bud
E<br />
FIgu re 25.1 (Con.)<br />
Operation D uring Fr eezing <strong>Weather</strong>- For operation<br />
during the snow season (a nd freezing weather):<br />
1. Remove, by rota tion, the funnel attached at the bot <br />
tom of the collector; store indoors in a convenient place .<br />
2. Place an antifreeze solution in the bucket. A solu <br />
tion of calcium chloride was widely used in the past, but<br />
this has been replaced by ethylene glycol as the prescribed<br />
agent (U.s. Department of Commerce 1972). The<br />
standard charge is 1 quart, consisting of24 0% et hylene<br />
glycol plus 8 0 %light oil (such as SAE 10 motor oil. transfonner<br />
oil, or mineral oil) to prevent evaporation; no wa <br />
te r is added.<br />
Despite a higher cost, as compared with calcium chloride,<br />
an eth lylene glycol preparation (automobile an tifreeze)<br />
has the advantage ofbeing noncorrosive. It also<br />
minimizes th e cha nce or top freezing; as it dOE'S not settle<br />
as readily as a calcium chloride solution.<br />
Ethylene glycol, however, is toxic to plants and animals,<br />
even in small amounts, and thus spills should be avoided.<br />
It should never be drained onto the ground for disposal.<br />
The National <strong>Weather</strong> Service has most recently planned<br />
to convert to nontoxic propylene glycol (Blackburn 1988).<br />
3. Addition of the ethylene glycol. antifreeze solution<br />
will raise the zero position of th e pen ann to between 1<br />
and 2 inches on the recording chart. Using the fine adjustment<br />
thumbscrew, raise or lower the pen until it rests<br />
on the nearest hori zontal line. This will simplify the<br />
reading of precipitation amounts.<br />
4. Stir the antifreeze solution occasionally, particularly<br />
after preci pitation occurs, to help maintain a unifonn<br />
mixture.<br />
5. Let precipitation accumula te in the bucket until the<br />
an tifreeze becomes too diluted to prevent freezing or until<br />
95<br />
the pen reaches about 5 inches on the chart. When this<br />
occurs, empty the bucket and recharge with antifreeze if<br />
still requi red.<br />
PUNCHEI).TAPE RE CORDER<br />
Only a general outline of operating instructio ns will be<br />
given here, as this type of gauge has been operated mostly<br />
under supervision of the NWS. Basically (U.S. Department<br />
of Comme rce 1972), the observer should:<br />
1. Inspect the gauge weekly to determine that the tape<br />
is at the correct time, Also, rea d and record the precipi tation<br />
accumulation shown by the gauge's indicator dial.<br />
2. Empty the bucket whenever an eccumuleticn in<br />
excess of 10 inches is noted on the indicator dial.<br />
3. Remove the funnel for operation during the snow<br />
season. Empty the bucket and add enrifreeze-c-z quarts<br />
of the solution described in the Unive rsal gauge instructions.<br />
The indicator dial will then read between 2 and 3<br />
inches . Empty and replace antifreeze, if still necessary,<br />
when the dial reads 10 inches.<br />
4. After the end of each month, rem ove recorded porticn<br />
of the tape supply and re thread remaining tape. Install<br />
a ne w roll of tape if the present supply is insufficient<br />
for the coming month.<br />
TIPPING BUCKET GAUGE<br />
Observations with this type of gauge basically consist<br />
of reading the connected event recorder chart or digital<br />
counter. Precipita tion for the observational period, or for<br />
any desired time interval, is determined by the corre <br />
sponding number of O.OI -inch ste ps on the chart or the<br />
difference In counter rea dings. Ifdesired, the counter<br />
may be reset to zero after each observation.<br />
To obtain supplemental stick measurements from<br />
gauges that have a reservoir:<br />
1. Place the tipping bucket gauge's measuring tube<br />
directly underneath , open the drainccck, and collect the<br />
discharged wate r.<br />
2. Insert the tipping bucket gauge's measuring stick<br />
slowly into the tube, until the stick touches bottom , and<br />
read the graduation nearest to the waterline. (IJo not use<br />
the measuring stick from the standard 8-inch rai n gau ge.)<br />
3_ Ifmore than one tubeful of water is contained in the<br />
reservoir, add the measurements. (Dreinccck should be<br />
dosed just as the tube fills to brim, then reopened for<br />
additional water after the tube has bee n emptied and<br />
again placed beneath the drain.)<br />
4. When the reservoir is empty, dose the draincock.<br />
5_ Compare the stick total with the total shown for the<br />
same time period on the recorder chart or counter. Stick<br />
amounts may be slightly higher than the originally recorded<br />
(chart or counter) am ounts in cases of intense<br />
rainfall (section 9.2). The original amounts can be corrected<br />
accordingly. Stick amounts that are lower than the<br />
recorded amounts may result from evaporation of water in<br />
the reservoir, especially if the measurement has been<br />
delayed.
25.3 Storage Gauges<br />
Storage gauge prKipitation amount&, such as eccumulau<br />
d seasonal or annual totals. may he- accurately determined<br />
by either dppth or weight meesuremente. A stick<br />
or tape is used for the depth measurements. Depending<br />
on the type of gauge. weight measurements (USDA SCS<br />
1972) are either (1) rhcee of the gauge and ita conte nts<br />
or (2) thoee of an auxiliary bucket containing contents<br />
drained from th e gauge. In either case. the depth should<br />
be mea sured befor e drai ning, to se rve as a chec k on the<br />
total weighed con te nts. Thi s precaution will provide<br />
backup in ease ofaccidental spill or calculation error.<br />
WEIGIIISG PROCEDURE<br />
For detennining the preeipitarion by weighing, an accu <br />
rate hand scale with at least 40 pounds capacity should be<br />
used-preferably tht> type shewn in figure 9.3. which<br />
gives direct rea dings in inches ofpl'Pcipitation caught in<br />
a gauge with an 8-inch-diameter orifice . 1lw reedings are<br />
divided by 2.25 if this scale is used with a gauge having a<br />
12-inch-diametE'r orifice . Alwa)'s check the scales before<br />
UR and adjust if m'cessary, by me-ans ofa screw, to be<br />
sure- that the pointer is set at zero. In re-ading the scales,<br />
be sure to count the revolutions. Be sure that the attached<br />
gauge or auxiliary bucket is hanging freely .<br />
To calculate the precipita tion amount, subtract from<br />
the scale total the we-ightor equivale-nt inches of antifre-eze<br />
solution (measure-d when this charge is poured into<br />
t he storage gauge). Also subtract the weight of the empty<br />
gauge or auxiliary bucket, whichever is included in the<br />
weighing process.<br />
In heavy precipitation areas, particularly whe-re- the<br />
storage gauge catch is we-ighedout only annually or seasonally,<br />
the amount to be weighed will cnen exceed the<br />
scale capacity. In these eases, the weigh ing is done in<br />
incr e-ments of the total catch. Specific weighing in structions<br />
follow:<br />
Sacramento , Standpipe, a nd Can-Cone Gauge_<br />
Annual measureme-nts are usually made-in summer or<br />
ea rly autumn, when the gauge contents should be entirely<br />
in liquid form .<br />
1. Open the- drainc:ock and allo w the gauge contents to<br />
run into a weighi ng bucket; to avoid possible spill , close<br />
the drain before the level of liquid inside the bucket exceeds<br />
a safe lim it.<br />
2. Weigh the contents of the bucket and record the<br />
scale reading (equivalent inches).<br />
3. Empty the bucket, reopen the drainrock, and repeat<br />
the filling and weighing steps. Repeat the process as<br />
many times as nece-ssary until the gauge-is completely<br />
drained.<br />
4. Add the individual scale readings.<br />
5. Subtract from thi s total the weight of the empty<br />
bucke-t, multiplied by the- num ber of weighi ngs.<br />
6. Also subtract the amount of antifree ze solution,<br />
which was measu red in advance of its use.<br />
96<br />
Straight-8ided Can_Thew ga uges, particularly the<br />
shorter (24-inch) can s, are commonly weighed together<br />
with their rontents. A small hole is drilled near the top<br />
of the can for suspension from the ecetee . lfthe weightm<br />
the gauge and its eontente exceeds the ecale capacity,<br />
however, exceu liquid or all ofthE' liquid may be poured<br />
or drained from the gauge into an auxiliary bucket-in<br />
incremental step- as necessary.<br />
1. Record and add t he individual scale readings.<br />
2. From this tota l, subtract the weight of the empty<br />
bucket for each time it was used.<br />
3. Also subtract the weight of the empty can (gauge)<br />
if the can was incl uded in the weighing process.<br />
4. Subtract the premeasured amount of antifreeze<br />
solution.<br />
25.4 Measurement of Snowfall and<br />
Snow Depth<br />
S:O-;OWFALL<br />
Sncwfell, the depth of newly fallen snow or ice pellets<br />
(sleet), should be measured concurrent with the snowfall<br />
water content {8t'ction 25.l}-as soon as possible efber th.<br />
snow has ended. Promptness should reduce errors that<br />
can result from melting, settling, or wind action. Snowfall<br />
can be measured on a previously bare or cleared grass<br />
surface, on an already existing snow surface (with identifiable<br />
crust), or on a snow board or other suitable surface<br />
that retains the snow.<br />
1. Insert the rain gauge measuring stick, or a sturdier<br />
ruler if necessary, vertically into the snow until it rests on<br />
the measureme-nt surface. 'When a grass su rface is used,<br />
be sure the stick is pushed only to the bottom ofthe snow<br />
layer- not lower into the grass bledee.<br />
2. Read the snowfall depth to the nearest tenth of an<br />
inch (for example, 2.3 inches or 6.6 inches). This will be<br />
the actual linear measure on the rain gauge measuring<br />
stick (10 times the stick's scale reading in hundredths of<br />
an inch).<br />
3. Repeat the- measurement at several spots and calculate<br />
an average. Variations betwe-en measure ment spots<br />
are commonplace an d may result from uneven ground<br />
surfaces, differences in me-lting, and wind action. Avoid<br />
locations that are he-avily drifted or blown clear.<br />
4. Any snow cores used for measuring water content<br />
(section 25.1) should be taken from spots having an average,<br />
representative snowfall depth as determined above .<br />
Vr'h.re a snow board is employed, it can be used for 0btaining<br />
both the snowfall depth and a snow core.<br />
5. Wh ere a cleared or identifiable surface is difficult to<br />
find, snowfall may be approximate-d by subtracting the<br />
previously measured total snow depth (see following subsection)<br />
from the curr ent snow depth . Th e result will be<br />
too low if the snow cover is compactin g, which is often the<br />
case with heavy sno wfall. If all of the precipitation duri ng<br />
an obse rvation period has been fIOn melt i ng snow, the<br />
recorded snowfall sh ould probably be at least 10 times the<br />
melted gauge catch . Thus, with a gauge catch of 0.25 inch<br />
water, the sno wfall shoul d be 2.5 inches or greate-r.
••<br />
98<br />
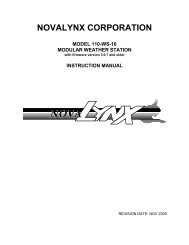
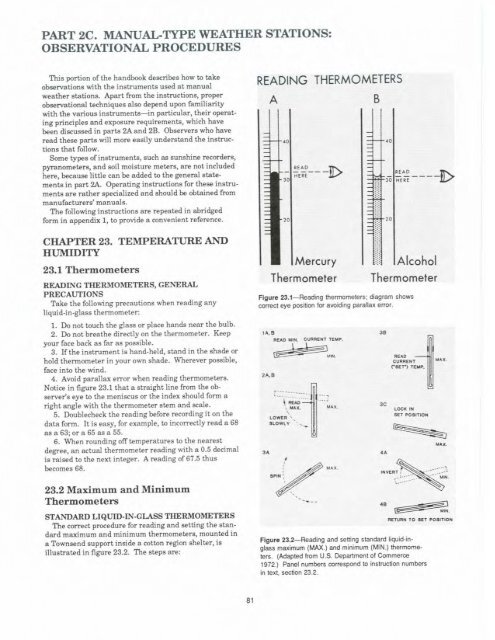
Agw. 2G.2- WetgtWig..W 1T'IOlSU'8 lllc* 0t'I<br />
Fores18t scale: klp Ieh, remove c1J5I, dirt, ee.: top<br />
righl carefuly hang slick on seale: bonom, dose<br />
door to prot9Ct s1idl.!rom wind .
Flgur. 26.8-Checking tile balance of triple beam balance<br />
Read 100 gm. Here<br />
·- " ...... -_...:L.oo. .<br />
Read 4 .8 gm. Here<br />
Agur. 26.t-Weighing the lueI slick with ttiple beam balance. The stidl weigl'ls 1048<br />
grams . so its rnoisue content is 5 percent as indcaled on 1M firsl scale bar.<br />
101