PCCPwww - Inorganic Chemistry and Catalysis
PCCPwww - Inorganic Chemistry and Catalysis
PCCPwww - Inorganic Chemistry and Catalysis

Create successful ePaper yourself
Turn your PDF publications into a flip-book with our unique Google optimized e-Paper software.
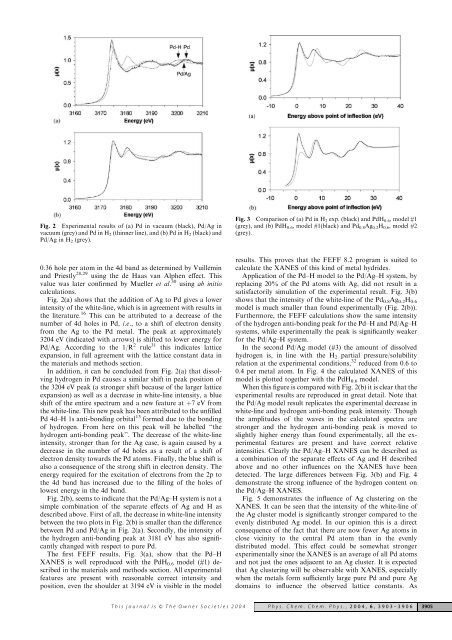
Fig. 2 Experimental results of (a) Pd in vacuum (black), Pd/Ag in<br />
vacuum (grey) <strong>and</strong> Pd in H 2 (thinner line), <strong>and</strong> (b) Pd in H 2 (black) <strong>and</strong><br />
Pd/Ag in H 2 (grey).<br />
Fig. 3 Comparison of (a) Pd in H 2 exp. (black) <strong>and</strong> PdH 0.6 , model #1<br />
(grey), <strong>and</strong> (b) PdH 0.6 , model #1(black) <strong>and</strong> Pd 0.8 Ag 0.2 H 0.6 , model #2<br />
(grey).<br />
0.36 hole per atom in the 4d b<strong>and</strong> as determined by Vuillemin<br />
<strong>and</strong> Priestly 28,29 using the de Haas van Alphen effect. This<br />
value was later confirmed by Mueller et al. 30 using ab initio<br />
calculations.<br />
Fig. 2(a) shows that the addition of Ag to Pd gives a lower<br />
intensity of the white-line, which is in agreement with results in<br />
the literature. 16 This can be attributed to a decrease of the<br />
number of 4d holes in Pd, i.e., to a shift of electron density<br />
from the Ag to the Pd metal. The peak at approximately<br />
3204 eV (indicated with arrows) is shifted to lower energy for<br />
Pd/Ag. According to the 1/R 2 rule 31 this indicates lattice<br />
expansion, in full agreement with the lattice constant data in<br />
the materials <strong>and</strong> methods section.<br />
In addition, it can be concluded from Fig. 2(a) that dissolving<br />
hydrogen in Pd causes a similar shift in peak position of<br />
the 3204 eV peak (a stronger shift because of the larger lattice<br />
expansion) as well as a decrease in white-line intensity, a blue<br />
shift of the entire spectrum <strong>and</strong> a new feature at þ7 eV from<br />
the white-line. This new peak has been attributed to the unfilled<br />
Pd 4d–H 1s anti-bonding orbital 13 formed due to the bonding<br />
of hydrogen. From here on this peak will be labelled ‘‘the<br />
hydrogen anti-bonding peak’’. The decrease of the white-line<br />
intensity, stronger than for the Ag case, is again caused by a<br />
decrease in the number of 4d holes as a result of a shift of<br />
electron density towards the Pd atoms. Finally, the blue shift is<br />
also a consequence of the strong shift in electron density. The<br />
energy required for the excitation of electrons from the 2p to<br />
the 4d b<strong>and</strong> has increased due to the filling of the holes of<br />
lowest energy in the 4d b<strong>and</strong>.<br />
Fig. 2(b), seems to indicate that the Pd/Ag–H system is not a<br />
simple combination of the separate effects of Ag <strong>and</strong> H as<br />
described above. First of all, the decrease in white-line intensity<br />
between the two plots in Fig. 2(b) is smaller than the difference<br />
between Pd <strong>and</strong> Pd/Ag in Fig. 2(a). Secondly, the intensity of<br />
the hydrogen anti-bonding peak at 3181 eV has also significantly<br />
changed with respect to pure Pd.<br />
The first FEFF results, Fig. 3(a), show that the Pd–H<br />
XANES is well reproduced with the PdH 0.6 model (#1) described<br />
in the materials <strong>and</strong> methods section. All experimental<br />
features are present with reasonable correct intensity <strong>and</strong><br />
position, even the shoulder at 3194 eV is visible in the model<br />
results. This proves that the FEFF 8.2 program is suited to<br />
calculate the XANES of this kind of metal hydrides.<br />
Application of the Pd–H model to the Pd/Ag–H system, by<br />
replacing 20% of the Pd atoms with Ag, did not result in a<br />
satisfactorily simulation of the experimental result. Fig. 3(b)<br />
shows that the intensity of the white-line of the Pd 0.8 Ag 0.2 H 0.6<br />
model is much smaller than found experimentally (Fig. 2(b)).<br />
Furthermore, the FEFF calculations show the same intensity<br />
of the hydrogen anti-bonding peak for the Pd–H <strong>and</strong> Pd/Ag–H<br />
systems, while experimentally the peak is significantly weaker<br />
for the Pd/Ag–H system.<br />
In the second Pd/Ag model (#3) the amount of dissolved<br />
hydrogen is, in line with the H 2 partial pressure/solubility<br />
relation at the experimental conditions, 32 reduced from 0.6 to<br />
0.4 per metal atom. In Fig. 4 the calculated XANES of this<br />
model is plotted together with the PdH 0.6 model.<br />
When this figure is compared with Fig. 2(b) it is clear that the<br />
experimental results are reproduced in great detail. Note that<br />
the Pd/Ag model result replicates the experimental decrease in<br />
white-line <strong>and</strong> hydrogen anti-bonding peak intensity. Though<br />
the amplitudes of the waves in the calculated spectra are<br />
stronger <strong>and</strong> the hydrogen anti-bonding peak is moved to<br />
slightly higher energy than found experimentally, all the experimental<br />
features are present <strong>and</strong> have correct relative<br />
intensities. Clearly the Pd/Ag–H XANES can be described as<br />
a combination of the separate effects of Ag <strong>and</strong> H described<br />
above <strong>and</strong> no other influences on the XANES have been<br />
detected. The large differences between Fig. 3(b) <strong>and</strong> Fig. 4<br />
demonstrate the strong influence of the hydrogen content on<br />
the Pd/Ag–H XANES.<br />
Fig. 5 demonstrates the influence of Ag clustering on the<br />
XANES. It can be seen that the intensity of the white-line of<br />
the Ag cluster model is significantly stronger compared to the<br />
evenly distributed Ag model. In our opinion this is a direct<br />
consequence of the fact that there are now fewer Ag atoms in<br />
close vicinity to the central Pd atom than in the evenly<br />
distributed model. This effect could be somewhat stronger<br />
experimentally since the XANES is an average of all Pd atoms<br />
<strong>and</strong> not just the ones adjacent to an Ag cluster. It is expected<br />
that Ag clustering will be observable with XANES, especially<br />
when the metals form sufficiently large pure Pd <strong>and</strong> pure Ag<br />
domains to influence the observed lattice constants. As<br />
This journal is & The Owner Societies 2004<br />
Phys. Chem. Chem. Phys., 2004, 6 , 3903–3906 3905