FACT SHEET - American Meat Institute
FACT SHEET - American Meat Institute
FACT SHEET - American Meat Institute

Create successful ePaper yourself
Turn your PDF publications into a flip-book with our unique Google optimized e-Paper software.
<strong>FACT</strong> <strong>SHEET</strong><br />
U.S. <strong>Meat</strong> and Poultry<br />
Production & Consumption:<br />
An Overview<br />
The meat and poultry<br />
industry is the largest<br />
segment of United States<br />
agriculture. Total meat<br />
and poultry production in<br />
2003 reached more than 85<br />
billion pounds. Annual<br />
sales for 2002, the last year<br />
for which statistics are<br />
available, are estimated<br />
at more than $119 billion<br />
among the meat packing,<br />
meat processing and poultry<br />
processing industries.<br />
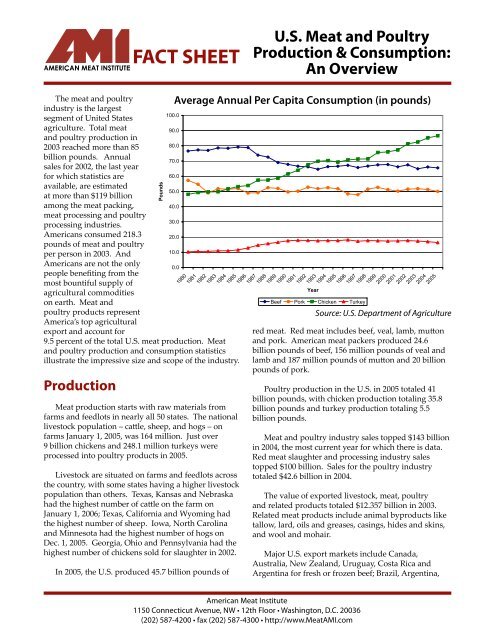
<strong>American</strong>s consumed 218.3<br />
pounds of meat and poultry<br />
per person in 2003. And<br />
<strong>American</strong>s are not the only<br />
people benefiting from the<br />
most bountiful supply of<br />
agricultural commodities<br />
on earth. <strong>Meat</strong> and<br />
poultry products represent<br />
America’s top agricultural<br />
export and account for<br />
9.5 percent of the total U.S. meat production. <strong>Meat</strong><br />
and poultry production and consumption statistics<br />
illustrate the impressive size and scope of the industry.<br />
Production<br />
<strong>Meat</strong> production starts with raw materials from<br />
farms and feedlots in nearly all 50 states. The national<br />
livestock population – cattle, sheep, and hogs – on<br />
farms January 1, 2005, was 164 million. Just over<br />
9 billion chickens and 248.1 million turkeys were<br />
processed into poultry products in 2005.<br />
Livestock are situated on farms and feedlots across<br />
the country, with some states having a higher livestock<br />
population than others. Texas, Kansas and Nebraska<br />
had the highest number of cattle on the farm on<br />
January 1, 2006; Texas, California and Wyoming had<br />
the highest number of sheep. Iowa, North Carolina<br />
and Minnesota had the highest number of hogs on<br />
Dec. 1, 2005. Georgia, Ohio and Pennsylvania had the<br />
highest number of chickens sold for slaughter in 2002.<br />
In 2005, the U.S. produced 45.7 billion pounds of<br />
Pounds<br />
100.0<br />
Average Annual Per Capita Consumption (in pounds)<br />
90.0<br />
80.0<br />
70.0<br />
60.0<br />
50.0<br />
40.0<br />
30.0<br />
20.0<br />
10.0<br />
0.0<br />
1980<br />
1981<br />
1982<br />
1983<br />
1984<br />
1985<br />
1986<br />
1987<br />
1988<br />
1989<br />
1990<br />
1991<br />
1992<br />
1993<br />
Year<br />
Beef Pork Chicken Turkey<br />
1994<br />
1995<br />
1996<br />
1997<br />
1998<br />
1999<br />
2000<br />
2001<br />
2002<br />
2003<br />
2004<br />
2005<br />
Source: U.S. Department of Agriculture<br />
red meat. Red meat includes beef, veal, lamb, mutton<br />
and pork. <strong>American</strong> meat packers produced 24.6<br />
billion pounds of beef, 156 million pounds of veal and<br />
lamb and 187 million pounds of mutton and 20 billion<br />
pounds of pork.<br />
Poultry production in the U.S. in 2005 totaled 41<br />
billion pounds, with chicken production totaling 35.8<br />
billion pounds and turkey production totaling 5.5<br />
billion pounds.<br />
<strong>Meat</strong> and poultry industry sales topped $143 billion<br />
in 2004, the most current year for which there is data.<br />
Red meat slaughter and processing industry sales<br />
topped $100 billion. Sales for the poultry industry<br />
totaled $42.6 billion in 2004.<br />
The value of exported livestock, meat, poultry<br />
and related products totaled $12.357 billion in 2003.<br />
Related meat products include animal byproducts like<br />
tallow, lard, oils and greases, casings, hides and skins,<br />
and wool and mohair.<br />
Major U.S. export markets include Canada,<br />
Australia, New Zealand, Uruguay, Costa Rica and<br />
Argentina for fresh or frozen beef; Brazil, Argentina,<br />
<strong>American</strong> <strong>Meat</strong> <strong>Institute</strong><br />
1150 Connecticut Avenue, NW • 12th Floor • Washington, D.C. 20036<br />
(202) 587-4200 • fax (202) 587-4300 • http://www.<strong>Meat</strong>AMI.com
AMI Fact Sheet: U.S. <strong>Meat</strong> and Poultry Production & Consumption: An Overview<br />
Canada, Mexico and Costa Rica for processed or<br />
canned beef; Canada and the European Union for fresh<br />
or frozen pork; and Canada, the European Union,<br />
Denmark and Poland for processed or canned pork.<br />
In 2005, the U.S. exported about 2.3 million metric<br />
tons of chicken and 232,900 metric tons of turkey<br />
products to major foreign markets such as the Russian<br />
Federation, Latvia, Canada, Hong Kong, Taiwan and<br />
Mexico. The Russian Federation imported the most<br />
U.S. chicken in 2005, purchasing more than 760,600<br />
metric tons. Mexico imported the bulk of U.S. turkey<br />
in 2005, purchasing 153,000 metric tons. The value<br />
of poultry exports to major markets totals nearly $1.6<br />
billion.<br />
Consumption<br />
<strong>Meat</strong> and poultry consumption is best measured<br />
on a retail weight basis, which refers to the weight of<br />
the meat purchased at retail stores. In 2005, per capita<br />
consumption of red meat, poultry and fish was 201.8<br />
pounds. A little more than half (54 percent) of all meat<br />
consumed are red meat products—beef, veal, lamb,<br />
mutton and pork. Poultry comprises 36.8 percent of<br />
meat consumption and fish comprises 8.1 percent.<br />
Pork consumption has remained fairly stable over<br />
the last two decades, USDA data show. Annual per<br />
capita pork consumption reached a high of 60.5 pounds<br />
in 1971 and a low of 42.9 pounds in 1975. In 2005, per<br />
capita consumption was 50 pounds.<br />
Beef consumption has trended downward since<br />
the 1970s. Per capita consumption of beef reached an<br />
all-time high of 94.3 pounds in 1976 when beef supplies<br />
were at record levels because of the liquidation of the<br />
nation’s beef herd. Beef consumption has continued<br />
to decline in the 1980s and 1990s, but over the past<br />
ten years has remained at an average of 66.4 pounds<br />
per capita. In 2005, per capita beef consumption was<br />
66.5 pounds. <strong>American</strong>s consumed 33.5 pounds of<br />
hamburger and 32 pounds of other beef cuts per capita<br />
in 2003.<br />
Veal and lamb consumption in the U.S. is small<br />
relative to other products. <strong>American</strong>s consumed .5<br />
pounds per capita of veal and .8 pounds per capita of<br />
lamb in 2005.<br />
Per capita consumption of chicken and turkey has<br />
increased dramatically since the 1970s, according to<br />
USDA data. Chicken consumption rose from 40.3<br />
pounds per person in 1970 to 86.6 pounds per person<br />
in 2005. Turkey consumption climbed from 8.1 pounds<br />
per person in 1970 to 16.4 pounds per person in 2005.<br />
Consumer Expenditures<br />
Over an 11-year period, consumer spending on<br />
fresh meat—beef, veal, lamb and pork—climbed<br />
from $27 million in 1988 to nearly $29 million in 1999,<br />
according to statistics compiled by Supermarket<br />
Business Magazine.<br />
Consumers increased their spending on poultry<br />
products from more than $10 million in 1988 to more<br />
than $18 million in 1999. To put that in perspective,<br />
grocery sales topped $310 million in 1988 and $414<br />
million in 1998.<br />
Consumers have increased their spending at<br />
grocery store delis from $9.5 million in 1988 to $24.4<br />
million in 1999, according to statistics compiled by<br />
Supermarket Business Magazine. Statistics and<br />
anecdotal evidence point to a growing trend of<br />
consumers purchasing home meal replacements—fully<br />
cooked or heat and serve meals—from grocery store<br />
delis.<br />
Per capita, <strong>American</strong>s in 2005 spent $268.12 on beef,<br />
$141.09 on pork, $148.27 on chicken and $17.48 on<br />
turkey. In 1970, <strong>American</strong>s spent $86.02 on beef, $42.80<br />
on pork, $15.22 on chicken and $4.54 on turkey.<br />
Consumers spent an average of $2.30 per pound on<br />
hamburger last year and $4.09 per pound for choice<br />
beef cuts. Choice beef cuts can include loins, ribeyes,<br />
chuck and flank steaks.<br />
Helpful Links<br />
U.S. Department of Agriculture<br />
Economic Research Service<br />
http://www.ers.usda.gov<br />
© March 2007 <strong>American</strong> <strong>Meat</strong> <strong>Institute</strong>