A Comprehensive Introduction to Water Footprints
A Comprehensive Introduction to Water Footprints
A Comprehensive Introduction to Water Footprints

You also want an ePaper? Increase the reach of your titles
YUMPU automatically turns print PDFs into web optimized ePapers that Google loves.
Assessing the water footprin<strong>to</strong>f crop and animal products<strong>Water</strong> footprint of a crop• Crop water use (m 3 /ha) / Crop yield (<strong>to</strong>n/ha)<strong>Water</strong> footprint of an animal• Sum of water for feed, drinking and servicing<strong>Water</strong> footprint of a crop or lives<strong>to</strong>ck product• Distribute the water footprint of the root product over its derivedproductsThe water footprint (m 3 /<strong>to</strong>n) of primary crops can be calculated as the crop wateruse at field level (m 3 /ha) divided by the crop yield (<strong>to</strong>n/ha). The crop water usedepends on the crop water requirement on the one hand and the actual soil wateravailable on the other hand. When a primary crop is processed in<strong>to</strong> a cropproduct (e.g. paddy rice processed in<strong>to</strong> brown rice), the water footprint of theprocessed product is calculated by dividing the water footprint of the primaryproduct by the so-called product fraction (i.e. the weight of crop product in <strong>to</strong>nobtained per <strong>to</strong>n of primary crop). If a primary crop is processed in<strong>to</strong> twodifferent products or more (for example soybean processed in<strong>to</strong> soybean flourand soybean oil), we need <strong>to</strong> distribute the water footprint of the primary crop <strong>to</strong>its products. We do this proportionally <strong>to</strong> the value of the crop products.The water footprint of an animal refers <strong>to</strong> the <strong>to</strong>tal sum of water used for feed,drinking and servicing. The water footprint of a lives<strong>to</strong>ck product is calculatedbased on product and value fractions, in a similar way as in the case of derivedcrop products.7
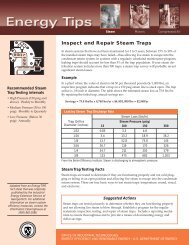
Crop water requirement1. Calculate reference crop evapotranspiration ET 0 (mm/day)e.g. Penman-Monteith equation2. Calculate crop evapotranspiration Et c (mm/day)Et c =ET 0 × K c where K c = crop coefficient3. Calculate crop water requirement CWR (m 3 /ha)CWR = Σ Et c [accumulate over growing period]The water requirement of a crop can be estimated based on climate data (liketemperature, wind speed, etc.) and crop characteristics. Various models areavailable <strong>to</strong> estimate crop water requirements. A common model is the CropWatmodel of the Food and Agriculture Organization (FAO), which is freely availableonline.Pho<strong>to</strong>: wheat field.8
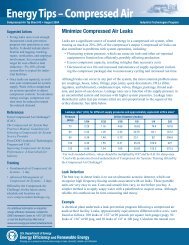
Irrigation requirementIrrigation requirement = crop water requirement – effective rainfallWhen rainfall does not meet the crop water requirement, the gap is the irrigationwater requirement. When the irrigation water requirement is supplied indeed,growing conditions are optimal (provided that other fac<strong>to</strong>rs like nutrientavailability are optimal as well). If the irrigation requirement is not met or onlypartly, the yield is likely <strong>to</strong> be lower than optimal. The yield reduction dependson the volumes and timing of the water shortages.Picture: Pivot irrigation on cot<strong>to</strong>n.9
Crop water useGreen water use by crop =min (crop water requirement, effective precipitation)Blue water use by crop =min (irrigation requirement, effective irrigation)Green water use refers <strong>to</strong> the volume of rainwater that evaporates from a cropfield during the growing period. Blue water use refers <strong>to</strong> the volume of irrigationwater (withdrawn from surface or ground water) that evaporates from a crop fieldduring the growing period. The distinction between green and blue water hasbeen introduced by Malin Falkenmark, Swedish hydrologist.10
Grey water footprint• volume of polluted freshwater that associates with the production ofa product in its full supply-chain.• calculated as the volume of water that is required <strong>to</strong> dilute pollutants<strong>to</strong> such an extent that the quality of the water remains above agreedwater quality standards.Source of pho<strong>to</strong>: Cunningham et al. (2003) p.448-45611
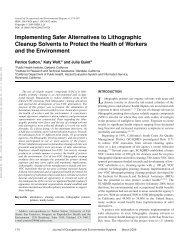
Production chaincot<strong>to</strong>nCot<strong>to</strong>n seedHulling/extraction0.160.470.510.33Cot<strong>to</strong>n seed oilCot<strong>to</strong>n seedcake1.071.00Cot<strong>to</strong>n seed oil,refinedCot<strong>to</strong>n plantHarvestingSeed-cot<strong>to</strong>n0.630.18Ginning0.100.20Cot<strong>to</strong>n linters0.350.820.050.10Garnetted s<strong>to</strong>ckCot<strong>to</strong>n lint1.001.00Cot<strong>to</strong>n, notcarded or combedCarding/Spinning0.950.99Cot<strong>to</strong>n, carded orcombed (yarn)0.950.99Knitting/weaving0.050.10Grey fabricYarn wasteWet processingLegend0.350.82Product fractionValue fraction1.001.00FabricFinishing1.001.00Final textileA cot<strong>to</strong>n shirt is made from cot<strong>to</strong>n fabric, which is made from combed or cardedcot<strong>to</strong>n, which is derived from cot<strong>to</strong>n lint, which comes from seed cot<strong>to</strong>n, which isharvested from the cot<strong>to</strong>n field. Indeed, before the final cot<strong>to</strong>n textile reaches <strong>to</strong>the hands of a consumer it passes through a number of intermediate processes andproducts. First the seed cot<strong>to</strong>n is processed in<strong>to</strong> lint (we get only 350 kg of lin<strong>to</strong>ut of 1000 kg of seed cot<strong>to</strong>n), then after carding, spinning and weaving we getgrey fabric (1000 kg of lint produces only 900 kg of grey fabric), then it goes <strong>to</strong>the wet processing (bleaching and dying) and finishes as final printed cot<strong>to</strong>ntextile. It requires about 30 m3 per <strong>to</strong>n for bleaching, 140 m3 per <strong>to</strong>n for dyingand 190 m3 per <strong>to</strong>n for printing. The average water footprint of printed cot<strong>to</strong>n(for example a pair of jeans weighing 1 kilogram) is 11000 litres per kilogram.12
[Hoekstra & Chapagain, 2008]<strong>Water</strong> footprint: 2700 litres for 1 cot<strong>to</strong>n shirt. In order <strong>to</strong> get 1 kg of final cot<strong>to</strong>ntextile, one requires 11,000 litres of water (as a global average). Thus, when wehave a shirt with a weight of 250 gram, this shirt costs 2700 litres. Of this <strong>to</strong>talwater volume, 45% is irrigation water consumed (evaporated) by the cot<strong>to</strong>n plant;41% is rainwater evaporated from the cot<strong>to</strong>n field during the growing period; and14% is water required <strong>to</strong> dilute the wastewater flows that result from the use offertilisers in the field and the use of chemicals in the textile industry. Globally,the annual cot<strong>to</strong>n production evaporates 210 billion cubic meters of water andpollutes 50 billion cubic meters of water. This is 3.5 % of the global water use forcrop production.
<strong>Water</strong> footprint of EU’s cot<strong>to</strong>n consumption (green water)[Hoekstra & Chapagain, 2008]This slide shows the green water footprint related <strong>to</strong> EU’s cot<strong>to</strong>n consumption,i.e. the volumes of rainwater evaporated for crop growth.15
<strong>Water</strong> footprint of EU’s cot<strong>to</strong>n consumption (grey water)[Hoekstra & Chapagain, 2008]This slide shows the gray water footprint related <strong>to</strong> EU’s cot<strong>to</strong>n consumption, i.e.the volumes of water polluted because of cot<strong>to</strong>n production and processing.16
The water footprint:making a link between consumption in one place andimpacts on water systems elsewhereShrinking Aral Sea<strong>Water</strong> use for cot<strong>to</strong>n production can have major impacts on the environment.Particularly intensive irrigation schemes can have disastrous effects, as shown forexample in the case of Uzbekistan and the desiccation of the Aral Sea.17
The water footprint:making a link between consumption in one place andimpacts on water systems elsewhereEndangered Indus River Dolphin[Pho<strong>to</strong>: WWF]The Indus River dolphin (Platanista minor) is one of the world's rarest mammals and thesecond most endangered freshwater river dolphin. Approximately 1,100 specimens ofthis species exist <strong>to</strong>day in a small fraction of their former range, the lower reaches of theIndus River in Pakistan. However, the population of this species has gradually declinedbecause of various fac<strong>to</strong>rs, including water pollution, poaching, fragmentation of habitatdue <strong>to</strong> barrages, and dolphin strandings in the irrigation canals. (Source: WWF).Pollution (pesticide runoff) from mainly cot<strong>to</strong>n.Yangtze dolphin extinct, Indus severely threatened. <strong>Water</strong> for people and nature requiresmanagement which focuses on multiple needs of systems. WF analysis allows us <strong>to</strong> tracesupply and identify impacts. It gives clear steer on risk and responsibility.
This is a global average and aggregate number. Policy decisions should be taken on the basis of:1. Actual water footprint of certain coffee at the precise production location.2. Ratio green/blue/grey water footprint.3. Local impacts of the water footprint based on local vulnerability and scarcity.[Hoekstra & Chapagain, 2008]It costs about 21,000 litres of water <strong>to</strong> produce 1 kg of roasted coffee. For astandard cup of coffee we require 7 gram of roasted coffee, so that a cup ofcoffee costs 140 litres of water. Assuming that a standard cup of coffee is 125 ml,we thus need more than 1100 drops of water for producing one drop of coffee.Drinking tea instead of coffee would save a lot of water. For a standard cup of teaof 250 ml we require 30 litres of water.
[Hoekstra & Chapagain, 2008]The water footprint of pure chocolate is 2400 litres for a 100-gram bar (as aworld average!). Composition of dark chocolate: 40% cocoa paste (waterfootprint 33260 litres/kg); 20% cocoa butter (water footprint 50730 litres/kg);40% sugar (water footprint 1526 litres/kg). We then can calculate: 40% 33260 +20% 50730 + 40% 1526 = 24060 litres/kg = 2400 liters for one 100gr chocolatebar. The water footprint of milk powder is 4600 litres/kg, so that milk chocolatewill have a bit larger water footprint (about 2500 litres for one 100gr chocolatebar) than dark chocolate when <strong>to</strong>tal cocoa content remains the same. Most crucialfor the water footprint of chocolate is the cocoa paste and cocoa butter content.
[Hoekstra & Chapagain, 2008]For 1 kg of refined sugar from SUGAR CANE we require about 1500 litres ofwater. Sugar cane consumes about 220 billion cubic meters of water annually,which is 3.4 % of the global water use for crop production. Sugar from sugarbeets requires less water per kg.
[Hoekstra & Chapagain, 2008]22
[Hoekstra & Chapagain, 2008]23
[Hoekstra & Chapagain, 2008]The major part of the water footprint of a hamburger refers <strong>to</strong> the water needed <strong>to</strong>make the feed for the cow.
[Hoekstra & Chapagain, 2008]25
[Hoekstra & Chapagain, 2008]<strong>Water</strong> footprint: 10 litres of water for one A4-sheet of paper. We assume hereeighty-grams paper (80g/m2). Further we assume that the paper is produced fromwood.
<strong>Water</strong> footprint of biofuels from different crops [litre/litre][Gerbens-Leenes, Hoekstra & Van der Meer, 2009]Source: Gerbens-Leenes, W., Hoekstra, A.Y. and Van der Meer, T.H. (2009) Thewater footprint of bio-energy, Proceedings of the National Academy of Sciences,PNAS Early Edition, doi:10.1073/pnas.0812619106.27
2The water footprin<strong>to</strong>f a nation28
<strong>Water</strong> footprint of a nation► <strong>to</strong>tal amount of water that is used <strong>to</strong> produce the goods andservices consumed by the inhabitants of the nation.► two components:• internal water footprint – inside the country.• external water footprint – in other countries.The water footprint is an indica<strong>to</strong>r of water use that looks at both direct andindirect water use. The water footprint of a nation is defined as the <strong>to</strong>tal amoun<strong>to</strong>f water that is used <strong>to</strong> produce the goods and services consumed by theinhabitants of the nation.The water footprint of a nation has two components. The internal water footprintis defined as the water use within the country in so far it is used <strong>to</strong> produce goodsand services consumed by the national population. The external water footprint ofa country is defined as the annual volume of water resources used in othercountries <strong>to</strong> produce goods and services imported in<strong>to</strong> and consumed in thecountry considered.29
<strong>Water</strong> footprint of a nation► National water footprint =national water use+ virtual water import– virtual water exportThe national water footprint can be assessed in two ways. In the <strong>to</strong>p-downapproach, the water footprint of a nation is calculated as the <strong>to</strong>tal use of domesticwater resources plus the gross virtual-water import minus the gross virtual-waterexport. The bot<strong>to</strong>m-up approach is <strong>to</strong> consider the sum of all goods and servicesconsumed multiplied with their respective product water footprint.30
National water accounting frameworkInternalwaterfootprint++Externalwaterfootprint+=<strong>Water</strong>footprint+Consumption<strong>Water</strong> usefor export+Virtual waterimport for reexport=VirtualwaterexportExport= ==<strong>Water</strong> usewithincountry+Virtualwater=importVirtualwaterbudgetThe traditionalstatisticson water useProductionImportThe internal water footprint is the water use within the country in so far it is used<strong>to</strong> produce goods and services consumed by the national population. The externalwater footprint of a country is the annual volume of water resources used in othercountries <strong>to</strong> produce goods and services imported in<strong>to</strong> and consumed in thecountry considered. It is equal <strong>to</strong> the virtual-water import in<strong>to</strong> the country minusthe volume of virtual-water exported <strong>to</strong> other countries as a result of re-export ofimported products. The virtual-water export consists of exported water ofdomestic origin and re-exported water of foreign origin. The virtual-water importwill partly be consumed, thus constituting the external water footprint of thecountry, and partly be re-exported. The sum of virtual water import and water usewithin a country is equal <strong>to</strong> the sum of the virtual water export and the country’swater footprint. This sum is called the virtual-water budget of a country.Traditionally countries formulate national water plans by looking how <strong>to</strong> satisfywater users. Even though countries nowadays consider options <strong>to</strong> reduce waterdemand in addition <strong>to</strong> options <strong>to</strong> increase supply, they generally do not includethe global dimension of water management. In this way they do not explicitlyconsider options <strong>to</strong> save water through import of water-intensive products. Inaddition, by looking only at water use in the own country, most governmentshave a blind spot <strong>to</strong> the issue of sustainability of national consumption. As amatter of fact many countries have significantly externalized their water footprintwithout looking whether the imported products are related <strong>to</strong> water depletion orpollution in the producing countries. Governments can and should engage withconsumers and businesses <strong>to</strong> work <strong>to</strong>wards sustainable consumer products.National water footprint accounting should be a standard component in nationalwater statistics and provide a basis <strong>to</strong> formulate a national water plan and riverbasin plans that are coherent with national trade policy and nationalenvironmental policy. 31
Regional virtual water balances(only agricultural trade)Arrows show trade flows >10 Gm 3 /yr[Hoekstra & Chapagain, 2008]Regional virtual-water balances and net interregional virtual-water flows related<strong>to</strong> trade in agricultural products. Only the biggest net flows (>10 billion m 3 /yr)are shown. Period 1997-2001. Source: Hoekstra and Chapagain (2008), map 2.32
<strong>Water</strong> footprint per capita3000Domestic water consumption Industrial goods Agricultural goods<strong>Water</strong> footprint (m 3 /cap/yr)2500200015001000500Global average water footprint0ChinaIndiaJapanPakistanIndonesiaBrazilMexicoRussiaNigeriaThailandItalyUSA[Hoekstra & Chapagain, 2008]USA has a large water footprint because of the high consumption level. Nigeriaand Thailand have a large water footprint because of inefficient water use (largewater use per unit of product).33
Major determinants of a water footprint1. Consumption characteristics• Consumption volume• Consumption pattern2. Production circumstances• Climate: evaporative demand at place of production• Agricultural practice: water use efficiencyUSA has a large water footprint because of the high consumption level. Nigeriaand Thailand have a large water footprint because of inefficient water use (largewater use per unit of product).34
3The water footprint of abusiness35
Why businesses are interested• corporate social responsibility• corporate image / marketing perspective• business risks related <strong>to</strong>- freshwater shortage for own operations- freshwater shortage in supply chain• anticipate regula<strong>to</strong>ry controlFor many companies, fresh water is a basic ingredient for their operations, whileeffluents may lead <strong>to</strong> pollution of the local water system. Initially, publicpressure has been the most important reason for sustainability initiatives inbusinesses. Today, however, many companies recognize that failure <strong>to</strong> managethe issue of fresh water raises different sorts of business risk, including damage<strong>to</strong> the corporate image, threat of increased regula<strong>to</strong>ry control, financial riskscaused by pollution, and insufficient freshwater availability for operations. Anumber of multinationals recognise now that proactive management can avoidrisks and contribute <strong>to</strong> their profitability and competitiveness. Business waterfootprint accounting is increasingly regarded as an essential part of sustainablecorporate performance accounting. An increasing number of businessesrecognize that not only their operations, but also their supplies depend andimpact on natural water systems.36
<strong>Water</strong> footprint of a businessOperational water footprint• the direct water use by the producer – for producing,manufacturing or for supporting activities.Supply-chain water footprint• the indirect water use in the producer’s supply chain.The water footprint of a business is the <strong>to</strong>tal volume of fresh water that is useddirectly and indirectly <strong>to</strong> run and support a business. The water footprint of abusiness consists of two components: the direct water use by the producer, forproducing/manufacturing and supporting activities, and the indirect water use,i.e. the water use in the producer’s supply chain. The ‘water footprint of abusiness’ is the same as the <strong>to</strong>tal ‘water footprint of the business outputproducts’.37
The virtual water chainFarmerVirtualwaterflowFoodprocesserVirtualwaterflowRetailerVirtualwaterflowConsumergreenandbluewaterusegreywaterbluewatergreyusewaterbluewatergreyusewaterbluewatergreyusewater[Hoekstra, 2008]The virtual water chain is the chain of production and consumption of waterintensivegoods. A typical virtual water chain consists of a farmer at the primaryproduction end, a consumer at the consumption end and, depending on thecommodity at stake, some intermediaries such as a food processor and a retailer.Each stage depends on some real water input and a virtual water inflow.38
The water footprint of a consumerFarmerVirtualwaterflowFoodprocesserVirtualwaterflowRetailerVirtualwaterflowConsumergreenandbluewaterusegreywaterbluewatergreyusewaterbluewatergreyusewaterbluewatergreyusewaterIndirect WFDirect WF[Hoekstra, 2008]39
The water footprint of a retailerFarmerVirtualwaterflowFoodprocesserVirtualwaterflowRetailerVirtualwaterflowConsumergreenandbluewaterusegreywaterbluewatergreyusewaterbluewatergreyusewaterbluewatergreyusewaterSupply chain WFOperational WFEnd-use WF of aproductThe traditional statisticson corporate water use[Hoekstra, 2008]40
The water footprint of a food processorFarmerVirtualwaterflowFoodprocesserVirtualwaterflowRetailerVirtualwaterflowConsumergreenandbluewaterusegreywaterbluewatergreyusewaterbluewatergreyusewaterbluewatergreyusewaterSupply chain WFOperational WFEnd-use WF of a productThe traditional statisticson corporate water use[Hoekstra, 2008]41
<strong>Water</strong> footprint – Carbon footprint<strong>Water</strong> footprint• spatial and temporaldimension• actual, locally specific values• always referring <strong>to</strong> full supplychain• focus on reducing own waterfootprint (water use units arenot interchangeable)Carbon footprint• no spatial / temporaldimension• global average values• supply-chain included only in‘scope 3 carbon accounting’• many efforts focused onoffsetting (carbon emissionunits are interchangeable)<strong>Water</strong> footprint and carbon footprint are complementary <strong>to</strong>ols.[Hoekstra, 2009]42
<strong>Water</strong> footprint – Life cycle assessment<strong>Water</strong> footprint• measuring freshwaterappropriation• multi-dimensional (type ofwater use, location, timing)• actual water volumes, noweighing• WF accounts offer basis forimpact assessment andformulation of sustainablewater use strategyLCA• measuring overallenvironmental impact• no spatial dimension• weighing water volumes basedon impacts• LCA offers basis forcomparing products withrespect <strong>to</strong> overallenvironmental impact[Hoekstra, 2009]<strong>Water</strong> footprint is just one aspect in LCA.LCA is just one application of WF.43
4From concept <strong>to</strong> practice44
From water footprint accounting <strong>to</strong> policy formulationVulnerability of local water systemsCurrent water stress in the placeswhere the water footprint is localised12 3Spatiotemporalexplicitwaterfootprint of a• product• individual• community• businessImpacts of thewater footprint• environmental•social• economicReduce andoffset thenegative impactsof the waterfootprint[Hoekstra, 2008]Source: Hoekstra, A.Y. (2008) <strong>Water</strong> neutral: reducing and offsetting theimpacts of water footprints, Value of <strong>Water</strong> Research Report Series No.28,UNESCO-IHE.
<strong>Water</strong> footprint impact assessmentGlobal map of wherethe water footprintis locatedGlobal map of wherewater systems arestressedOverlayGlobal hotspot mapSource: Hoekstra, A.Y. (2008) <strong>Water</strong> neutral: reducing and offsetting theimpacts of water footprints, Value of <strong>Water</strong> Research Report Series No.28,UNESCO-IHE.46
Impact assessment – hypothetical exampleGlobal water footprint of a businesslocated in the NetherlandsEnvironmental water scarcity<strong>Water</strong> stress(withdrawal-<strong>to</strong>-availability)< 0.30.3 - 0.40.4 - 0.50.5 - 0.60.6 - 0.70.7 - 0.80.8 - 0.90.9 - 1.0Main producing regionsProducing countries> 1.0Hotspots<strong>Water</strong> stress(withdrawal-<strong>to</strong>-availability)< 0.30.3 - 0.40.4 - 0.50.5 - 0.60.6 - 0.70.7 - 0.80.8 - 0.90.9 - 1.0> 1.0Hotspots are spots where(1)the business has a substantialwater footprint(2) water is stressed.Main producing regionsHotspots<strong>Water</strong> scarcity level by basin taking in<strong>to</strong> account environmental waterrequirements. The index is calculated by dividing the water withdrawal in acertain area by the <strong>to</strong>tal runoff in that area lessened by the environmental waterrequirements. Source: Smakhtin, V., Revenga, C., and Döll, P. (2004) Takingin<strong>to</strong> account environmental water requirements in global-scale water resourcesassessments, <strong>Comprehensive</strong> Assessment Research Report 2, IWMI, Colombo,Sri Lanka.47
Reducing and offsetting the impacts of water footprintsReduction: all what is ‘reasonably possible’ should have been done <strong>to</strong>reduce the existing water footprint; do not undertake water-usingactivities if better alternatives are available.Offsetting: the residual water footprint is offset by making a‘reasonable investment’ in establishing or supporting projects thataim at a sustainable, equitable and efficient use of water in thecatchment where the residual water footprint is located.[Hoekstra, 2008]Source: Hoekstra, A.Y. (2008) <strong>Water</strong> neutral: reducing and offsetting theimpacts of water footprints, Value of <strong>Water</strong> Research Report Series No.28,UNESCO-IHE.48
Consumer perspectiveReduction of the direct water footprint:• water saving <strong>to</strong>ilet, shower-head, etc.Reduction of the indirect water footprint:• substitution of a consumer product that has a large water footprintby a different type of product that has a smaller water footprint;• substitution of a consumer product that has a large water footprintby the same product that is derived from another source withsmaller water footprint.Ask product transparency from businesses and regulationfrom governments[Hoekstra, 2008]Examples of the first sort of substitution are replacing rice consumption in theNetherlands by pota<strong>to</strong>es or replacing cane sugar by beet sugar. An example of thesecond sort of substitution is replacing cot<strong>to</strong>n clothes that originate from semiaridregions with irrigated cot<strong>to</strong>n fields by cot<strong>to</strong>n clothes produced in wetterareas with rain-fed cot<strong>to</strong>n growing. Both sorts of action require that the consumeris provided with proper information about the water footprints of specificproducts. For the first sort of substitution some general knowledge about thewater footprints of different types of products may be sufficient, but for thesecond sort of substitution individual items need <strong>to</strong> be labelled in the shop.Source: Hoekstra, A.Y. (2008) <strong>Water</strong> neutral: reducing and offsetting theimpacts of water footprints, Value of <strong>Water</strong> Research Report Series No.28,UNESCO-IHE.49
Business perspectiveReduction of the operational water footprint:• water saving in own operations.Reduction of the supply-chain water footprint:• influencing suppliers;• changing <strong>to</strong> other suppliers;• transform business model in order <strong>to</strong> incorporate or better controlsupply chains.[Hoekstra, 2008]Source: Hoekstra, A.Y. (2008) <strong>Water</strong> neutral: reducing and offsetting theimpacts of water footprints, Value of <strong>Water</strong> Research Report Series No.28,UNESCO-IHE.50
Business / product transparency<strong>Water</strong> footprint reportingShared standardsLabelling of productsCertification of businessesBenchmarkingQuantitative footprint reduction targets51
Government perspectiveReduction of own organizational water footprint:• Reducing the water footprint of public services.Embedding water footprint analysis in legislationSupporting / forcing businesses:• <strong>to</strong> make annual business water footprint accounts;• <strong>to</strong> implement measures that reduce the impacts of business waterfootprints.Promoting product transparency• through promoting a water label for water-intensive products;• through water-certification of businesses.52
Shared responsibility and an incremental approach• Consumers or consumer or environmental organizationspush businesses and governments <strong>to</strong> address wateruse and impacts along supply chains.• Some businesses act voluntarily in an early stage.• Governments promote businesses in an early phaseand implement regulations in a later phase.53
6The way forward54
www.waterfootprint.orgMission: Promoting sustainable, equitable and efficient wateruse through development of shared standards on water footprintaccounting and guidelines for the reduction and offsetting ofimpacts of water footprints.Network: bringing <strong>to</strong>gether expertise from academia,businesses, civil society, governments and internationalorganisations.The mission of the <strong>Water</strong> Footprint Network is <strong>to</strong> promote the transition <strong>to</strong>wardssustainable, fair and efficient use of fresh water resources worldwide by:* advancing the concept of the ‘water footprint’, a spatially and temporallyexplicit indica<strong>to</strong>r of direct and indirect water use of consumers andproducers;* increasing the water footprint awareness of communities, governmentbodies and businesses and their understanding of how consumption of goodsand services and production chains relate <strong>to</strong> water use and impacts on freshwatersystems; and* encouraging forms of water governance that reduce the negative ecologicaland social impacts of the water footprints of communities, countries andbusinesses.The <strong>Water</strong> Footprint Network aims <strong>to</strong> come <strong>to</strong> broadly shared global standards onwater footprint accounting. We try <strong>to</strong> prevent what has happened in the caseof the carbon footprint: a multitude of different definitions, approaches andmethods, so that it is difficult <strong>to</strong> properly assess claims in this field. A uniqueset of global standards on the water footprint will make efforts of businessesand communities that strive for a reduction of their water footprint moretransparent.55
www.waterfootprint.orgPartnerspartners from six continents• research institutions• governmental institutions• non-governmental organisations• large companies from different sec<strong>to</strong>rs• branche organisations• consultants• international institutions56
Feel free <strong>to</strong> go <strong>to</strong> the water footprint website, find much more info and freelydownload publications.57
Find the water footprint of various products in the Product Gallery on the waterfootprint website.58
Calculate your own water footprint at www.waterfootprint.org59