Project Status - Upper Midwest Environmental Sciences Center
Project Status - Upper Midwest Environmental Sciences Center
Project Status - Upper Midwest Environmental Sciences Center

You also want an ePaper? Increase the reach of your titles
YUMPU automatically turns print PDFs into web optimized ePapers that Google loves.
1234567890123456789012345678901212345678901234567890123456789012123456789012345678901234567890121234567890123456789012345678901<br />
1234567890123456789012345678901212345678901234567890123456789012123456789012345678901234567890121234567890123456789012345678901<br />
1234567890123456789012345678901212345678901234567890123456789012123456789012345678901234567890121234567890123456789012345678901<br />
1234567890123456789012345678901212345678901234567890123456789012123456789012345678901234567890121234567890123456789012345678901<br />
1234567890123456789012345678901212345678901234567890123456789012123456789012345678901234567890121234567890123456789012345678901<br />
1234567890123456789012345678901212345678901234567890123456789012123456789012345678901234567890121234567890123456789012345678901<br />
1234567890123456789012345678901212345678901234567890123456789012123456789012345678901234567890121234567890123456789012345678901<br />
1234567890123456789012345678901212345678901234567890123456789012123456789012345678901234567890121234567890123456789012345678901<br />
1234567890123456789012345678901212345678901234567890123456789012123456789012345678901234567890121234567890123456789012345678901<br />
1234567890123456789012345678901212345678901234567890123456789012123456789012345678901234567890121234567890123456789012345678901<br />
1234567890123456789012345678901212345678901234567890123456789012123456789012345678901234567890121234567890123456789012345678901<br />
1234567890123456789012345678901212345678901234567890123456789012123456789012345678901234567890121234567890123456789012345678901<br />
<strong>Project</strong> <strong>Status</strong><br />
Report<br />
<strong>Upper</strong> Mississippi River<br />
Long Term Resource Monitoring Program<br />
U.S. Geological Survey<br />
Predicting the Effects<br />
of Water Level Management Options<br />
Twenty-seven dams and hundreds of miles of levees affect<br />
floodplain habitat in the <strong>Upper</strong> Mississippi River floodplain.<br />
Predicting areas of the floodplain that may be wetted<br />
or dried has been difficult because water levels at the dams<br />
are managed as a function of discharge. This causes the slope<br />
of the water surface in the navigation pools to routinely vary<br />
over the year from less than a foot to over 8 feet. <strong>Environmental</strong><br />
Management Technical <strong>Center</strong> staff have integrated<br />
hydraulic, statistical, and spatial models to predict the effects<br />
of management alternatives for Pool 25 on the <strong>Upper</strong> Mississippi<br />
River. Pool 25 has been the focus of an interagency<br />
committee on natural resources for the past 3 years.<br />
The model framework, which includes options dealing<br />
with levee placement and water level management at the dams,<br />
can be easily applied to other areas on the system as data become<br />
available. For example, the spatial model is currently<br />
being used by the St. Paul District to predict the effects of<br />
management options on habitat in Pool 8. A report on that<br />
project is scheduled for this year.<br />
The models 1) estimate how often a particular water level<br />
management plan may be practical based on the historical water<br />
surface elevation record and discharge estimates, 2) predict<br />
types and amounts of habitat affected by various water<br />
level and levee management alternatives, 3) estimate changes<br />
to the aquatic terrestrial transition zone (ATTZ) caused by dam<br />
operation and levee placement, and 4) estimate flood easement<br />
or ownership rights needed for various options.<br />
Since 1939, discharge estimates for Pool 25 were used to<br />
compute exceedence frequencies on a weekly, monthly, and<br />
yearly basis. Water level measurements at five stations were<br />
used to calculate the percentage of time water levels were<br />
above specific elevations for the same three time scales. These<br />
data were also used to calibrate a one-dimensional hydrologic<br />
model (HEC-2), assuring that predicted water surfaces were<br />
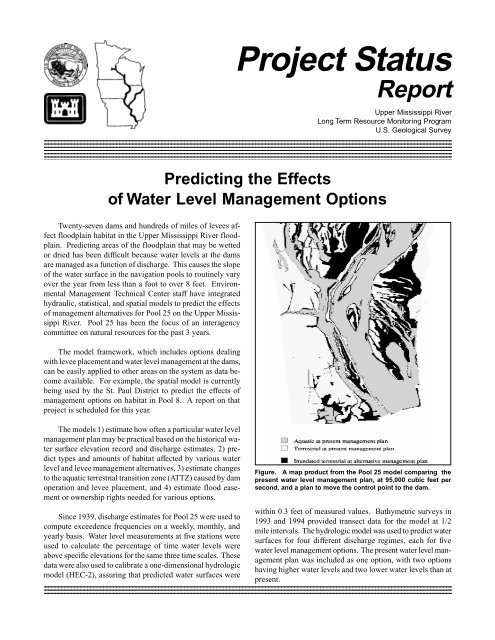
Figure. A map product from the Pool 25 model comparing the<br />
present water level management plan, at 95,000 cubic feet per<br />
second, and a plan to move the control point to the dam.<br />
within 0.3 feet of measured values. Bathymetric surveys in<br />
1993 and 1994 provided transect data for the model at 1/2<br />
mile intervals. The hydrologic model was used to predict water<br />
surfaces for four different discharge regimes, each for five<br />
water level management options. The present water level management<br />
plan was included as one option, with two options<br />
having higher water levels and two lower water levels than at<br />
present.
Geographic Information System (GIS) coverages were<br />
created for water surface elevations, land cover, floodplain<br />
elevations, land ownership, and levee locations. A water surface<br />
coverage for each of the 20 combinations of discharge<br />
and management plans was developed from the hydrologic<br />
model predictions. Twelve land cover classes were identified<br />
from color-infrared aerial photographs taken at a scale of<br />
1:15,000: open water, submergents, submergents-rooted floating<br />
aquatics, rooted floating aquatics-emergents, emergents,<br />
emergents-grasses-forbes, grasses-forbes, woody terrestrial,<br />
agriculture, urban-developed, and sand-mud. Two additional<br />
classes were created to help display results because of changes<br />
in discharge or management, dewatered aquatics and flooded<br />
terrestrial. Floodplain elevations were obtained from bathymetric<br />
surveys measured in 1993 and 1994, contour data from<br />
United States Geological Survey 1:24,000 quadrangle maps,<br />
and estimates of elevation from river gages when photographs<br />
of the water and land interface were obtained. A land ownership<br />
coverage was developed by digitizing maps obtained from<br />
the St. Louis District of the U.S. Army Corps of Engineers.<br />
Levee locations were obtained from a team studying the flood<br />
of 1993. The GIS was then used to integrate all coverages,<br />
predicting the habitats affected for each scenario or the acreage<br />
needed for flooding easements. Quantitative estimates of<br />
each affected habitat class were tabulated and color maps were<br />
generated to illustrate spatial distribution of change. A black<br />
and white example of a map product is shown on the other<br />
side. Changes in aquatic areas ranged from a reduction of<br />
8,000 acres to an increase of 22,000 acres under various scenarios.<br />
The area of greatest change was in the impounded<br />
reach closest to the dam.<br />
The ATTZ, defined here as the amount of land area flooded<br />
between yearly average minimum and maximum water surface<br />
elevations, has been studied using the model. The ATTZ<br />
has changed considerably as a function of human activities on<br />
the floodplain. The areal extent of the ATTZ, both as it is now<br />
and as it would be if the dams and levees were not present,<br />
was calculated for three 2-mile wide bands representing the<br />
lower, middle, and upper reaches of the reservoir. In the lower<br />
reach of reservoir, the ATTZ is now only about 2/3 of its original<br />
size. In the other two reaches, the ATTZ is now only about<br />
1/3 of its original size.<br />
The model was also used to estimate the discharge representing<br />
ordinary high water and to predict additional lands<br />
that would be flooded as a result of alternative plans. One of<br />
the water level management options from the above study is<br />
presently being further investigated by the St. Louis District.<br />
It involves allowing a flexible control point (a specific location<br />
in the reservoir where a water level target is maintained).<br />
The major negative impact from this option would be the need<br />
for the St. Louis District to purchase additional land or flood<br />
easements. The model predicted that no lands would need to<br />
be purchased under any discharge for 13 miles immediately<br />
upriver of the dam. The maximum amount of land needed<br />
would be approximately 740 acres when water levels are maintained<br />
at their highest level at the discharge creating ordinary<br />
high water. This new plan would not have a detrimental effect<br />
on the 9-foot navigation channel and it would provide the<br />
management option of allowing for up to 4.3 feet of water<br />
level fluctuation for improvement of habitat for some organisms.<br />
To quantify the benefits that might be obtained from<br />
alternate water management strategies will require appropriate<br />
investigations.<br />
For further information, contact<br />
Joseph H. Wlosinski<br />
U.S. Geological Survey<br />
<strong>Environmental</strong> Managment Technical <strong>Center</strong><br />
575 Lester Avenue<br />
Onalaska, WI 54650<br />
Phone: 608/783-7550, extension 56<br />
E-mail: Joe_Wlosinski@nbs.gov<br />
James T. Rogala<br />
U.S. Geological Survey<br />
<strong>Environmental</strong> Managment Technical <strong>Center</strong><br />
575 Lester Avenue<br />
Onalaska, WI 54650<br />
Phone: 608/783-7550, extension 60<br />
E-mail: Jim_Rogala@nbs.gov<br />
<strong>Project</strong> <strong>Status</strong> Reports (PSRs) are internal Long Term Resource Monitoring Program documents whose purpose is to provide information on Program activities. Because PSRs are<br />
not subject to peer review, they may not be cited. Use of trade names does not imply U.S. Government endorsement of commercial products.<br />
October 1996 PSR 96-03<br />
United States Department of the Interior<br />
U.S. Geological Survey<br />
<strong>Environmental</strong> Management Technical <strong>Center</strong><br />
575 Lester Avenue<br />
Onalaska, WI 54650-8552<br />
608/783-7550<br />
BULK RATE<br />
Postage and Fees Paid<br />
U.S. Geological Survey<br />
Permit No. G-790