

SuStainable urban tranSport in india - World Resources Institute
SuStainable urban tranSport in india - World Resources Institute
SuStainable urban tranSport in india - World Resources Institute

You also want an ePaper? Increase the reach of your titles
YUMPU automatically turns print PDFs into web optimized ePapers that Google loves.
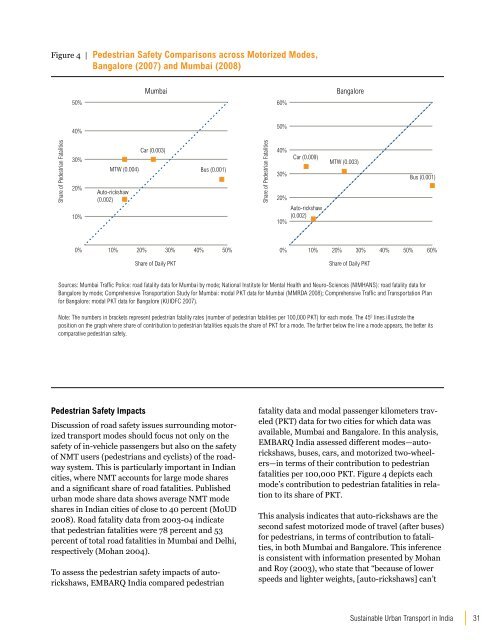
Figure 4 | Pedestrian Safety Comparisons across Motorized Modes,<br />
Bangalore (2007) and Mumbai (2008)<br />
Sources: Mumbai Traffic Police: road fatality data for Mumbai by mode; National <strong>Institute</strong> for Mental Health and Neuro-Sciences (NIMHANS): road fatality data for<br />
Bangalore by mode; Comprehensive Transportation Study for Mumbai: modal PKT data for Mumbai (MMRDA 2008); Comprehensive Traffic and Transportation Plan<br />
for Bangalore: modal PKT data for Bangalore (KUIDFC 2007).<br />
Note: The numbers <strong>in</strong> brackets represent pedestrian fatality rates (number of pedestrian fatalities per 100,000 PKT) for each mode. The 45 0 l<strong>in</strong>es illustrate the<br />
position on the graph where share of contribution to pedestrian fatalities equals the share of PKT for a mode. The farther below the l<strong>in</strong>e a mode appears, the better its<br />
comparative pedestrian safety.<br />
Pedestrian Safety Impacts<br />
Discussion of road safety issues surround<strong>in</strong>g motorized<br />
transport modes should focus not only on the<br />
safety of <strong>in</strong>-vehicle passengers but also on the safety<br />
of NMT users (pedestrians and cyclists) of the roadway<br />
system. This is particularly important <strong>in</strong> Indian<br />
cities, where NMT accounts for large mode shares<br />
and a significant share of road fatalities. Published<br />
<strong>urban</strong> mode share data shows average NMT mode<br />
shares <strong>in</strong> Indian cities of close to 40 percent (MoUD<br />
2008). Road fatality data from 2003-04 <strong>in</strong>dicate<br />
that pedestrian fatalities were 78 percent and 53<br />
percent of total road fatalities <strong>in</strong> Mumbai and Delhi,<br />
respectively (Mohan 2004).<br />
To assess the pedestrian safety impacts of autorickshaws,<br />
EMBARQ India compared pedestrian<br />
fatality data and modal passenger kilometers traveled<br />
(PKT) data for two cities for which data was<br />
available, Mumbai and Bangalore. In this analysis,<br />
EMBARQ India assessed different modes—autorickshaws,<br />
buses, cars, and motorized two-wheelers—<strong>in</strong><br />
terms of their contribution to pedestrian<br />
fatalities per 100,000 PKT. Figure 4 depicts each<br />
mode’s contribution to pedestrian fatalities <strong>in</strong> relation<br />
to its share of PKT.<br />
This analysis <strong>in</strong>dicates that auto-rickshaws are the<br />
second safest motorized mode of travel (after buses)<br />
for pedestrians, <strong>in</strong> terms of contribution to fatalities,<br />
<strong>in</strong> both Mumbai and Bangalore. This <strong>in</strong>ference<br />
is consistent with <strong>in</strong>formation presented by Mohan<br />
and Roy (2003), who state that “because of lower<br />
speeds and lighter weights, [auto-rickshaws] can’t<br />
Susta<strong>in</strong>able Urban Transport <strong>in</strong> India<br />
31


