Mean Vectors and Covariance Matrices
Mean Vectors and Covariance Matrices
Mean Vectors and Covariance Matrices

Create successful ePaper yourself
Turn your PDF publications into a flip-book with our unique Google optimized e-Paper software.
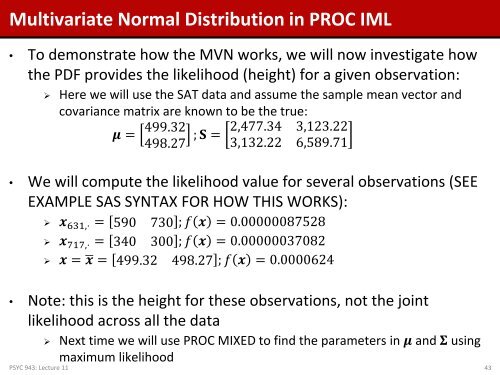
Multivariate Normal Distribution in PROC IML<br />
• To demonstrate how the MVN works, we will now investigate how<br />
the PDF provides the likelihood (height) for a given observation:<br />
‣ Here we will use the SAT data <strong>and</strong> assume the sample mean vector <strong>and</strong><br />
covariance matrix are known to be the true:<br />
μ = 499.32<br />
498.27<br />
; S =<br />
2,477.34 3,123.22<br />
3,132.22 6,589.71<br />
• We will compute the likelihood value for several observations (SEE<br />
EXAMPLE SAS SYNTAX FOR HOW THIS WORKS):<br />
‣ x 631,⋅ = 590 730 ; f x = 0.00000087528<br />
‣ x 717,⋅ = 340 300 ; f x = 0.00000037082<br />
‣ x = x = 499.32 498.27 ; f x = 0.0000624<br />
• Note: this is the height for these observations, not the joint<br />
likelihood across all the data<br />
‣ Next time we will use PROC MIXED to find the parameters in μ <strong>and</strong> Σ using<br />
maximum likelihood<br />
PSYC 943: Lecture 11 43