1 Mapping Laborie Bay, Saint Lucia Allan H. Smith ... - CANARI
1 Mapping Laborie Bay, Saint Lucia Allan H. Smith ... - CANARI
1 Mapping Laborie Bay, Saint Lucia Allan H. Smith ... - CANARI

You also want an ePaper? Increase the reach of your titles
YUMPU automatically turns print PDFs into web optimized ePapers that Google loves.
<strong>Mapping</strong> <strong>Laborie</strong> <strong>Bay</strong>, <strong>Saint</strong> <strong>Lucia</strong><br />
<strong>Allan</strong> H. <strong>Smith</strong><br />
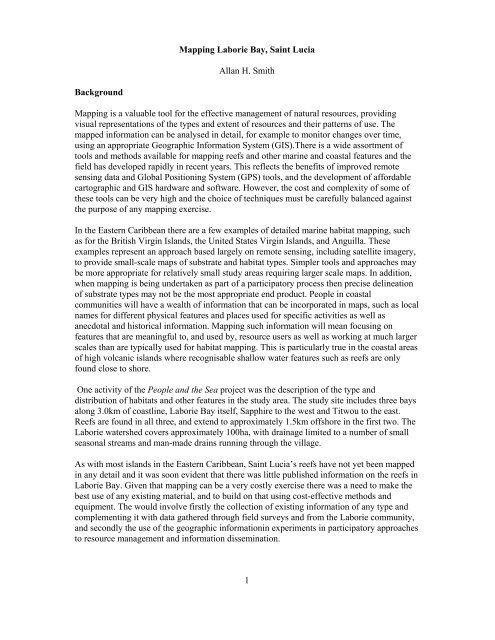
Background<br />
<strong>Mapping</strong> is a valuable tool for the effective management of natural resources, providing<br />
visual representations of the types and extent of resources and their patterns of use. The<br />
mapped information can be analysed in detail, for example to monitor changes over time,<br />
using an appropriate Geographic Information System (GIS).There is a wide assortment of<br />
tools and methods available for mapping reefs and other marine and coastal features and the<br />
field has developed rapidly in recent years. This reflects the benefits of improved remote<br />
sensing data and Global Positioning System (GPS) tools, and the development of affordable<br />
cartographic and GIS hardware and software. However, the cost and complexity of some of<br />
these tools can be very high and the choice of techniques must be carefully balanced against<br />
the purpose of any mapping exercise.<br />
In the Eastern Caribbean there are a few examples of detailed marine habitat mapping, such<br />
as for the British Virgin Islands, the United States Virgin Islands, and Anguilla. These<br />
examples represent an approach based largely on remote sensing, including satellite imagery,<br />
to provide small-scale maps of substrate and habitat types. Simpler tools and approaches may<br />
be more appropriate for relatively small study areas requiring larger scale maps. In addition,<br />
when mapping is being undertaken as part of a participatory process then precise delineation<br />
of substrate types may not be the most appropriate end product. People in coastal<br />
communities will have a wealth of information that can be incorporated in maps, such as local<br />
names for different physical features and places used for specific activities as well as<br />
anecdotal and historical information. <strong>Mapping</strong> such information will mean focusing on<br />
features that are meaningful to, and used by, resource users as well as working at much larger<br />
scales than are typically used for habitat mapping. This is particularly true in the coastal areas<br />
of high volcanic islands where recognisable shallow water features such as reefs are only<br />
found close to shore.<br />
One activity of the People and the Sea project was the description of the type and<br />
distribution of habitats and other features in the study area. The study site includes three bays<br />
along 3.0km of coastline, <strong>Laborie</strong> <strong>Bay</strong> itself, Sapphire to the west and Titwou to the east.<br />
Reefs are found in all three, and extend to approximately 1.5km offshore in the first two. The<br />
<strong>Laborie</strong> watershed covers approximately 100ha, with drainage limited to a number of small<br />
seasonal streams and man-made drains running through the village.<br />
As with most islands in the Eastern Caribbean, <strong>Saint</strong> <strong>Lucia</strong>’s reefs have not yet been mapped<br />
in any detail and it was soon evident that there was little published information on the reefs in<br />
<strong>Laborie</strong> <strong>Bay</strong>. Given that mapping can be a very costly exercise there was a need to make the<br />
best use of any existing material, and to build on that using cost-effective methods and<br />
equipment. The would involve firstly the collection of existing information of any type and<br />
complementing it with data gathered through field surveys and from the <strong>Laborie</strong> community,<br />
and secondly the use of the geographic informationin experiments in participatory approaches<br />
to resource management and information dissemination.<br />
1
Cartography resources<br />
The assessment began with the identification of whatever published information was<br />
available in <strong>Saint</strong> <strong>Lucia</strong> on marine and coastal habitats, and identified the following.<br />
‣ Reproductions of various historical maps with little or no detail of marine features. A<br />
number of these have been produced commercially and are readily available in shops<br />
catering to visitors, particularly at marinas and chandleries.<br />
‣ Original hand-painted maps from the mid 18 th Century indicating soundings, reefs<br />
and anchorages. These were located in the collections of the <strong>Saint</strong> <strong>Lucia</strong> National<br />
Archives where they were made available for scanning. Relevant sections were<br />
scanned directly into a notebook computer using a desk top scanner.<br />
‣ Topographic maps at 1:2,500, 1:10,000, 1:25,000 and 1:50,000, the most recent<br />
compiled in 1995 from a 1992 aerial survey. These were readily available in the<br />
Lands and Surveys Department of the Ministry of Planning. Hard copies measured up<br />
to 0.7m X 1.0m and were scanned on a drum scanner and saved to CD.<br />
‣ Navigational charts showing general reef distribution but at a very coarse level of<br />
detail, intended only to identify the seaward boundary of reefs as potential<br />
navigational hazards and mainly based on 19 th Century surveys. Charts are included<br />
in various cruising guides to the region as well as from software packages, such as<br />
Chart Navigator, produced for the yachting community.<br />
‣ Airphotos made for land cartography but including marine features to a distance of<br />
approximately 1.25 km from shore, from series made in 1941, 1966, 1977 and 1992,<br />
were also made available by the Survey and <strong>Mapping</strong> Department and scanned<br />
directly into a notebook computer using a desk top scanner.<br />
Relevant information is also available in a number of technical publications on marine<br />
habitats, particularly those focusing on the status and distribution of reefs, and many of these<br />
are available free from Internet sources. Many astronaut photographs taken from the Space<br />
Shuttle clearly show shallow reefs to a depth of 15m and are now freely available via the<br />
Internet from the NASA-Johnson Space Centre. Some key resources of this type are listed in<br />
the bibliography.<br />
Tools<br />
An appropriate GIS application was needed to use the available maps and airphotos, and to<br />
generate new maps to include information that would be gathered during the project. The<br />
following criteria were used in selecting a GIS application for the project:<br />
‣ Ability to exchange spatial data with GIS applications already in use in the country.<br />
‣ Ability to use both raster and vector formats 1 .<br />
‣ Ability to calibrate (georeference) raster images.<br />
‣ Affordability at startup, without costly annual maintenance and upgrade fees.<br />
‣ Ability to import and use GPS data.<br />
1 An example of a raster image is a scanned map in which each pixel is described, but which does not contain<br />
information that describes objects. Common file formats are *.BMP, *.JPG and *.TIF. An example of a vector<br />
image is an object drawn in Map Maker or other GIS. A vector file contains information that describes the<br />
position and magnitude of objects. File types include *.DRA used by Map Maker, *.DXF used in CAD<br />
applications, and *.SHP used by Arc View.<br />
2
‣ Ability to convert among raster file formats.<br />
‣ Availability of these features in one program without the need for costly add-on<br />
modules or third-party software.<br />
Based on these requirements, Map Maker Pro, developed by Map Maker Ltd in the UK was a<br />
suitable choice. Of particular importance was its compatibility with all commonly used GIS<br />
packages and that it was designed specifically for resource management studies.<br />
Data gathering<br />
Historical maps<br />
Early maps of <strong>Saint</strong> <strong>Lucia</strong>, produced in the 17 th and 18 th Centuries, did not identify <strong>Laborie</strong><br />
<strong>Bay</strong> but showed a small island at the eastern end of it, and the small beach at Sapphire<br />
identified as Anse a Charles (Figure 1). The bay was also identified as an anchorage for ships.<br />
Figure 1. Extract of a map from 1758<br />
3
More detailed description and cartography of the area were published in 1784, with<br />
subsequent versions of maps, by Jean Francois Lefort de Latour, Surveyor to the King of<br />
France. Figure 2 shows part of the original oil painting which depicted the whole of <strong>Saint</strong><br />
<strong>Lucia</strong>. <strong>Laborie</strong> was located in the Quartier de l’Islet à Caret, indicating the importance of the<br />
extensive sandy beach as a turtle nesting site. <strong>Laborie</strong> was thus one of dozens of places in the<br />
region named after turtles, providing an historical proxy of ecosystem change and of the past<br />
abundance and subsequent decline of these and other species (Jackson et al. 2001). At that<br />
time the small island in <strong>Laborie</strong> <strong>Bay</strong>, named l’Islet à Carret (Figures 2 to 4), was also noted<br />
for turtle nesting and as a roosting site for seabirds. This was possibly a sand bank and even<br />
when it was described in 1787 it was already being washed away by the sea (Jesse 1986). The<br />
units of measurement are not indicated on the maps of Lefort de Latour but the unit used for<br />
the depth soundings was most likely the French fathom, or toise, equivalent to 1.949m.<br />
Fig. 2 . Extract of an original 1787 map by Lefort de Latour<br />
4
Fig. 3 Extract of one of the copies of the original map of Lefort de Latour<br />
Fig. 4. Detail of Fig. 3 showing depth soundings and the location of the island in <strong>Laborie</strong> <strong>Bay</strong><br />
in the 1780s<br />
5
Topographic maps<br />
Topographic maps prepared in 1995 at 1:2500 scale were obtained from the Survey and<br />
<strong>Mapping</strong> Department in hard copy, scanned on a drum scanner and calibrated (georeferenced)<br />
in Map Maker. A mosaic was compiled of the three map files that covered the study area and<br />
an extract from the mosaic is shown in Figure 5. These calibrated maps provided the basis for<br />
calibrating airphotos and for verifying the accuracy of GPS coordinates.<br />
Airphotos<br />
Contact prints of monochrome airphotos were available from surveys conducted in 1941,<br />
1966 and 1977, and from 1992 in normal colour. While these were produced for land<br />
cartography there is some marine coverage where flight paths crossed embayments, such as<br />
<strong>Laborie</strong>. Relevant prints were scanned and calibrated. The colour airphotos from 1992<br />
provided the initial information on the general distribution of different marine habitats,<br />
including sand, seagrass, reef and mangrove areas.<br />
4 August 2003<br />
METRES<br />
1: 7,839<br />
0 100<br />
100 200 300 400 500 600 700 800 900<br />
METRES<br />
Figure 5. Extract from a mosaic of three 1:2500 topographic maps.<br />
Some rectification of airphotos was necessary for terrestrial features to account the distortion<br />
induced by the hilly topography. This was done using the rubbersheeting facility in Map<br />
Maker, which manipulates the raster image to match identifiable features in a vector layer<br />
drawn from the topographic maps. Calibration using features on flatter coastal areas gave a<br />
more precise match with the topographic maps and no rectification was necessay.<br />
6
Nautical charts<br />
A widely used chart of the bay is shown in Figure 6 below. This gives only a very general<br />
indication of reef distribution as navigational hazard. It does, however, emphasise the<br />
distance to which shallow reef extend offshore, which is uncommon in many of the volcanic<br />
islands of the region where bathymetry commonly drops sharply close to shore.<br />
29 May 2003<br />
0.25 0 0.25 0.50 0.75 1.00<br />
1:20,000<br />
Kms<br />
Caribbean Yachting Charts, Nautical Publications GmbH, 1996<br />
METRES<br />
1: 20,000<br />
100 0 100 200 300 400 500 600 700 800 900 1000 1100 1200 1300 1400 1500 1600 1700 1800 METRES<br />
Figure 6. Extract of a current nautical chart of <strong>Laborie</strong> <strong>Bay</strong> showing reefs in green, with 5m,<br />
10m and 20m isobaths, based on 19 th Century British Admiralty surveys.<br />
7
Popular knowledge<br />
While some reefs could be clearly delineated from the airphotos, more detailed definition<br />
required ground truthing and gathering information from fishers and divers. This began with<br />
boat trips with people familiar with the area. To prepare for these, copies of the scanned<br />
airphotos were printed, mounted on card and covered with clear plastic sheet. As the boat<br />
captain navigated around the <strong>Bay</strong> features in the airphotos were annotated using permanent<br />
marker on the plastic overlay, to include place names (Fig. 7) and notes on any locations of<br />
particular importance for fishing or other activities. GPS waypoints were saved at key<br />
locations to improve the accuracy of mapping and to provide a means of returning to places<br />
of interest for further surveying and description of habitats. The information was used to<br />
compile thematic maps, using the topographic maps as a base, but in the ongoing process of<br />
information exchange the airphotos were found to be a more effective tool than line-drawn<br />
representations of the <strong>Bay</strong>. People who were not familiar with interpreting either line-drawn<br />
maps or aerial views would very easily orient themselves to features in the airphotos despite<br />
never previously having had access to such a perspective of their environment.<br />
Once the main reefs had been identified, a large painting depicting a vertical view of the <strong>Bay</strong><br />
was prepared on a 4ft X 8ft sheet of plywood. The reefs identified in the field trips were<br />
clearly shown and labelled with their local names. As with the airphotos, people readily<br />
oriented themselves to the features in the painting and were able to provide and locate<br />
additional details. This painting was used in planning activities and in public meetings as a<br />
centre for discussion which allowed people to continue to contribute information related to<br />
specific locations. Later it became possible to borrow an LCD projector and this was used<br />
with the project computer at evening meetings in the village marketplace. This was an<br />
effective means of presenting various types of information, including maps, text and tables of<br />
data from surveys, but was particularly effective when projecting colour airphotos of the <strong>Bay</strong>.<br />
Projecting the airphotos in Map Maker allowed graphic annotations to be displayed as<br />
thematic layers but equally important it was a dynamic tool that allowed new information to<br />
be added and displayed during the meetings. It is worth noting that the use of a laptop<br />
computer and projector appeared to be quite appropriate for public meetings in the village<br />
marketplace.<br />
Field surveys<br />
Interpretation of some of the features identified in the airphotos was aided by photographs<br />
taken at lower altitude from a helicopter. In cases of uncertainty reef locations were<br />
confirmed by swimming around their boundaries while storing routes or waypoints in a GPS.<br />
To map the variation of reef community composition benthic surveys were conducted using<br />
the Reef Check protocol (Reef Check Foundation 2003) which had been selected by the<br />
Global Coral Reef Monitoring Network (GCRMN) as the community-level reef assessment<br />
tool. The protocol quantifies relative cover of different substrate types including live coral<br />
and macroalgae as indicators of reef condition.<br />
8
2 '<br />
N<br />
Most field surveys were conducted with a kayak, aided by GPS, a hand-held depth sounder<br />
and underwater camera equipment. The kayak was a convenient platform either for two<br />
people with snorkelling gear or for one person with SCUBA gear. GPS waypoints were used<br />
to locate specific reef and seagrass sites for repeated visits, such as the monitoring of sea<br />
urchin populations.<br />
7 April 2003<br />
0° 9' 150"E 0° 9' 300"E 0° 9' 450"E 0° 10' E 0° 10' 150"E 0° 10' 300"E 0° 10' 450"E 0° 11' E 0° 11' 150"E<br />
5<br />
5<br />
0<br />
0<br />
7 0 96m<br />
9 0<br />
500<br />
508km<br />
500<br />
22m<br />
509km<br />
1,5 20 343m<br />
1,5<br />
20 343m<br />
6<br />
3 °<br />
3<br />
N<br />
3 00" 3 °32' 6<br />
2 '300"<br />
N<br />
Sapphire<br />
Koléwa<br />
Papè l<br />
1520km<br />
1520km<br />
Kay Mayòt<br />
T hegridattheeasternedgeofthe<br />
m<br />
ap<br />
is<br />
T he g ridatthe w esternedgeofthe m apis1°54' 5 0.22"dueeastoftruenorth<br />
N<br />
1 50" 3 °32' 6<br />
T<br />
R<br />
U<br />
E<br />
N<br />
O<br />
R<br />
T<br />
H<br />
Kay Tiyo<br />
Kay Tòti<br />
Kay Ska<br />
Kay Won<br />
Kay<br />
Siwijen<br />
Flatland<br />
Kay Kén<br />
500<br />
Twa<br />
Lanm<br />
500<br />
Bwizan<br />
Pwent-la<br />
Bwizé<br />
Kay Ati<br />
Labatwi<br />
T<br />
R<br />
U<br />
E<br />
N<br />
O<br />
R<br />
T<br />
H<br />
6<br />
3 °<br />
3<br />
2 '150"<br />
N<br />
6<br />
3 °<br />
3<br />
1 °58'<br />
1 3.53"dueeastoftruenorth<br />
N<br />
3 °32' 6<br />
Bwizan<br />
dènyé<br />
100 0 100 200 300<br />
Go Lou<br />
1:9,000<br />
metres<br />
1,5 19 081m<br />
1,5<br />
19 081m<br />
0<br />
5<br />
7 0 96m<br />
500 508km<br />
Scale 1: 9,000<br />
Centred on 508,059m, 1,519,712m UK National Grid ( 63° 32' 11.96" N 0° 10' 17.48" E )<br />
500 509km<br />
0<br />
0° 9' 150"E 0° 9' 300"E 0° 9' 450"E 0° 10' E 0° 10' 150"E 0° 10' 300"E 0° 10' 450"E 0° 11' E 0° 11' 150"E<br />
5<br />
9 0 22m<br />
© canari 2000<br />
METRES<br />
0 100<br />
100 200 300 400 500 600 700 800 900 1000 1100<br />
METRES<br />
Figure 7. Distribution of reefs in the study area.<br />
9
The availability of airphotos also allowed the mapping of the development of the village since<br />
1941, shown in Figure 8, and in Figure 5 based on the 1992 aerial survey.<br />
4 August 2003<br />
100 0 100 200<br />
1:8,000<br />
metres<br />
1941<br />
METRES<br />
1: 8,000<br />
0 100<br />
100 200 300 400 500 600 700 800 900 METRES<br />
4 August 2003<br />
100 0 100 200<br />
1:8,000<br />
metres<br />
1966<br />
METRES<br />
1: 8,000<br />
0 100<br />
100 200 300 400 500 600 700 800 900<br />
METRES<br />
4 August 2003<br />
100 0 100 200<br />
1:8,000<br />
metres<br />
1977<br />
METRES<br />
1: 8,000<br />
0 100<br />
100 200 300 400 500 600 700 800 900<br />
METRES<br />
Figure 8. Development of <strong>Laborie</strong> village from 1941 to 1977<br />
10
Discussion<br />
Access to information on the history of ecosystems and habitats provides a useful basis for<br />
understanding past trends and possible directions for management. Maps are an important<br />
component of the historical record that can provide invaluable details on the development of<br />
settlements and the urbanisation of coastal areas, changes in vegetation cover on land, and<br />
coastal changes due to natural processes human impacts. Old maps may include place names<br />
and annotations that reflect past conditions and types of resources or activities that no longer<br />
exist, but which may help in the interpretation of current features and conditions. In some<br />
cases, collections of airphotos may be available and these are particularly useful when there is<br />
a time series over a number of decades. Older airphotos focus primarily on the land but<br />
shallow marine features may be included. More recent photographic coverage conducted for<br />
land surveys is likely to be in normal colour which greatly enhances the interpretation of<br />
marine features. While terrestrial mapping has evolved relatively rapidly, updating the<br />
historical record, in the case of coral reefs the only information available for many islands,<br />
such as nautical charts, may be based on data collected in the 19 th Century. Reefs were often<br />
mapped relatively coarsely as navigational hazards, but the series of depth soundings on older<br />
charts provide a useful baseline for comparison with new surveys.<br />
One advantage of the present project was the opportunity gather and redistribute information<br />
over an extended time period as this allowed for an iterative process that is not possible in a<br />
single rapid assessment (Doolittle 2003). This process also encouraged the gradual<br />
involvement of people who only began to participate, often very constructively, after a<br />
period of observing from the fringes of the public meetings. While much of the information<br />
gathered showed that people had a good understanding of aspects of the environment in<br />
which they lived and worked, there are some limitations to the way that such information can<br />
contribute to a participatory mapping exercise. For example, people’s understanding may be<br />
limited to only those aspects that directly affect their livelihoods and different resource users<br />
will therefore have different interpretations of the same features and processes. An important<br />
part of information gathering, therefore, is the ability and opportunity to test and validate it.<br />
In addition to providing opportunities for people to contribute information, the mapping<br />
exercise was a useful tool for disseminating information, both at the popular level in<br />
community meetings and at the technical level in presentations to management agencies.<br />
There is an extensive literature on the use and mis-use of GIS and its potential to disempower<br />
communities and to formalise information that may not warrant it. The People and the Sea<br />
project demonstrated the benefits of the technology when the information base is developed<br />
through the integration of scientific and popular knowledge. While the project used some of<br />
the analytical tools available in the GIS application, probably the greatest benefit of GIS was<br />
in the use of its cartographic tools as a means of gathering and redistributing information at<br />
community meetings. The ability to manage both raster and vector images allowed the use of<br />
airphotos, GPS data and thematic layers which could be projected and manipulated during<br />
public discussions.<br />
The geographic information collected during the project was an essential part of the research<br />
and experimentation around which the project was designed. However, the use of this<br />
information resource extended beyond its research application. It was also an integral part of<br />
a real-life process of resource management that directly impacted people’s livelihoods, such<br />
as the participatory planning of sea urchin harvests, the development of an action plan for the<br />
11
future development of seaweed cultivation and the decisions taken to investigate options to<br />
reduce pollution levels in the <strong>Bay</strong>. These experiences demonstrated the potential benefits to<br />
the community of transferring this project information management system to the <strong>Laborie</strong><br />
community for its future use in resource management and development planning.<br />
Accordingly, all of the GIS components, includings maps, data, project documents and<br />
photographs have been installed on the project computer which has been given to community<br />
and housed in the offices of the <strong>Laborie</strong> Village Council. Following the closure of the People<br />
and the Sea project <strong>CANARI</strong> will provide training to two members of the community in<br />
managing the system, as part of a project aimed at further developing the GIS in support of<br />
<strong>Laborie</strong>’s efforts to better manage its reef resources.<br />
A note on the technology<br />
The use of GPS technology was greatly enhanced when the degradation of the satellite signals<br />
(through Selective Availability) for public use was discontinued shortly before the start of the<br />
project. Position errors were reduced from around 100m to the 15m resolution of most handheld<br />
GPS receivers without differential correction. Depending on satellite geometry,<br />
Estimated Position Error computed by the GPS was commonly between 3 and 4m. While<br />
precision was increased, accuracy presents a problem in the area and GPS data need some<br />
form of correction or post-processing. One option was to compare known coordinates and<br />
GPS coordinates for a number of locations and compute transform functions, such as the<br />
Molodensky transformation. Five factors could be calculated and used by Map Maker to<br />
improve accuracy, and while this was partly successful there are insufficient known sets of<br />
coordinates in the south of the island to make the best use of this option. Transform functions<br />
are most effective the closer the determination points are to the study site and functions<br />
determined from stations in the north of the island were found not to be helpful.<br />
Instead a second method was tested. A set of 10 – 12 waypoints were gathered at obvious<br />
landmarks and downloaded onto a calibrated 1:2500 topographic map. The process was<br />
repeated at three different times to include temporal variations in signal quality. In each case<br />
it was evident that the displacement of the waypoints relative to the landmarks on the map<br />
was uniform in distance and direction. By moving the waypoint thematic layer as a whole by<br />
a calculated distance and direction all waypoints could be seen to match their corresponding<br />
landmarks with a mean error of around 5m. This approach was therefore used to correct the<br />
GPS data collected on the water.<br />
12
Selected bibliography<br />
Doolittle, A. 2003. Finding a new direction during a participatory community mapping<br />
project. Tropical resources 22:74-78.<br />
Earth Sciences and Image Analysis, NASA-Johnson Space Center. 2003. The Gateway to<br />
astronaut photography of earth. http://eol.jsc.nasa.gov/<br />
Jackson, J.B.C., M.X. Kirby, W.H. Berger, K.A. Bjorndal, L.W. Botsford, B.J. Bourque, R.H.<br />
Bradbury, R. Cooke, J. Erlandson, J.A. Estes, T.P. Hughes, S. Kidwell, C.B. Lange, H.S.<br />
Lenihan, J.M. Pandolfi, C.H. Peterson, R.S. Steneck, M.J. Tegner and R.B. Warner. 2001.<br />
Historical overfishing and the recent collapse of coastal ecosystems. Science 293:629-<br />
638.<br />
Jesse, C. 1986. Outlines of St. <strong>Lucia</strong>’s history. <strong>Saint</strong> <strong>Lucia</strong> Archaeological and Historical<br />
Society, Castries, <strong>Saint</strong> <strong>Lucia</strong>. 99 pp.<br />
Reef Check Foundation. 2003. Reef Check survey instruction manual. Reef Check<br />
Foundation, Department of the Environment, University of California, USA. 21 pp.<br />
Reefbase. 2003. Reefbase: a global database on coral reefs and their resources.<br />
http://reefgis.reefbase.org/mapper.asp.<br />
Spalding, M.D., C. Ravilious and E.P. Green. 2001. World atlas of coral reefs. Prepared at the<br />
UNEP World Conservation Monitoring Centre. University of California Press, Berkely,<br />
USA. 294 pp.<br />
UNEP/IUCN. 1988. Coral reefs of the world. Volume 1: Atlantic and Eastern Pacific. UNEP<br />
Regional Seas Directories and Bibiographies. IUCN, Gland, Switzerland and Cambridge,<br />
U.K./UNEP, Nairobi, Kenya. 373 pp.<br />
13