Master Thesis - WEAP
Master Thesis - WEAP
Master Thesis - WEAP

You also want an ePaper? Increase the reach of your titles
YUMPU automatically turns print PDFs into web optimized ePapers that Google loves.
Examensarbete<br />
TVVR 07/5008<br />
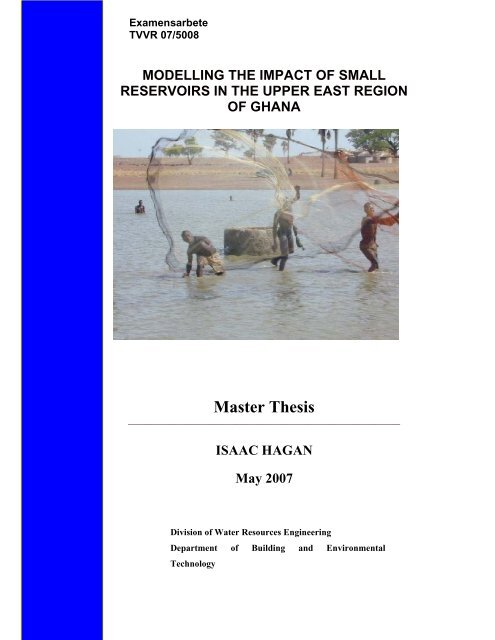
MODELLING THE IMPACT OF SMALL<br />
RESERVOIRS IN THE UPPER EAST REGION<br />
OF GHANA<br />
<strong>Master</strong> <strong>Thesis</strong><br />
_________________________________________________________________<br />
ISAAC HAGAN<br />
May 2007<br />
Division of Water Resources Engineering<br />
Department of Building and Environmental<br />
Technology
Avdelning för<br />
Vattenresurslära<br />
ISRN<br />
ISSN<br />
Teknisk<br />
Modelling the Impact of Small Reservoirs in the<br />
Upper East Region of Ghana<br />
Division of Water Resources Engineering<br />
Department of Building and Environmental Technology<br />
Lund University, Sweden<br />
May 2007<br />
Supervisor: Associate Professor Rolf Larsson<br />
Examiner: Professor Ronny Berndtsson<br />
Picture on front page:<br />
A Small Reservoirs in the Upper East Region of Ghana(SRP<br />
website, 2006).<br />
<strong>Master</strong> <strong>Thesis</strong> by:<br />
Isaac Hagan
Copyright ©. Isaac Hagan<br />
Report TVVR 07/5008<br />
<strong>Master</strong> of Science <strong>Thesis</strong> in Water Resources<br />
Division of Water Resources Engineering<br />
Faculty of Engineering, Lund University<br />
Box 118 SE - 221 00 Lund<br />
Sweden<br />
Phone: +46 46 222 000<br />
Web Address: http://aqua.tvrl.lth.se
ABSTRACT<br />
Reservoirs are precious assets in semi arid and arid regions of the world. The Upper East Region<br />
of Ghana by virtue of its climatic condition is classified as a semi arid region. It has a total of 160<br />
small reservoirs located on streams and rivers which are in the upstream of the Ghana portion of<br />
the Volta Basin. There have been significant reductions in the flow of water from all the three<br />
main tributaries to the Volta Lake which is further downstream and contains the Akosombo<br />
Hydro- power dam the main source of the countries electricity supply.<br />
The effect of many small reservoirs in the Upper East Region of Ghana was investigated using<br />
the <strong>WEAP</strong> model. A total of 61 small reservoirs were identified on streams and rivers in the<br />
region. This number was achieved by adding very small reservoirs together. They were classified<br />
as Small Reservoir 1, 2 and 3 (SR1, SR2 and SR3) corresponding with their sizes.<br />
The model was first adapted to the region and calibrated using measured discharge values. Then<br />
three different scenarios were created to access the impact of the small reservoirs on the White<br />
Volta River.<br />
The results obtained indicate that the reservoirs have low impact on the flow of the White Volta<br />
River. However the creation of bigger reservoirs on the river could have significant effect on the<br />
flow of the WVR and reduces its contribution to the Akosombo Lake which is further<br />
downstream in the Volta Basin.<br />
i
ACKNOWLEDGEMENTS<br />
Sincere thanks go to the Almighty God for making this thesis a success. This project work would<br />
not have been possible without the help of Prof.dr.ir. Nick van de Giesen of Delft for his<br />
directions and support. I will also like to thank Mr. Ampomah of the Ghana Water Resources<br />
Commission who assisted me with the data.<br />
Sincere thanks also go to my supervisor Dr. Rolf Larsson. Great thanks also go to my sponsors,<br />
my family and all my friends for their immense contributions.<br />
ii
LIST OF FIGURES<br />
Figure 2.1 A sketch of a small reservoir showing the various part<br />
Figure 3.1 Map showing the Upper East Region in relation to Ghana (adapted from Leibe 2002)<br />
Figure 3.2 Network of Rivers and streams in the UER.<br />
Figure 3.3 Map showing the distribution of Reservoirs in the UER (J. Leibe et al.)<br />
Figure 3.4 Monthly net potential evaporation and volume depth relationship of reservoirs in the<br />
UER (Leibe 2002).<br />
Figure 4.1 Schematic view of <strong>WEAP</strong> model showing the various nodes.<br />
Figure 5.1 A detailed schematic view of the study area in the <strong>WEAP</strong> model<br />
Figure 5.2 An overview of the UER in the <strong>WEAP</strong> model<br />
Figure 6.1 The flow of water from the various streams in billion m 3 in the UER for the current<br />
account year 2004.<br />
Figure 6.2 Chart of stream flow for streams in the UER in million m 3<br />
Figure 6.3 Reservoirs storage volumes for various months in million m 3<br />
Figure 6.4 Stream Flow for Increase in Demand scenario.<br />
Figure 6.5 Stream flow for Increased Demand Scenario and the Reference Scenario<br />
Figure 6.6 Demand site coverage for year 2010 for some selected reservoirs in the very dry year.<br />
Figure 6.7 Demand coverage 2013 for some selected reservoirs.<br />
Figure 6.8 Unmet demands<br />
Figure 6.9 Reservoir storage volumes Mm 3 .<br />
iii
LIST OF TABLES<br />
Table 2.1 Organisations and their roles in the White Volta Basin (UNESCO, 2006).<br />
Table 2.2 Existing Irrigation sites and their water requirements in Ghana (Kwabena Wiafe, 1997)<br />
Table 3.1 Various tributaries of the White Volta Basin and their areas and length (UNESCO,<br />
2006)<br />
Table 3.2 Rainfall and annual runoff for selected stations (Andah et al, 2005).<br />
Table 3.3 Distribution of small reservoirs by districts. (Leibe, 2002)<br />
Table 5.1 Categories of the reservoirs and their properties.<br />
Table 5.2 Water use and irrigated areas of two small scale irrigation sites in the UER (Faulkner,<br />
2006)<br />
Table 5.3 Water Year Method for various years under scenarios<br />
Table 5.4 New Reservoirs and their properties.<br />
iv
LIST OF ABBREVIATIONS<br />
UN United Nation<br />
UER Upper East Region<br />
<strong>WEAP</strong> Water Evaluation and Planning Model<br />
SRP Small Reservoir Project<br />
WVB White Volta Basin<br />
WVR White Volta River<br />
PMP Probable Maximum Precipitation<br />
PMF Probable Maximum Flood<br />
WMO World Metrological Organisation<br />
DA District Assembly<br />
IFAD International Fund for Agricultural Development<br />
FAO Food and Agricultural Organisation<br />
GWP Global Water Partnership<br />
v
TABLE OF CONTENTS<br />
ABSTRACT……………………………………………………………………………………i<br />
ACKNOWLEDGEMENTS…………………………………………………………………..ii<br />
LIST OF FIGURES…………………………………………………………………………..iii<br />
LIST OF TABLES……………………………………………………………………………iv<br />
LIST OF ABBREVIATIONS………………………………………………………………...v<br />
TABLE OF CONTENTS……………………………………………………………………..vi<br />
1 INTRODUCTION………………………………………………………………………….1<br />
1.1 Background………………………………………………………………………………...1<br />
1.2 Research Problem…………………………………………………………………………2<br />
1.3 Objective…………………………………………………………………………………. 2<br />
1.4 Scope of Work…………………………………………………………………………….2<br />
1.5 Review of Previous Work………………………………………………………………....3<br />
1.6 Limitations………………………………………………………………………………...3<br />
1.7 Structure of report…………………………………………………………………………4<br />
2 LITERATURE REVIEW………………………………………………………………….5<br />
2.1 Importance of Reservoirs and Dams……………………………………………………... 5<br />
2.2 Technical aspects of Small Reservoirs…………………………………………………… 5<br />
2.3 Environmental Aspects of Small Reservoirs……………………………………………...6<br />
2.4 Institutional Framework of Small Reservoirs……………………………………………. 7<br />
2.5 Economic Analysis of Small Reservoirs………………………………………………….7<br />
2.6 Integrated Water Resources Management of the White Volta Basin…………………….7<br />
2.7 Irrigation and crop water requirements in the basin……………………………………...10<br />
3 STUDY AREA……………………………………………………………………………..12<br />
3.1 General Overview………………………………………………………………………...12<br />
3.2 Climate and Rainfall Patterns………………………………………………………….....13<br />
3.3 White Volta Basin………………………………………………………………………...13<br />
3.4 General Reservoir Properties and Distribution…………………………………………...17<br />
3.4.1 Potential Evaporation of reservoirs in the UER………………………………………...18<br />
3.5 Land Cover and Use………………………………………………………………………19<br />
3.6 Water Uses in the UER…………………………………………………………………...19<br />
3.7 Downstream of the White Volta…………………………………………………………..20<br />
4. <strong>WEAP</strong> MODEL…………………………………………………………………………...21<br />
4.1 Introduction and Development of <strong>WEAP</strong>………………………………………………....21<br />
4.2 Model Structure……………………………………………………………………………21<br />
4.3 Modelling Process of <strong>WEAP</strong>……………………………………………………………...23<br />
4.4 Applications of the <strong>WEAP</strong> model………………………………………………………....23<br />
5 METHOD…………………………………………………………………………………...25<br />
5.1 Input Data………………………………………………………………………………….25<br />
5.2 Modelling Process ……………………………………………………………………… 25<br />
5.2.1 Calibration of the Model……………………………………………………………… 25<br />
5.2.2 Assumptions Made………………………………………………………………………27<br />
5.3 Creation of Scenarios………………………………………………………………………29<br />
5.3.1 Scenario 1; Increase in the Number of Small reservoirs………………………………...30<br />
5.3.2 Scenario 2; Increase in irrigated Land/Increase in Demand……………………………...31<br />
5.3.3 Scenario 3; Increase in Demand during the wet months…………………………………31<br />
6 RESULTS AND DISCUSSION…………………………………………………………….32<br />
vi
6.1 Introduction……………………………………………………………………………….. 32<br />
6.2 Calibration results………………………………………………………………………….32<br />
6.2.1 Stream Flow……………………………………………………………………………...32<br />
6.2.3 Reservoir storage capacities……………………………………………………………...34<br />
6.2.4 Demand site coverage……………………………………………………………………35<br />
6.3 Simulation Results…………………………………………………………………………36<br />
6.3.1 Scenario 2 Increase Demand…………………………………………………………….36<br />
6.3.1.1 Stream Flow……………………………………………………………………………36<br />
6.3.1.2 Demand Coverage……………………………………………………………………. .47<br />
6.3.1.3 Reservoir Storage volume……………………………………………………………...40<br />
6.3.2 Scenario 3; Increase in Demand during the Wet Season………………………………...40<br />
6.3.2.1 Demand Coverage……………………………………………………………………...40<br />
6.3.2.1 Reservoir Storage volume……………………………………………………………...41<br />
6.3.3 Scenario 2; Increase in reservoirs……………………………………………………….41<br />
6.3.3.1 Stream flow…………………………………………………………………………….41<br />
6.3.3.2 Reservoir Storage Volume……………………………………………………………..41<br />
6.4 Evaluation ………………………………………………………………………………..41<br />
6.5 Planning ………………………………………………………………………………..42<br />
7 CONCLUSIONS…………………………………………………………………………....43<br />
8 REFEERENCES……………………………………………………………………………44<br />
APPENDIX…………………………………………………………………………………....47<br />
Appendix 1 Results of Stream flow for the current account year……………………………...47<br />
Appendix 2 Results for Reservoirs storage volumes for the current account year<br />
in Mm3………………………………………………………………………………………....48<br />
Appendix 3 Results of demand site coverage in percentage for the current account<br />
year……………………………………………………………………………………………..49<br />
Appendix 4 Results of the demand site coverage in percentage for the year 2010…………….50<br />
Appendix 5 Results of the storage volume of reservoirs for scenario 3;<br />
Increase in demand during the wet months……………………………………………………..51<br />
Appendix 6 Results of the demand in percentage of the additional reservoirs as<br />
described in scenario 2………………………………………………………………………….52<br />
Appendix 7 Discharge values for some selected gauge stations………………………………..53<br />
vii
1 INTRODUCTION<br />
1.1 Background<br />
“Water is an essential life sustaining element. It pervades our lives and is deeply embedded in our<br />
cultural backgrounds” (UN World Water Development Report, 2006).<br />
Water is required by all living creatures for survival. It is also required for economic growth and<br />
development. The achievement of the millennium development goals depend largely on improved<br />
water supply and sanitation in the developing countries. Issues of drought, flood, and extreme<br />
climate change have dominated the news in recent times and have caused the death of thousands<br />
of people. This has caused governments of certain countries such as Ghana to take more stringent<br />
action on water resources management. The management of water resources is the concern of all<br />
stakeholders involved. Most of the rivers in the world have been dammed to serve as water<br />
storage facilities for hydropower generation, drinking water supply and irrigation purposes.<br />
Reservoirs are indispensable storage facilities in arid and semi-arid regions of the world where<br />
there is irregular rainfall. Extreme drought and floods characterize these areas resulting in<br />
insecure livelihood.<br />
Small multi purpose reservoirs are used widely for the provision of drinking water and irrigation<br />
purposes. In the rural areas of Ghana where surface water is scarce, reservoirs are used for daily<br />
activities to improve the livelihood of the people. The Upper East Region of Ghana and other<br />
Northern Regions of Ghana where there is irregular rainfall patterns, small dams have been<br />
constructed on small rivers and streams to ensure a year round growing season and also water<br />
supply for livestock and domestic purposes as well.<br />
Small dam development in the Northern regions of Ghana have been considered as one of the<br />
solutions for curtailing the higher incidence of poverty by improving the standard of living of the<br />
people through improved smallholder irrigation techniques and livestock production. They are<br />
seen as important tool in achieving some of the goals of vision 2020 of Ghana and also the United<br />
Nations Millennium Development goals of poverty reduction.<br />
1.2 Research Problem<br />
There have been major developments of a large number of small reservoirs in all the six riparian<br />
countries of the Volta Basin. These are mainly situated on the upstream portion of the basin<br />
depending on the country. Burkina Faso and Ghana are the countries with a greater portion of the<br />
basin in terms of areas and major development of small dams are peculiar in these countries.<br />
They are used mainly for water supply and for irrigation purposes. The developments of small<br />
reservoirs have significant effect on the flow of the rivers on which they are situated. For the case<br />
of the Volta basin where the reservoirs are located upstream there is the possibility of inadequate<br />
1
flows in the downstream portion of the basin and other hydrological problems such as increased<br />
evaporation leading to rapid dry up of some of the streams generating serious repercussions.<br />
There is also the problem of location of small reservoirs to ensure adequate water throughout the<br />
year to meet irrigation and livestock demands.<br />
There is the need to ascertain the impact of this large number of small reservoirs on the Volta<br />
basin with regards to the downstream communities and the general flow condition of the rivers.<br />
This can assist in the construction and planning of these small reservoirs in order to minimize the<br />
effect on the downstream users.<br />
There is also the need to find out how these small reservoirs in the upstream portion of the basin<br />
affect the hydro-power dam located in Akosombo which is downstream of the Volta River.<br />
1.3 Objective<br />
The main objective of this thesis work is to find out the extents to which the large numbers of<br />
small reservoirs affect the downstream users. The other objective will be to find a way of<br />
evaluating and planning the construction of many of these small reservoirs to ensure efficient use<br />
of the water resources in the Upper East Region of Ghana.<br />
These objectives will be achieved using the Water Evaluation and Planning Model (<strong>WEAP</strong><br />
Model).<br />
1.4 Scope of Work<br />
The thesis work will cover the Upper East Region of Ghana which has a large number of small<br />
reservoirs, 160 in number (J. Leibe et al, 2005) with the Tano and Vea being the biggest. The<br />
study will cover reservoirs which are located on the various streams in the region. That means<br />
that small reservoirs which are not located on any river or stream will not be considered in this<br />
study. The Tano and Vea reservoirs will not be included in this study because according to their<br />
areas they are not classified as small reservoirs. This may produce some discrepancies in the<br />
results.<br />
The thesis will involve the following<br />
• Identification of the various reservoirs and their locations in the region<br />
• Quantification of water for farming and livestock production purposes<br />
• Calibration of the <strong>WEAP</strong> model<br />
• Creation of scenarios and evaluation.<br />
2
1.5 Review of Previous Work<br />
There are a lot of research activities going on in the whole Volta Basin. The Small Reservoir<br />
Project (SRP) is currently undertaking research works on planning and evaluating ensembles of<br />
small, multi-purpose reservoirs for the improvement of smallholder livelihoods and food security:<br />
tools and procedures (SRP website, 2006).<br />
The SRP is part of the Challenge Programme for water and food. Research works already<br />
conducted in the UER of Ghana includes estimation of reservoirs storage capacities and<br />
evaporation losses from small reservoirs in which various categories of small reservoirs were<br />
identified according to their storage capacities and their surface areas. Evaporation losses from<br />
these reservoirs were also identified (J. Leibe et al, 2005). There have been studies into the water<br />
use, productivity, and profitability of small scale irrigation schemes in UER. The study involved<br />
two irrigation farming sites with two different technologies. It also involved the measurement of<br />
water released per area of farmland (Faulkner, 2006)<br />
1.6 Limitations<br />
The data obtained were from previous field studies conducted by individuals and organisations<br />
working on the various projects on the main Volta Basin and specifically in the Upper East region<br />
of Ghana. These differences in data may generate some differences in the data set. The total<br />
number of reservoirs in the Upper East region was not considered since most of them are located<br />
on the small streams which have no or inadequate flow data. This will affect the result obtained<br />
from the simulation. Moreover the exclusion of the two big reservoirs Tano and Vea will affect<br />
the results significantly because they store a large volume of water for a large scale irrigation<br />
purposes. This thesis work was also limited to 61 reservoirs out of a total of 160 reservoirs in the<br />
Region.<br />
3
1.7 Structure of report<br />
This report is made up of eight chapters. The first chapter is introduction which describes the<br />
objectives of the study. The second chapter is the literature review and talks about integrated<br />
water resources in the White Volta Basin and general reservoir properties construction and its<br />
importance. The third chapter is a description of the study area and talks about the general living<br />
conditions in the study area, the rainfall characteristics, land use, uses of water and the White<br />
Volta basin.<br />
The fourth chapter describes the <strong>WEAP</strong> model, it characteristics and applications. Its also<br />
describes how the model works and some application of the model. The next chapter is the<br />
method of the thesis and describes the steps taken to achieve the objectives of the thesis. The<br />
chapter that follows this present the results and discussion of the thesis which is also followed by<br />
conclusion and recommendation chapters, reference chapter and the appendix.<br />
4
2 LITERATURE REVIEW<br />
2.1 Importance of Reservoirs and Dams.<br />
A reservoir is a man-made lake which is created when a dam is built on a river or a stream. The<br />
river or stream water back up behind the dam creating a reservoir which is used for various<br />
purposes. The reservoir is equipped with an outlet structure which is constructed with concrete or<br />
pipe. They are mostly constructed for the following purposes<br />
• To hold water for domestic use, agricultural purposes (irrigation) and for industrial use.<br />
When water is retained in reservoirs they are made to go through a period of self<br />
purification since sedimentation is allowed to take place. The water is then clear to some<br />
extent to be used for domestic purposes.<br />
• To hold water to prevent flooding when there is intense rainfall that can cause flooding to<br />
a community. Reservoirs commonly used for this purposes are called attenuation<br />
reservoirs and are used to prevent flooding of low lying areas. They store water during<br />
periods with abnormally high rainfall and gradually release the water during periods of<br />
low rainfall.<br />
• To hold water for the purposes of electricity generation and for powering wind mills. The<br />
reservoirs for this purpose are equipped with turbines which generate the electricity.<br />
Reservoirs can be constructed for secondary purposes as recreation such as sailing, fishing and<br />
water skiing.<br />
2.2 Technical aspects of Small Reservoirs<br />
Small reservoirs (size approximately 0.01 km 3 ) ( SRP Website, 2006) are a result of small dams<br />
constructed on streams or rivers to impound water and are mostly constructed with earth materials<br />
such as clay, gravels, rocks or sometimes boulders. Most reservoirs normally use clay which has<br />
been well compacted as the water proofing element which prevent loss of water through seepage.<br />
The banks of the reservoirs can be of gravel or boulders depending on the condition of the<br />
existing soil type and the purpose of the reservoir. A simple small reservoir is shown in the figure<br />
2.1. The use of good earth material is a prerequisite for long lasting reservoirs and also for<br />
efficient utilization. That is to say that the efficiency of the reservoir is dependent on the materials<br />
used in the construction.<br />
Proper surveying and field studies should be conducted before the construction begins. Field<br />
studies involves the selection of site and the determination of slope of the reservoir which is<br />
another important steps since this is required to ensure constant flow into and out of the reservoir.<br />
.<br />
5
Incoming<br />
Stored water<br />
Spill gate<br />
Lining of reservoir<br />
Figure 2.1 A sketch of a small reservoir showing the various part<br />
The spillway is the part that is used to empty the reservoirs when too much water has been stored<br />
in the reservoir. It normally consists of an outlet pipe made of either caste concrete or PVC pipes.<br />
The lining of the reservoir could be of well compacted clay or a water proofing material such as<br />
polyethene. The riverbed could be gravels bed with a good slope to ensure adequate flow into the<br />
reservoir.<br />
Small reservoirs in the UER of Ghana are mostly constructed with compacted earth mostly clay<br />
material with the people in the communities providing the labour during construction. The<br />
embankment is also made of clay. The spillways are designed based on the Probable Maximum<br />
Flood (PMF) which is estimated from the PMP (Probable Maximum Precipitation). The PMP is<br />
defined according to WMO in 1986 as “the greatest depth of precipitation for a given duration<br />
that is meteorologically possible for a given size storm area at a given particular location at a<br />
particular time of year” (WMO, 1986).<br />
The size of the small reservoir in a community is normally driven by the budget allocation of the<br />
institutions providing the funds and not necessarily on the intending uses of the reservoir.<br />
2.3 Environmental Aspects of Small Reservoirs<br />
The proper functioning of an ecosystem depends to a large extent on water. Water is therefore<br />
indispensable in an ecosystem and it flora and fauna (A. B. Avakyan et al 2001). It is an<br />
important aspect of the ecosystem providing a breeding place for birds and sustenance of other<br />
wildlife.<br />
Small reservoirs which are not properly managed can serve as breeding grounds for mosquitoes<br />
and thereby increasing the prevalence of malaria in that community. There is the need to<br />
understand the interaction between the reservoirs and the ecosystem in order to conserve and also<br />
improve it thereby eliminating the negative effect of small reservoirs.<br />
During periods of floods, erosion of the banks of the reservoirs can cause significant damage to<br />
the reservoirs and the nearby farmland can be inundated. Another environmental problem<br />
associated with small reservoirs is their inability to flush out pollutants from the communities as a<br />
6
esult of nutrients generated from the use of chemicals for farming. This makes the community<br />
susceptible to water borne diseases.<br />
2.4 Institutional Framework of Small Reservoirs<br />
The reservoirs in the UER and the most of the other northern part of Ghana were constructed<br />
through project funded by various Non - governmental organisations which are undertaken<br />
various developmental projects. There is therefore little or no coordination among these<br />
organisations in the management of these reservoirs (SRP website, 2006). The management of<br />
these reservoirs is a duty of the communities which are benefiting from the projects. The districts<br />
assemblies (DA’s) play an important role when it comes to the management of these reservoirs by<br />
training personal in the communities in the management of the reservoirs. The agricultural<br />
department of the district assemblies are normally responsible for the training. The Vea and Tano<br />
reservoirs in the UER have a good management body which undertake their own maintenance<br />
and management aspect.<br />
2.5 Economic Analysis of Small Reservoirs.<br />
Reservoirs in the region are used for smallholder irrigation and livestock production. The farmers<br />
do not have to pay for the use of these small reservoirs and do not have to spend some of their<br />
profit on the maintenance of the reservoirs. The little profit generated from the sale of their<br />
produce goes a long way to improve the standard of living of the people.<br />
A lot of benefits are derived from the construction of small reservoirs as already mentioned. They<br />
can be a good avenue for the eradication of poverty in the communities if they are properly<br />
managed and maintained.<br />
Net returns of USD 109 and USD 53 for plots of 0.05 ha of tomato and onion, respectively<br />
pertains in the UER which is very substantial if one considers the poverty situation in the region.<br />
(IFAD, 2006)<br />
2.6 Integrated Water Resources Management of the White Volta Basin<br />
Integrated water resources management encompasses water resources as an integral part of the<br />
ecosystem and also as natural resources. According to the Global Water Partners (GWP) IWRM<br />
is defined as (GWP website, 2006) “the process which promotes the co-coordinated development<br />
and management of water, land and related resources, in order to maximize the resultant<br />
economic and social welfare in an equitable manner without compromising the sustainability of<br />
vital ecosystems.” There are various other definitions of IWRM.<br />
The water resource users in a watershed or basin form part of the management of the entire basin.<br />
There are various guidelines or principles under the concept of IWRM. The Dublin Principles are<br />
generally used as a set of guidelines for IWRM. These principles have been carefully formulated<br />
7
and have been internationally accepted as guidelines for IWRM. The Dublin guidelines are<br />
outlined below. (GWP, 2006)<br />
• Water is a finite and vulnerable resource essential to sustain life, environment and<br />
development. The principle requires a holistic approach to water resources management.<br />
All the elements of the hydrologic cycle and their interaction with the ecosystem should<br />
be taken into account in addressing issues of IWRM.<br />
• Water development and management should be based on a participatory approach,<br />
involving users, planners and policymakers at all levels. The principle recognizes water<br />
as a resources in which all stakeholders should be involved in it management. A<br />
stakeholder in the water sector includes everyone since everyone uses water. In this<br />
regards various communities forming part of a river basin should be involved in the<br />
decision making of the management of the river basin.<br />
• Women play a central part in the provision, management and safeguarding of water. It<br />
has been widely accepted that women play a very important role when it comes to<br />
collection, use and safeguarding of water resources for domestic and agricultural use.<br />
Women should therefore be involved in the decision making processes of water resources<br />
management.<br />
• Water has an economic value in all its competing uses and should be recognized as an<br />
economic good. If water is recognized as an economic good more value would be placed<br />
on water resources. This could ensure efficient use of water resources since people would<br />
be made to recognized how expensive it is in the provision of water for domestic,<br />
agricultural and industrial purposes<br />
There are a lot of organizations which are responsible for Integrated Water Resources<br />
Management of the White Volta basin. Table 2.1 shows the various organizations and their roles<br />
in the White Volta Basin.<br />
8
Table 2.1 Organisations and their roles in the White Volta Basin (UNESCO, 2006).<br />
Organization<br />
Role<br />
The Ghana Water Resources<br />
Commission<br />
Implementation and dissemination of IWRM<br />
District Assemblies<br />
Provision of Socio-economic infrastructures.<br />
Non Governmental organization e.g.<br />
TRAX, Rural Aid, World vision<br />
international<br />
Provides financial as well as technical works.<br />
International Water Management<br />
Institute IWMI<br />
Undertaking small dams projects in the Basin<br />
ECOWAS<br />
Responsible for the eradication of<br />
Onchocerciasis<br />
CGIAR: Challenge Program International Research on food and water<br />
WVBB White Volta Basin Board, Ghana<br />
IUCN/EU<br />
Volta Governance, International<br />
ZEF: GLOWA-Volta Project<br />
Decision Support System<br />
These organizations are working in collaboration to solve a lot of pressing issues in the Basin.<br />
Hydrological and water management issues such as small scale irrigation, Climate change for<br />
water management, Sporadic drought spells, Small hand-dug wells, Inclusion of Women and<br />
other marginalized groups in decision making process, Coordination of Water Management<br />
activities at the Basin Level and other environmental and livelihood issues are been addressed as<br />
well. Under the WVB pilot project the following activities have been undertaken: (UNESCO,<br />
2006)<br />
• Public Awareness creation of IWRM issues<br />
• Identification, registration, permitting and billing of water users<br />
• Building of a Decision Support System (DSS) as planning and decision tool<br />
• Strengthening of stakeholders capacities for IWRM and planning<br />
• Stakeholder process involving government agencies, district authorities, water<br />
institutions, traditional authorities, NGOs and actual water users<br />
Some of these activities have already been carried out<br />
9
2.7 Irrigation and crop water requirements in the basin<br />
Agriculture is the backbone of most developing countries in the world and Ghana is not an<br />
exception. Irrigation technologies allow more crops to be cultivated all year round with less<br />
dependent on rainfall. According to the FAO Ghana has a renewable water resource of 53.2km 3<br />
(FAO, 2006) Water used for crop production is 0.25 km 3 .This shows a very low rate of irrigation<br />
in the country. Irrigation in Ghana is practiced on the small scale basis and is informal. The<br />
cultivable area in Ghana is about 42% of the total area of the country out of which 4.25% of the<br />
area is under cultivation (FAO, 2006).<br />
Table 2.2 Existing Irrigation sites and their water requirements in Ghana (Kwabena Wiafe, 1997)<br />
Project Region Water<br />
Source<br />
Irrigable<br />
area<br />
( ha)<br />
Crops<br />
Irrigation water<br />
requirements<br />
( Mm 3 )<br />
Asutsuare G/Accra Main Volta 660 Rice 17.16<br />
Dawhenya A 404 Rice 10.5<br />
Tano U/East 2,207 Rice/<br />
Vegetables<br />
39.78<br />
Afife Volta Agali 880 Rice/okra 22.88<br />
Vea U/East Yagaratanga 850 Rice/<br />
Vegetables<br />
7.14<br />
Bontanga Northern 450 Rice /okro 11.7<br />
Afram<br />
plains<br />
Eastern Volta 101 Groundnuts/ve<br />
getables<br />
0.85<br />
Ashaiman G/Accra 117 Rice/okra 3.04<br />
Aveyime Volta Volta 63 Rice 1.64<br />
Kpando-<br />
Torkor<br />
Volta Main Volta 40 Okra 0.34<br />
Small<br />
schemes<br />
Northern<br />
16<br />
Rice/<br />
0.13<br />
Libga<br />
Golinga<br />
Northern<br />
26<br />
Vegetables<br />
0.68<br />
10
Ghana has the potential of developing 384,000 ha of irrigation based on water and soil<br />
availability. (World Bank Report, 2005). There is the possibility of developing approximately<br />
300,000 ha of irrigable land in the White Volta Basin and this is going to require close to 3600<br />
million cubic meters of water. (Kwabena Wiafe, 1997)<br />
The Irrigation Company of the Upper East Region of Ghana manages the biggest irrigation<br />
scheme in Ghana which is the Tano and Vea Irrigation schemes (Kwabena Wiafe, 1997). The two<br />
dams on the Vea and the Tano Rivers were constructed in the 1980’s and have since then become<br />
the largest managed irrigation schemes in the country. Agriculture contributes approximately<br />
60% of the Gross National Product (G.N.P) of the country and the livelihood of 80% of the<br />
people depends largely on agriculture (Kwabena Wiafe 1997). This has necessitated the<br />
development of irrigation in major areas of the country where rainfall is erratic can only support<br />
one planting season.<br />
11
3 STUDY AREA<br />
3.1 General Overview.<br />
The Upper East Region of Ghana is one of the most deprived or poorest regions (Ghana<br />
Statistical Department). It is situated in the centre of the Volta Basin in the north-eastern corner<br />
of Ghana and is bordered by Burkina Faso to the north and Togo to the eastern part. It has a<br />
population of 920,089 people according to the 2000 national census and has a population density<br />
of 96.6 inhabitants/km 2 and a growth rate of 3 %.( Asenso-Okyere et al, 2002). The region is the<br />
second lowest ranked in terms of mean annual income of approximately USD157. This is a little<br />
higher than the adjacent region which is Upper West Region. According to the Statistical<br />
Department of Ghana report in 1998 the Upper East Region has a poverty incidence of 88%. This<br />
means the region has the highest number of poor people in the country.<br />
The regional capital is Bolgatanga with other important towns such as Bawku, Navrongo and<br />
Paga. It is made up of 8 districts and has a land size of 8842 km 2 which is approximately 3.4% of<br />
the total land mass of Ghana and is predominantly rural (87%). The map showing the UER is<br />
shown in figure 3.1. The UER has the highest elevation of 455m in the northern part and the<br />
lowest of 122m in the southern part of the region. (Leibe 2002)<br />
Figure 3.1 Map showing the Upper East Region in relation to Ghana (adapted from Leibe, 2002)<br />
12
3.2 Climate and Rainfall Patterns<br />
The region just like the other Northern regions of Ghana have variable rainfall pattern with<br />
extreme cases of drought and sporadic flood and has an annual average rainfall of 1044mm which<br />
is suitable for a single wet season crops. Rainfall is usually between the months of July and<br />
September unlike the southern part of the country which has a relatively longer period of rainfall.<br />
The temperature is between 27°C and 36°C in the northern part and 24°C and 34°C in the<br />
southern part. The region is therefore characterised as a semi-arid.<br />
Most of the rains in the region fall as thunderstorm originating from squall lines (Eldridge, 1957;<br />
Hayward and Oguntoyinbo, 1987; Friesen, 2002). The region has a rainfall intensity which<br />
normally exceeds the infiltration capacity of the soil. This means that runoff occurs even without<br />
the soil been moist implying that groundwater is not replenished (J. Leibe et al, 2005) The UER<br />
has an average annual potential evaporation of 2025mm.<br />
3.3 White Volta Basin<br />
The UER falls within the White Volta basin which is a sub basin of the Volta Basin and has been<br />
classified as an Operational HELP Basin.( Hydrology for Environment Life and Policy) HELP is<br />
a joint initiative between United Nation Educational Scientific Organisation (UNESCO) and the<br />
World Metrological Organisation(WMO) and is led by the International Hydrological<br />
Programme. The objective of the HELP programme is to create new approaches to water basin<br />
managements through the creation of framework for water law and expert, water resources<br />
managers and water scientists to work together in solving water related problems. (UNESCO<br />
website, 2006). A basin is considered as an Operational HELP if it fulfils the following criteria;<br />
(UNESCO, website 2006)<br />
• “It has implemented the HELP philosophy<br />
• Has involved the HELP stakeholders in the management of the basin<br />
• is substantially functioning across several HELP key issues in an integrated manner;<br />
• demonstrates an active interface between science and water managers, and society;<br />
• has established mechanisms for unrestricted information and data access and exchange;<br />
• Follows the WMO Resolution 25 on international exchange of hydrological and related<br />
data.”<br />
13
It is one of the main tributaries of the Volta River and has a total area of 104,749 km 2 .The area<br />
in Ghana is 45804 km 2 and that in Burkina Faso is 58945 km 2 . It is located upstream of the lake<br />
Volta in Northern Ghana and southern part of Burkina Faso (UNESCO, website 2006). The area<br />
of the various tributaries of the White Volta basin and their length is shown in table 3.1. The<br />
network of the rivers and streams in the UER is also shown in figure 3.2<br />
Table 3.1 Various tributaries of the White Volta Basin and their areas and length (UNESCO, 2006)<br />
Name Area(Km 2 ) Length(km)<br />
White Volta 49,230 (106,740)* 1,140<br />
Tamne 880 50<br />
Morago 620 (1,610)* 80<br />
Mole 5970 200<br />
Kulpawn 10,600 (10,640)* 320<br />
Sisili 5,180 (8,950)* 310<br />
Red Volta 590 (11,370)* 310<br />
Asibilika 1,520 (1,820)* 100<br />
Agrumatue 1,410 (1,790)* 90<br />
Nasia 5240 180<br />
Nabogo 2960 70<br />
* Total area including catchment outside Ghana<br />
14
Figure 3.2 Network of Rivers and streams in the UER.<br />
The total annual discharge leaving Burkina Faso through the Red and White Volta Rivers is<br />
estimated at 3.7 km³/year (FAO Corporate Document Repository website, 2006). The land is<br />
predominantly flat, particularly in the southern part which is 0.1% (S.Wagner et al, 2002)<br />
There are a lot of projects going on in the White Volta basin. Among these is the Small Reservoir<br />
Project (SRP), the GLOWA Volta project, the Ghana Water Resource Commission and the<br />
CGIAR Challenge Program on Food and Water which are all aimed at improving the livelihood<br />
of the growing population in the region through intensive Research work. The White Volta falls<br />
15
within the interior savannah ecological zone. The geologic formation of the basin is Voltain and<br />
granite and there is generally low groundwater yield from dug wells and boreholes in the basin<br />
between 5.23 x10 -4 to 1.05 x 10 -3 m 3 /sec and an average depth of 38m (Kwabena Wiafe, 1997).<br />
According to Andah Runoff coefficients are generally low; meaning that direct recharge of<br />
aquifers from precipitation is less than 20% across the Basin. This figure means that less runoff<br />
end up as recharge for groundwater. (Andah et al, 2005)<br />
The White Volta River is one of the main tributaries of the Volta River which forms part of the<br />
Volta Lake. The Akosombo and Kpong dams use water from the Volta Lake for hydro-power<br />
production. Downstream of these dams, there are substantial farming activities which use water<br />
from these dams for irrigation practices.<br />
The Volta Lake is by far the largest man-made lake ever to be constructed in the world and is also<br />
the largest regulated Lake in the world. (Dams under Debate, 2006)<br />
The Akosombo Hydro power plant produces 912MW of electricity at it full capacity whiles the<br />
Kpong dam produces 160MW.( VRA website, 2006)<br />
In recent years there has been a significant reduction in the contribution of runoff from the white<br />
Volta river and the other rivers in the basin to the main Volta river (P. Gyau-Boakye, 2000) due<br />
to a lot of factors which include exploitation of water resources in the upstream of the white Volta<br />
river. Table 3.2 shows the mean annual runoff of the main rivers of the Volta Basin. The mean<br />
annual flow of the WVR is 9.57 billion m 3<br />
Table 3.2 Rainfall and annual runoff for selected stations (Andah et al, 2005).<br />
Sub-basins Total area (km 2 ) Mean Annual Mean annual Runoff Length (km)<br />
Rainfall (mm) runoff (x10 6 m 3 ) coefficient (%)<br />
Black Volta 149,015 10.23.3-1,348.0 767 8.3 1,363.3<br />
White Volta 104,749 929.7-1,054.2 9,565 10.8 1,136.7<br />
Oti 72,778 1,150.0-1,350.0 11,215 14.8 936.7<br />
Lower Volta 62,651 1,050.0-1,500.0 9,842 17.0<br />
Total 400,710 876.3-1,565.0<br />
Runoff Coefficient is related to different land covers and hydrological soil types<br />
16
3.4 General Reservoir Properties and Distribution.<br />
In northern Ghana and other semi-arid regions of the world reservoirs are most precious assets.<br />
There are lots of reservoirs used for various purposes in the UER of Ghana. This is an important<br />
and most easy way to overcome rampant drought and floods in the area and also give hope to the<br />
growing population. There are a total of 160 small reservoirs in the UER which have different<br />
storage surface areas ranging from 1 to 35 ha (J. Leibe et al).Many of these reservoirs were<br />
constructed by different organisations, mostly NGO’S undertaking various developmental<br />
projects in the UER. There is little or no coordination among the organisations undertaking the<br />
construction of these reservoirs (SRP website, 2006). This often makes the maintenance of the<br />
reservoirs a problem. Some are left to dry up and a lot of investment are left to go waste. The<br />
distribution of small reservoirs in the region is represented in figure 3.3.<br />
Figure 3.3 Map showing the distribution of Reservoirs in the UER (J. Leibe et al.)<br />
The number of reservoirs in the region varies from district to district. Table 3.3 shows the<br />
reservoir distribution according to districts and their surface areas. The Bawku East district has<br />
the highest number of small reservoirs with a total area of 323 ha. The reservoirs are categorized<br />
into three with category 1 having an area between 1 and 2.79 ha. Categories 2 and 3 have area<br />
between 2.88 and 6.93 ha and 7.02 and 35 ha respectively.<br />
17
Table 3.3 Distribution of small reservoirs by districts. (Leibe, 2002)<br />
No. of<br />
Reservoirs Total Surface Area (ha)<br />
District cat1 cat 2 cat3 Cat 1 Cat 2 Cat 3 Total<br />
Bawku East 6 17 17 40 11.34 72.36 239.40 323.10<br />
Bawku West 1 1 13 15 2.79 5.67 177.93 186.39<br />
Bolgatanga 10 8 4 22 19.35 37.71 44.46 101.52<br />
Bongo 10 7 2 19 17.91 35.91 34.38 88.20<br />
Builsa 10 6 7 23 14.94 30.51 93.06 138.51<br />
Kassena- 14 14 7 35 28.17 67.77 65.88 161.82<br />
Nankani<br />
TOTAL 51 53 50 159 94.5 249.93 655.11 999.54<br />
3.4.1 Potential Evaporation of reservoirs in the UER<br />
The monthly potential evaporation and the volume depth relationship according to Leibe, 2002 of<br />
the UER of Ghana are shown in figure 3.4. The net monthly potential evaporation was recorded<br />
over a period of ten years. The minimum and maximum evaporation was compared with the<br />
Meteorological station data of Navrongo.<br />
Figure 3.4 Monthly net potential evaporation and volume depth relationship of reservoirs in the UER<br />
(Leibe 2002).<br />
18
3.5 Land Cover and Use<br />
Land cover in a detailed sense refers to the attributes of a part of the earth’s surface and<br />
immediate subsurface, including biota, soil, topography, surface and ground water, and human<br />
structures((IGBP/IHDP, 1993).<br />
Land plays an important part of the development of agriculture for the sustenance of livelihood.<br />
The region falls within the Guinea Savannah ecological zone and is one of the erosion prone areas<br />
in Ghana. The soil is relatively dry due to less percolation from rainfall. The economic activities<br />
in the region is mostly agriculture. Majors crops cultivated are watermelons, cashew nuts;<br />
vegetables: tomatoes, onions. Livestock production is also predominant in the region with the<br />
rearing of animals such as cattle, sheep, goat, poultry and pigs.<br />
The land use in the UER and the whole of the White Volta basin is predominantly extensive land<br />
rotation cultivation approximately 3.2 to 9.6 km away from the village and extensive grazing of<br />
livestock. (FAO, 1991). Grazing lands are generally poor due to bush fires. Land sizes are usually<br />
small, often in the range of 1.2 ha. (Andah et al, 2005). In the UER and the whole of Ghana land<br />
is mostly owned by chiefs and traditional elders in the various communities. This creates a lot of<br />
problems with regards to the management and release of land. There is generally inadequate<br />
information on land use in the UER and the whole of the White Volta basin.<br />
3.6 Water Uses in the UER<br />
The region has it main source of water from streams and rivers with little contribution from<br />
groundwater. Agriculture production uses most of the water for mainly irrigation and livestock<br />
production. Boreholes are the major sources of water supply for domestic purposes for the people<br />
of the UER although the yield of groundwater is generally low. The water use for agriculture and<br />
livestock production is mainly from reservoirs which are used to store water during the wet<br />
season.<br />
The water demand in the UER is expected to increase due to an anticipated increase in the<br />
population, urbanization and improved standard of living of the people. Irrigation accounts for<br />
approximately 80 percent of the water use in the UER of Ghana and the entire Volta basin<br />
(Shiklomanov, 1999). Crops mostly grown in the area are maize, millet, rice and vegetables.<br />
Urban and rural water use is less at the moment. The rate of water use for domestic purpose is<br />
approximately 0.11 m 3 /s while that for irrigation purposes is 2m 3 /s. (Kwabena Wiafe, 1997).The<br />
type of irrigation mostly practiced in the UER is the gravity flow irrigation system with fewer<br />
technologies such as sprinkler and pump irrigation schemes.<br />
19
3.7 Downstream of the White Volta<br />
The downstream water use of the White Volta River is basically the hydro-power generation at<br />
the Akosombo dam. The White Volta basin is a major contributor to the hydropower generation.<br />
With a contribution of more than one third of the total flow into the lake Volta, the White Volta<br />
River is considered very important in the electricity generation. (Andah et al, 2004)<br />
Other use of the White Volta River is for irrigation purposes and drinking water supply. These<br />
uses are most of the time dependent on the upstream flow conditions. More upstream flow means<br />
more downstream uses and more contribution to the hydropower generation. Irregular flow<br />
upstream means less water would be expected in the downstream portion of the river. This<br />
implies that activities upstream are a major contributing factor to the downstream activities.<br />
In recent years there have been low water levels in the Akosombo dam. This prompted the Volta<br />
River Authorities to shut down some of their turbines and thereby introducing power shedding in<br />
some parts of the country. This has been primarily attributed to low flow from the major rivers<br />
into the Akosombo dam.<br />
The White Volta River is also dammed in the Burkina Faso portion indicating that the flow to the<br />
downstream users is, to a large extent, regulated.<br />
20
4. <strong>WEAP</strong> MODEL<br />
4.1 Introduction and Development of <strong>WEAP</strong><br />
Water Evaluation and Planning System (<strong>WEAP</strong>) is a microcomputer tool for integrated water<br />
resources planning (<strong>WEAP</strong> User guide 2005). It is easy to use and offers a comprehensive<br />
approach to water resources management.<br />
Various organizations have been responsible for the development of the <strong>WEAP</strong> model. The<br />
Stockholm Environmental Institute SEI provided primary support and the US Army Corps of<br />
Engineers provided funding for the development of the model.<br />
A number of agencies were involved in the development of the Model. They include The World<br />
Bank, USAID, and the Global Infrastructure Fund of Japan (<strong>WEAP</strong> User guide 2005).<br />
The model functions on the principle of water balancing. Since the first version of the model was<br />
developed in 1990 the model has been applied in a lot of research work. It has been applied<br />
primarily in a number of studies concerning;<br />
• Agricultural systems<br />
• Municipal systems<br />
• Single catchments or complex Trans-boundary river systems<br />
4.2 Model Structure<br />
The structure of the model is such that, the water resource system is represented in terms of<br />
groundwater, reservoirs withdrawal, transmission and wastewater treatment facilities; ecosystem<br />
requirements, water demands and pollution generation. The analyst can choose the level of<br />
complexity to meet the requirements of a particular analysis. This customization can also be used<br />
to reflect the limits caused by restricted data (Sieber et al, 2005).<br />
The model consists of five main views:<br />
Schematic<br />
The study area is defined in the schematic view. It is a GIS based tool which allows vector or<br />
raster layers to be imported and used as background layers. Its uses a drag and drop method in<br />
which objects such as demand nodes, reservoirs, groundwater supply, etc can be positioned. This<br />
allows for changes and modifications to be made in the area with ease. A sample of the schematic<br />
view is shown in figure 4.1.<br />
21
Figure 4.1 Schematic view of <strong>WEAP</strong> model showing the various nodes.<br />
Data<br />
The data view is where data is entered into the program. It allows variables and various<br />
assumptions to be created using mathematical relationships. Data can also be imported from<br />
Excel.<br />
Result<br />
Results are easily accessed. Every model output is displayed. This can also be exported to Excel<br />
for further modification.<br />
Overview<br />
This allows for easy accessibility of key indicators in the model.<br />
Note.<br />
Notes can be added to the model for documentation of the key assumptions.<br />
22
4.3 Modelling Process of <strong>WEAP</strong><br />
The modelling of a watershed using the <strong>WEAP</strong> consists of the following steps (Levite, 2003).<br />
• Definition of the study area and time frame. The setting up of the time frame includes the<br />
last year of scenario creation and the initial year of application.<br />
• Creation of the Current Account which is more or less the existing water resources<br />
situation of the study area. Under the current account available water resources and<br />
various existing demand nodes are specified. This is very important since it forms the<br />
basis of the whole modelling process. This can be used for calibration of the model to<br />
adapt it to the existing situation of the study area.<br />
• Creation of scenarios based on future assumptions and expected increases in the various<br />
indicators. This forms the core or the heart of the <strong>WEAP</strong> model since this allows for<br />
possible water resources management processes to be adopted from the results generated<br />
from running the model. The scenarios are used to address a lot of “what if situations”,<br />
like what if reservoirs operating rules are altered, what if groundwater supplies are fully<br />
exploited, what if there is a population increase. Scenarios creation can take into<br />
consideration factors that change with time.<br />
• Evaluation of the scenarios with regards to the availability of the water resources for the<br />
study area. Results generated from the creation of scenarios can help the water resources<br />
planner in decision making.<br />
4.4 Applications of the <strong>WEAP</strong> model<br />
The model has been applied to quite a number of basins in different countries of the world and<br />
still active in a lot of countries. It has been applied to Lake Naivasha in Kenya to develop an<br />
integrated water resource management model in order to attain both economical and ecological<br />
sustainability (Alfara 2004). The model was used to identify possible scenarios which can<br />
improve the current situation of the lake.<br />
It has also been applied in the complex situation of the Aral Sea to evaluate water resources<br />
development policies. By using the features of the scenario creation the <strong>WEAP</strong> model was used<br />
to provide a structured approach to integrated water- demand analysis (P. Raskin, et al 1990)<br />
Another application of the model is on the Volta Basin under the ADAPT project which is the<br />
Adaptation of Strategies for Changing Environment. Under the ADAPT project the model was<br />
used to investigate the effect of changing climate on the already stressed water resources, food<br />
security and the environment and the consequence on the socio- economic situation on the people<br />
living in the basin.(Andah et al, 2003)<br />
23
The model has also been applied in the following other areas:<br />
• In the United State of America the model has been used for a number of research projects<br />
and is still active in some States.<br />
• South Africa on water demand management scenario in a water stressed basin.<br />
• Limpopo and the Volta River Basins in Zimbabwe and West Africa for Planning and<br />
evaluating ensembles of small, multi-purpose reservoirs for the improvement of<br />
smallholder livelihoods and food security tools and procedures (SRP website, 2006).<br />
24
5 METHOD<br />
5.1 Input Data<br />
A GIS based vector layers of the area of UER of Ghana and the whole of the Volta Basin was<br />
obtained from the Volta Basin Starter Kit July 2006. The kit was compiled by the International<br />
Water Management Institute (IWMI) and the Challenge Program on Water and Food. The Starter<br />
kit also provided information on the runoff data and a range of other useful information.<br />
The year chosen for the current account was 2004. The runoff data for the year 2004 was obtained<br />
from the starter kit and other sources. Boundaries of the UER area were set using the raster layer<br />
of the whole Volta Basin which was also obtained from the Basin Starter Kit. Streams in the area<br />
were redrawn by using the drag and drop button of the river button on the <strong>WEAP</strong> model.<br />
Data on the water use and areas of irrigation was obtained from the study conducted on water use<br />
and irrigation of some selected areas of the UER of Ghana. (Faulkner 2006)<br />
5.2 Modelling Process<br />
5.2.1 Calibration of the Model.<br />
The current account year was used to calibrate the model. Reservoirs were categorized into three<br />
groups namely SR1, SR2 and SR3. Small Reservoir category three (SR3) has the biggest surface<br />
area in the range of 7.02 – 35 ha and SR2 have areas in the range of 2.88 to 6.93 ha while that of<br />
SR1 is in the range of 1–2.79 ha.(Leibe et al, 2005).<br />
An average value was obtained from this and the calculation of the storage capacity was done<br />
using the relation;<br />
Volume = 0.00857 x Area 1.4367 m 3 . (J. Leibe et al, 2005).Where the area is in meter square.<br />
All the reservoirs in the model were assigned a volume according to table 5.1.<br />
25
Table 5.1 Categories of the reservoirs and their properties.<br />
Reservoir Category Area (Ha) Average Area (m 2 ) Average Volume (m 3 )<br />
SR1 1-2.79 1,8950 11,984<br />
SR2 2.88-6.93 4,9050 46,991.8<br />
SR3 7.02-35 210,100 374,935.9<br />
SR4 SR 3+ SR 1<br />
SR5 SR 3 + SR 2<br />
Most of the reservoirs are located on the second and third order streams which have limited<br />
rainfall data. The streams and rivers were named River 1 to River 49 and include the major rivers<br />
which are White and Red Volta rivers. The reservoirs which are not located on any of the streams<br />
were not included in the study since they don’t have any hydrological links to any of the streams<br />
and therefore have no impact on the streams. This will reduce significantly the total amount of<br />
storage capacity for all the reservoirs, which 186 billion m 3 .<br />
Demand sites were limited to agricultural use for small scale irrigation systems. This is because<br />
80% of the water in the district is spent on growing crops and for livestock production. The<br />
demand sites in the model were denoted with the corresponding name of the town where the<br />
demand is located and with a number 1, 2 or 3 corresponding to the small reservoir close to the<br />
area.<br />
The demand priority was set to 1 in the model. The model uses demand priorities which can be<br />
set between 1 and 99 depending on the priority of the demand sites. The highest demand priority<br />
is 1 with the minimum being 99. A demand priority of 1 means that as long as there is flow in the<br />
river or streams that demand must be satisfied.<br />
Faulkner (2006) conducted a study into the water use and availability in the UER of Ghana. The<br />
results obtained in the study of two reservoirs and farming communities are presented in the table<br />
5.2.<br />
According to Faulkner the water release per area irrigated was found to be 11,365 m 3 /ha for the<br />
Weega system of irrigation which was a well managed system. The value obtained for the Tanga<br />
system of irrigation was 32,901m 3 /ha for the same crops as the Weega system. The Tanga system<br />
was described as a poorly managed system (Faulkner 2006).The average value of water released<br />
for the two systems was used in the model for all the reservoirs as their annual water use rate. The<br />
areas of land cultivated for the places where there are SR 3 type reservoirs were chosen to be<br />
approximately 9 ha. And that for SR2 and SR1 type reservoirs was set to be 2.6 ha and 1.6<br />
respectively. These values were used in the model based on the assumption that all the areas with<br />
26
SR3 type reservoirs have the same irrigated areas. The SR 4 type reservoir is a combination of<br />
SR3 and SR1 while the SR5 reservoirs is that of SR 3 and SR 2<br />
Table 5.2 Water use and irrigated areas of two small scale irrigation sites in the UER (Faulkner,<br />
2006)<br />
Area under<br />
Cultivation (ha)<br />
Total Water Released for<br />
Season (m 3 )<br />
Water Released per Area<br />
Irrigated (m 3 /ha)<br />
Tanga Canal A 0.8629 34121 39542<br />
Tanga Canal B 0.7591 19245 25352<br />
Tanga Total 1.6220 53366 32901<br />
Weega Canal A 2.8824 32373 11231<br />
Weega Canal B 3.1245 35895 11488<br />
Weega Total<br />
6.0069<br />
68268<br />
11365<br />
The figures 5.1 and 5.2 show an overview and a detail sample of the study area in the <strong>WEAP</strong><br />
model. It shows the major rivers and streams in the UER. The detailed sample of the schematic<br />
view shows the demand sites as Red dots with the name of the town and the number 1, 2 or 3<br />
depicting the kind or reservoir closed to that demand site. This also shows the names of the<br />
various towns in the UER.<br />
The average monthly evaporation for the small reservoirs was obtained from figure 3.4 which<br />
was adapted from Leibe (2002). The value obtained was 152.5mm/month and this value was used<br />
to represent all the reservoirs in the district.<br />
In all a total of 61 reservoirs were located on streams in the region. This value is far lower than<br />
186 million m 3 of the total storage capacity of reservoirs (Leibe et al 2002). The difference may<br />
be attributed to the fact that not all the reservoirs in the region were considered. Only the<br />
reservoirs on streams and rivers were considered.<br />
5.2.2 Assumptions Made<br />
In the modelling of the reservoirs in the study area, some assumptions were made regarding some<br />
of the input data. The runoff data obtained was only on some selected stations from various towns<br />
in the whole basin. For streams with no gauge stations their runoff data were deduced from the<br />
neighbouring stations. This was done by taking into consideration the catchement area of the<br />
stream. Concerning water use in the region, it was assumed that the water use for domestic<br />
purposes was negligible and that water in the region is basically for irrigation and livestock<br />
production.<br />
27
With regards to the areas of irrigated land in the various towns, it was assumed that the land sizes<br />
were the same as 9 ha for SR3 type and that for SR2 and SR1 type reservoirs was set to be 2.6 ha<br />
and 1.6 respectively. The rate of water use was also assumed to be the same as 22,133m 3 /ha for<br />
all the reservoirs.<br />
Figure 5.1 A detailed schematic view of the study area in the <strong>WEAP</strong> model<br />
28
Figure 5.2 An overview of the UER in the <strong>WEAP</strong> model<br />
5.3 Creation of Scenarios<br />
The following scenarios were created in order to ascertain the impact of these small reservoirs on<br />
the flow of the streams in the study area. In creating these scenarios the water year method was<br />
used to specify different climate conditions in the given period of the scenario analysis. This is<br />
shown in table 5.3 and was used to represent all the three scenarios created. The values were<br />
chosen based on an assumption. The model gives the values for the water year as Normal = 1,<br />
Wet =1.3, Very wet = 1.45, Dry =0.8, Very Dry = 0.7. This means that the discharge values are<br />
multiplied by these factors.<br />
29
Table 5.3 Water Year Method for various years under scenario<br />
Year<br />
Water Year Type<br />
2005 Normal<br />
2006 Normal<br />
2007 Wet<br />
2008 Wet<br />
2009 Dry<br />
2010 Very dry<br />
2011 Dry<br />
2012 Wet<br />
2013 Very wet<br />
2014 Dry<br />
2015 Normal<br />
5.3.1 Scenario 1; Increase in the Number of Small reservoirs<br />
The increase in the number of small reservoirs could be considered a business as usual scenario<br />
where there are more reservoirs constructed and more irrigated lands exploited. The impact on the<br />
runoff would be achieved by increasing the number of reservoirs in accordance with expected<br />
population growth over a period of time. A total of 8 reservoirs were assumed to be added to the<br />
existing number. These additional reservoirs were assumed to be of higher storage capacities than<br />
the SR3 type category with a storage capacity as defined in table 5.4 and were located on the<br />
main White Volta River.<br />
Table 5.4 New Reservoirs and their properties.<br />
Name of Reservoir Storage Capacity (Million m 3 ) Irrigated land(ha) Start up Year.<br />
Naga MR 1 45 2008<br />
Zarre MR 0.9 45 2008<br />
Pwalugu MR 0.9 45 2008<br />
Wiaga MR 0.9 45 2008<br />
Balungu MR 0.9 30 2008<br />
Kugli MR 0.9 30 2010<br />
MR3 0.9 30 2010<br />
Nangodi 0.9 43 2012<br />
30
5.3.2 Scenario 2; Increase in irrigated Land/Increase in Demand<br />
The effect of an increase in irrigated land and a corresponding increase in amount of water use<br />
would also be applied to find out how they impact on the runoff. According to the International<br />
Fund for Agricultural Development (IFAD) report, for there to be a significant growth in the<br />
Basic Need Income (BNI) smallholder irrigation, the existing areas of irrigated lands which are<br />
below 1.6 ha should be increased to 2.4 ha. (IFAD Report).<br />
In the creation of this scenario, the irrigated areas were increased from 9 ha for every SR3 type<br />
reservoir to 13 ha. For SR1 and SR2 type reservoirs the increase was from 1.6 ha to 2.4 ha and<br />
2.4 ha to 5 ha respectively.<br />
5.3.3 Scenario 3; Increase in Demand during the wet months<br />
This scenario looks at complimentary irrigation during the wet seasons of June, July and August.<br />
Under this scenario the demand rate for irrigation was increased during the specified months. It<br />
assumes that the reservoirs would be used for other irrigation purposes than the normal irrigation.<br />
The demand rate was increased from 22317 m 3 /ha to 32000m 3 /ha to access the possibility of<br />
using the reservoirs for more irrigation for better economic gains. This was achieved by using the<br />
monthly variation principle in the <strong>WEAP</strong> model. The months of June, July, and August were<br />
varied to allow for more irrigation by increasing the activity level.<br />
31
6 RESULTS AND DISCUSSION<br />
6.1 Introduction<br />
This chapter describes the results obtained from the model. This includes both the results<br />
obtained from the calibration of the model and also when scenarios were created. The results are<br />
represented in tables and charts.<br />
6.2 Calibration results<br />
Calibration of the model was done to adapt the model to the UER taking into consideration all the<br />
necessary indicators such as the water use and annual activity level of the irrigated areas. This<br />
also included the storage capacity of the reservoirs.<br />
6.2.1 Stream Flow<br />
The total flow from the WVR observed at the point where river leaves the UER was 10.7 billion<br />
m 3 for the calibration of the model which is year 2004. The measured flow for the same river<br />
according to the gauge station reading is 9.565 billion m 3 . This shows a difference of<br />
approximately 1 billion cubic meters. The difference between the two values may be due to the<br />
fact that the water uses for domestic purposes were not included in the study. Figure 6.1 shows<br />
the results obtained from the model for stream flow of the various rivers and streams. The White<br />
Volta River is shown as the thick blue line.<br />
32
Figure 6.1 The flow of water from the various streams in billion m 3 in the UER for the current<br />
account year 2004.<br />
The table in appendix 1 depicts the flow condition of the White Volta River and all its tributaries<br />
and shows the annual flow in billion cubic meters. The same result is represented in figure 6.2<br />
33
Million Cubic Meter<br />
10,500<br />
10,000<br />
9,500<br />
9,000<br />
8,500<br />
8,000<br />
7,500<br />
7,000<br />
6,500<br />
6,000<br />
5,500<br />
5,000<br />
4,500<br />
4,000<br />
3,500<br />
3,000<br />
2,500<br />
2,000<br />
1,500<br />
1,000<br />
500<br />
Streamflow (below node or reach listed)<br />
Scenario: Reference, All months, All Rivers<br />
0<br />
Div . 1 0. Headflow Riv er 13 14. Reach Riv er 23 22. Reach Riv er 29 4. Reach Riv er 36 0. Headflow Riv er 6 8. Reach White Volta 28. Reach<br />
2004<br />
Figure 6.2 Chart of stream flow for streams in the UER in million m 3<br />
6.2.3 Reservoir storage capacities<br />
The results for the various small reservoir storage volumes showed that some of the reservoirs are<br />
50 % full in the dry months of January, February, and March. During those months the demand<br />
for water is not totally reached. However, reservoirs with labels Kpasenkpe Sc, Naga Sc, Naga<br />
Sc3 showed 100% volume in all the months including the dry periods. The storages of the various<br />
reservoirs are presented in appendix 2. The demand priority given to all the reservoirs in the<br />
<strong>WEAP</strong> model was 1. In the wet seasons all the reservoirs were filled with water. Figure 6.3 shows<br />
the storages of reservoirs in the UER. This excludes all reservoirs with 100% storages throughout<br />
the year.<br />
34
Thousand Cubic Meter<br />
16,000<br />
15,000<br />
14,000<br />
13,000<br />
12,000<br />
11,000<br />
10,000<br />
9,000<br />
8,000<br />
7,000<br />
6,000<br />
Reservoir Storage Volume<br />
Scenario: Reference, All months<br />
gfedc<br />
gfedc<br />
gfedc<br />
gfedc<br />
gfedc<br />
gfedc<br />
gfedc<br />
gfedc<br />
gfedc<br />
gfedc<br />
gfedc<br />
gfedc<br />
gfedcb<br />
Kpasenkpe Sc<br />
Naga Sc.<br />
Naga Sc.3<br />
Nasia SR 3<br />
Ningo Sc<br />
SR 5<br />
Sandema SR3<br />
Sc.3<br />
Sokoti SR3<br />
Tula Sc 3<br />
Yinduri Sc<br />
Zarre Sc 3<br />
All Others<br />
5,000<br />
4,000<br />
3,000<br />
2,000<br />
1,000<br />
0<br />
January February March April May June July August September October Nov ember December<br />
Figure 6.3 Reservoirs storage volumes for various months in million m 3<br />
6.2.4 Demand site coverage<br />
Appendix 3 shows the percentage of the demand sites covered by the streams for the twelve<br />
months in the current account year of 2004. The percentages vary from 0 to 100. The demand<br />
sites with total coverage are denoted with 100% and vary with the various months. Some of the<br />
demand sites showed low coverage in the months of January, February, and March. However the<br />
sites were all covered in the wet season periods. Reservoirs located on the upstream of small<br />
streams that finally joins the main White Volta River showed low demand coverage during the<br />
mean months unlike the reservoirs located on the main White Volta River which showed all year<br />
round coverage. This could be attributed to the fact that since the small streams have small<br />
catchement area the flow generated is less and thus less water is stored in the reservoirs. But the<br />
reservoirs downstream were located at places where all the flows from the small streams meet<br />
thus having more water in the whole year.<br />
35
6.3 Simulation Results<br />
6.3.1 Scenario 2 Increase Demand<br />
This was the scenario in which the irrigated land sizes were increased as described in chapter 5.<br />
6.3.1.1 Stream Flow<br />
The results for the stream flow under this scenario showed very low reduction of runoff<br />
downstream of the White Volta River. However the reduction was slightly significant in the<br />
stream flow in the dry years which were 2009 and 2010.<br />
2,600<br />
2,400<br />
Streamflow (below node or reach listed)<br />
Scenario: increase in demand, All months, All Rivers<br />
gfedcb<br />
gfedcb<br />
gfedcb<br />
gfedcb<br />
gfedcb<br />
gfedcb<br />
gfedcb<br />
gfedcb<br />
gfedcb<br />
River 1 1. Tilli SR 3<br />
River 2 1. Zebila SR 3<br />
River 20 1. Binabi SR 3<br />
River 20 3. Kosanabi SR 3<br />
River 20 7. Boyaa SR 3<br />
River 25 1. Nakola Sc<br />
River 45 1. Yelwoko SR 3<br />
White Volta 29. Zongoyiri Sc<br />
White Volta 63. River 42 Inflow<br />
2,200<br />
2,000<br />
1,800<br />
Million Cubic Meter<br />
1,600<br />
1,400<br />
1,200<br />
1,000<br />
800<br />
600<br />
400<br />
200<br />
0<br />
Jan Aug<br />
2004 2004<br />
Apr Dec Aug<br />
2005 2005 2006<br />
Apr Dec Aug<br />
2007 2007 2008<br />
Apr Dec Aug<br />
2009 2009 2010<br />
Apr Dec Aug<br />
2011 2011 2012<br />
Apr Dec Aug<br />
2013 2013 2014<br />
Figure 6.4 Stream Flow for Increase in Demand scenario.<br />
Apr Dec<br />
2015 2015<br />
36
150<br />
Streamflow (below node or reach listed)<br />
White Volta Nodes and Reaches: Below White Volta Headflow , All months, River: White Volta<br />
gfedcb<br />
gfedcb<br />
Reference<br />
increase in demand<br />
140<br />
130<br />
120<br />
110<br />
100<br />
Million Cubic Meter<br />
90<br />
80<br />
70<br />
60<br />
50<br />
40<br />
30<br />
20<br />
10<br />
0<br />
Jan Jul Jan Jul Jan Jul Jan Jul Jan Jul Jan Jul Jan Jul Jan Jul Jan Jul Jan Jul Jan Jul Jan Jul<br />
2004 2004 2005 2005 2006 2006 2007 2007 2008 2008 2009 2009 2010 2010 2011 2011 2012 2012 2013 2013 2014 2014 2015 2015<br />
Figure 6.5 Stream flow for Increased Demand Scenario and the Reference Scenario<br />
6.3.1.2 Demand Coverage<br />
The analysis for three different years 2010, 2013 and 2015 was considered. The year 2010 was<br />
chosen to represent year with less rainfall as described in the table 5.3. The demand coverage for<br />
the months of January, February, March and April were extremely low. The percentage ranges<br />
between 69 % in Jan and 29% in April for reservoirs located on small streams (second order<br />
streams). The January coverage was higher although it is part of the dry months. This could be<br />
attributed to the fact that the reservoirs were able to store up some amount of water during the<br />
previous year’s wet season thus making some amount of water available in the dry season. The<br />
reservoirs located on the main White Volta River showed 100% coverage for all demand sites.<br />
Year 2010 is considered to be a very dry year according to table 5.3. The results showed less<br />
demand coverage in the dry months as shown in figure 6.6. This is because less water was stored<br />
during the previous year’s wet season but the end of the wet season and the dry months for the<br />
preceding year saw better demand coverage.<br />
37
Percent<br />
100<br />
95<br />
90<br />
85<br />
80<br />
75<br />
70<br />
65<br />
60<br />
55<br />
50<br />
45<br />
40<br />
35<br />
30<br />
25<br />
20<br />
15<br />
10<br />
5<br />
Demand Site Coverage (% of requirement met)<br />
Scenario: increase in demand, All months<br />
0<br />
January February March April May June July August September October Nov ember December<br />
gfedcb<br />
gfedcb<br />
gfedcb<br />
gfedcb<br />
Bui Sc 3<br />
Datoko Sc<br />
Nakola Sc<br />
Zoko Sc.<br />
Figure 6.6 Demand site coverage for year 2010 for some selected reservoirs in the very dry year.<br />
The year 2015 was chosen to be a normal year with normal runoff for the various streams in the<br />
Region .The results for unmet demand that is percentage of demand areas which are not met are<br />
also represented in figure 6.8. This shows an increase over the period of study in agreement with<br />
the demand increases. As the demand goes up the unmet demand also increases.<br />
38
100<br />
Demand Site Coverage (% of requirement met)<br />
Scenario: increase in demand, All months<br />
gfedcb<br />
gfedcb<br />
gfedcb<br />
gfedcb<br />
Bui Sc 3<br />
Datoko Sc<br />
Nakola Sc<br />
Zoko Sc.<br />
95<br />
90<br />
85<br />
80<br />
75<br />
70<br />
65<br />
60<br />
Percent<br />
55<br />
50<br />
45<br />
40<br />
35<br />
30<br />
25<br />
20<br />
15<br />
10<br />
5<br />
0<br />
Jan<br />
2013<br />
Feb<br />
2013<br />
Mar<br />
2013<br />
Apr<br />
2013<br />
May<br />
2013<br />
Jun<br />
2013<br />
Jul<br />
2013<br />
Aug<br />
2013<br />
Sep<br />
2013<br />
Oct<br />
2013<br />
Nov<br />
2013<br />
Dec<br />
2013<br />
Figure 6.7 Demand Coverage 2013 for some selected reservoirs.<br />
220<br />
200<br />
Unmet Demand<br />
Scenario: increase in demand, All months<br />
gfedcb<br />
gfedcb<br />
gfedcb<br />
gfedcb<br />
gfedcb<br />
gfedcb<br />
gfedcb<br />
gfedcb<br />
gfedcb<br />
gfedcb<br />
gfedcb<br />
gfedcb<br />
gfedcb<br />
Bugri 1<br />
Chiana Sc<br />
Dua 2<br />
Fumbisi 1<br />
Gbedema 1<br />
Kaadi 1<br />
Kpasen Sc.<br />
Pelungu 2<br />
Sugudi 1<br />
Tili 1<br />
Yorogo 2<br />
Zebila 1<br />
All Others<br />
180<br />
160<br />
Thousand Cubic Meter<br />
140<br />
120<br />
100<br />
80<br />
60<br />
40<br />
20<br />
0<br />
Jan Aug<br />
2004 2004<br />
Apr Dec Aug<br />
2005 2005 2006<br />
Figure 6.8 Unmet Demand<br />
Apr Dec Aug Apr Dec Aug Apr Dec Aug Apr Dec Aug<br />
2007 2007 2008 2009 2009 2010 2011 2011 2012 2013 2013 2014<br />
Apr Dec<br />
2015 2015<br />
39
6.3.1.3 Reservoir Storage volume<br />
The storages for the various reservoirs agree with the demand coverage of the same reservoirs.<br />
The dry months showed less storages and less demand coverage through out the years under<br />
study. This is represented in figure 6.9<br />
Thousand Cubic Meter<br />
16,000<br />
15,000<br />
14,000<br />
13,000<br />
12,000<br />
11,000<br />
10,000<br />
9,000<br />
8,000<br />
7,000<br />
6,000<br />
5,000<br />
4,000<br />
3,000<br />
2,000<br />
1,000<br />
0<br />
Jan Aug Apr Dec<br />
2004 2004 2005 2005<br />
Aug<br />
2006<br />
Reservoir Storage Volume<br />
Scenario: increase in demand, All months<br />
Apr Dec Aug Apr Dec Aug Apr Dec Aug<br />
2007 2007 2008 2009 2009 2010 2011 2011 2012<br />
Apr<br />
2013<br />
Dec Aug Apr Dec<br />
2013 2014 2015 2015<br />
gfedcb<br />
gfedcb<br />
gfedcb<br />
gfedcb<br />
gfedcb<br />
gfedcb<br />
gfedcb<br />
gfedcb<br />
gfedcb<br />
gfedcb<br />
gfedcb<br />
gfedcb<br />
gfedcb<br />
Kpasenkpe Sc<br />
Naga Sc.<br />
Naga Sc.3<br />
Nasia SR 3<br />
Ningo Sc<br />
SR 5<br />
Sandema SR3<br />
Sc.3<br />
Sokoti SR3<br />
Tula Sc 3<br />
Yinduri Sc<br />
Zarre Sc 3<br />
All Others<br />
Figure 6.9 Reservoir Storage Volume Mm 3 .<br />
6.3.2 Scenario 3; Increase in Demand during the Wet Season.<br />
This scenario as described in chapter 5 shows an increase in the demand during the wet seasons<br />
of June, July and August.<br />
6.3.2.1 Demand Coverage<br />
The results showed 100% coverage for the months of Jun, July and August though there were<br />
increases in demand. There was enough water to serve more irrigated lands during those months.<br />
The reservoirs that were located on the main river showed continuous coverage throughout the<br />
period. The unmet demand for these months was zero.<br />
40
6.3.2.1 Reservoir Storage volume<br />
The reservoirs were all full in wet months just like the demand coverage. However two reservoirs<br />
located at Yorogo SR1 and Dua SR1 showed zero volumes in the months of Feb, Mar, April.<br />
These reservoirs were however filled during the wet months. This is represented in appendix 5.<br />
6.3.3 Scenario 2; Increase in reservoirs<br />
This is described in chapter 5 and shows the case when the number of reservoirs are increased<br />
according to table 5.4<br />
6.3.3.1 Stream flow<br />
The results obtained for the stream flow showed a reduction in the main White Volta River in the<br />
monthly average values. The difference in the stream flow for the month of December between<br />
the current account year and the “more reservoirs added scenario was 0.5 Mm 3 while that of<br />
February was 1M m 3 . The highest difference was seen in the month of March which was 5 Mm 3 .<br />
6.3.3.2 Reservoir Storage Volume<br />
The additional reservoirs were filled through out the period in which they were in operation. They<br />
were filled to full capacity in all the months.<br />
The demands for the additional reservoirs were also met during the period.<br />
6.4 Evaluation<br />
The results obtained from the model showed that not all the demand sites were covered during the<br />
dry months of the year. Most of the demand sites on the second order streams are clear examples<br />
of sites which were not covered throughout the year. However the reservoirs located on the main<br />
White Volta River showed a constant supply of water in all the years under study and under all<br />
the scenarios created. Some of the reservoirs located on the small streams were able to store some<br />
amount of water during the wet season which is utilized during the dry months however not all<br />
the demand requirement is met in the dry months. The later part of the dry season received very<br />
little coverage.<br />
The volume of the reservoirs behaved in a similar manner as the demand coverage. The reservoirs<br />
were filled to higher volumes during the wet months however the dry months showed less<br />
volume. When the demand sites were increased in the wet months, the reservoirs were able to<br />
handle the increase. This indicates that the reservoirs, particularly those located on the main river,<br />
can support complimentary irrigation during the wet seasons.<br />
41
The increase in demand scenario showed an increase in the unmet demand in the dry months.<br />
This was increasing with the years under study according to figure 6.8 because the demand was<br />
increased in accordance with the years. Approximately 180,000 m 3 of water would be required to<br />
satisfy irrigation during the dry months.<br />
The total annual flow from the river was not affected in any significant way in all the three<br />
scenarios. However the flows from the second order streams showed a significant reduction<br />
during the dry months. Thus the flow in the main river showed a very small difference in the dry<br />
months when compared to the current account year.<br />
The third scenario which is the Increase in Number of Reservoirs Scenario showed a reduction in<br />
the flow values for the White Volta River. The reduction is in the range of 0.5 Mm 3 to 0.5 Mm 3<br />
depending on the month. Although this reduction is insignificant compared to the monthly flow,<br />
the value can increase and cause a major reduction in the flow downstream when more reservoirs<br />
and demand sites are created on the main rivers.<br />
6.5 Planning<br />
In the planning of these small reservoirs, their location is of much importance in order to ensure<br />
demand coverage. This is much hindered by proximity since all the farmers cannot be located on<br />
the reservoirs located on the main rivers. However various farming groups can be created near<br />
reservoirs with constant supply of water and the reservoirs in those areas can be expanded to store<br />
more water for irrigation in all the farming seasons.<br />
42
7 CONCLUSIONS<br />
Water is a priceless commodity in the arid and semi-arid regions of the world where irregular<br />
rainfall is predominant. Creation of reservoirs is however a tool for ensuring adequate supply of<br />
water throughout the year. In the UER of Ghana where there is a higher incidence of poverty as<br />
compared to the other regions, small reservoirs are a major component of the people’s farming<br />
activities. Development of small reservoirs is an efficient way of developing agriculture in the<br />
arid region of the world.<br />
The aim of this study was to determine the impact of the large number of these small reservoirs<br />
on the downstream flow condition. From the results obtained for all the scenarios created, small<br />
reservoirs in the UER have relatively low impact on the downstream flow of the White Volta<br />
River. However reduction of the flow can be significant in the advent of the creation of larger<br />
reservoirs and more demand sites which may be located on the WVR as presented in the creation<br />
of more reservoirs with higher storage capacities and bigger demand sites scenario.<br />
The reservoirs can also be used for other purposes such as more irrigated lands and more<br />
livestock production in the months of June, July, and August. More flow is realised in the streams<br />
during those months and so there is a possibility of making use of more water for other purposes.<br />
The <strong>WEAP</strong> Model was a very good tool for this thesis. It is easy to use and offers a wide range of<br />
possibilities to be analysed under the scenario creation.<br />
43
8 REFERENCES<br />
Asenso-Okyere, W.K., Twum-Baah, K.A., Kasanga A., Anum, J. and Portner C., 2000.<br />
Ghana Living Standards Survey. Report of the Fourth Round (GLSS 4),<br />
Ghana Statistical Service, Accra.<br />
A. B. Avakyan and S. A. Podol’skii, 2001 Impact of Reservoirs on the Fauna<br />
Swedish Research Council for Environment, Agricultural Science and Spatial Planning,<br />
2006 Dams under Debate<br />
Ghana Statistical Service, 2000. Poverty trends in Ghana in the 1990s.<br />
Ghana Statistical Service, Accra.<br />
Global Water Partnership, 2006 Integrated Water Resources Management<br />
[Online]<br />
[Available on www.gwp.org]<br />
[Cited on December 2006]<br />
IGBP/IHDP (1993) Relating Land Use and Global Land Cover Change. IHDP.<br />
IFAD, 2006, Upper East Region Land Conservation and Smallholder Rehabilitation<br />
Project(LACOSREP) [Online ] Report. No 5<br />
[Available on http://www.ifad.org/governance/index.htm]<br />
[Cited November 2006]<br />
J. Liebe N. van de Giesen M. Andreini, 2005 Estimation of small reservoir storage capacities<br />
in a semi-arid environment A case study in the Upper East Region of Ghana.[Online]<br />
Available from www.smallreservoirs.org<br />
[Cited November 2006]<br />
Jack Sieber, Chris Swartz, Annette Huber-Lee, 2005 <strong>WEAP</strong> User guide Stockholm<br />
Environmental Institute<br />
44
Kwabena Wiafe, 1997 Irrigation, Volta Basin Starter Kit July, 2006 Compiled by P.Drechsel,B<br />
Barry, A Bahri and W.Andah<br />
P. Raskin, E. Hansen, and Z. Zhu, M. IWRA, D. Stavisky, Simulation of Water Supply and<br />
Demand in the Aral Sea Region [Online] pp 55-67<br />
[Available on http://www.weap21.org/downloads/aralsea.pdf]<br />
[Cited December 2006]<br />
P. Gyau-Boakye ,2000 Environmental impacts of the Akosombo dam and<br />
Effects of climate change on the lake level.<br />
Environment, Development and Sustainability 3: 17–29, Kluwer Academic Publishers.<br />
Printed in the Netherlands.<br />
Shiklomanov, I.A. 1999. World Water Resources: A New Appraisal and<br />
Assessment for the 21st Century.<br />
Rapport du Programme Hydrologique International (PHI), Paris. UNESCO<br />
.<br />
Winston E.I. Andah Francis Gichuki, Volta River Basin: Enhancing Agricultural Water<br />
Productivity through Strategic Research, Report No 8<br />
Winston E.I. Andah, Nick van de Giesen, Charles A. Biney, 2005 Water, Climate, Food, and<br />
Environment in the Volta Basin Contribution to the project ADAPT Adaptation strategies to<br />
changing environments<br />
[Online][Available on http://www.weap21.org/index.aspdoc=05]<br />
[Cited on December 2006]<br />
World Metrological Organization, 1986. Manual for Estimation of Probable Maximum<br />
Precipitation, 269 pp. WMO No. 332 (1986) [Online]<br />
[Available on http://www.wmo.ch/pages/prog/hwrp/homs/Components/English/k15201.htm]<br />
[Cited on December 2006]<br />
UN World Water Development 2006, Water a Shared Responsibility,<br />
Report No. 2<br />
45
UNESCO and Berghahn Books.<br />
UNESCO Water Portal [Online]<br />
[Available on http://assistive.usablenet.com/tt/www.unesco.org/water/]<br />
[Cited on December 2006]<br />
Volta Basin Starter Kit July, 2006 Compiled by P.Drechsel,B Barry, A Bahri and W.Andah<br />
Volta River Authority [Online]<br />
[Available on www.vra.com]<br />
[Cited on December, 2006]<br />
Internet Sources<br />
FAO Coporate document Respository [Online]<br />
[Available on www.fao.org]<br />
[Cited in December 2006]<br />
Small Reservoir Project. [Online]<br />
[Available on http://www.smallreservoirs.org/]<br />
[Cited on December 2006]<br />
46
8 APPENDIX<br />
Appendix 1 Results of Stream flow for the current account year.<br />
Million Cubic Meter<br />
3,200<br />
3,000<br />
2,800<br />
2,600<br />
2,400<br />
2,200<br />
2,000<br />
1,800<br />
1,600<br />
1,400<br />
1,200<br />
1,000<br />
800<br />
600<br />
400<br />
200<br />
0<br />
Streamflow (below node or reach listed)<br />
Scenario: Reference, All months, River: White Volta<br />
January February March April May June July August September Nov ember<br />
gfedcb<br />
gfedcb<br />
gfedcb<br />
gfedcb<br />
gfedcb<br />
gfedcb<br />
gfedcb<br />
gfedcb<br />
gfedcb<br />
gfedcb<br />
gfedcb<br />
gfedcb<br />
gfedcb<br />
gfedcb<br />
gfedcb<br />
gfedcb<br />
gfedcb<br />
gfedcb<br />
gfedcb<br />
gfedcb<br />
gfedcb<br />
gfedcb<br />
gfedcb<br />
gfedcb<br />
gfedcb<br />
gfedcb<br />
gfedcb<br />
gfedcb<br />
gfedcb<br />
0. Headflow<br />
1. River 4 Inflow<br />
2. Reach<br />
3. Yarugu SR 3<br />
4. Reach<br />
5. Withdrawal Node 2<br />
6. Reach<br />
7. Bazua SR 3<br />
8. Reach<br />
9. Withdrawal Node 3<br />
10. Reach<br />
11. Timonde SR 3<br />
12. Reach<br />
13. Withdrawal Node 5<br />
14. Reach<br />
15. River 3 Inflow<br />
16. Reach<br />
17. Atoba SR 3<br />
18. Reach<br />
19. Withdrawal Node 4<br />
20. Reach<br />
21. River 2 Inflow<br />
22. Reach<br />
23. River 1 Inflow<br />
24. Reach<br />
25. River 20 Inflow<br />
26. Reach<br />
27. River 6 Inflow<br />
28. Reach<br />
47
Appendix 2 Results for Reservoirs storage volumes for the current account year in Mm 3<br />
Jan-04 Feb-<br />
04<br />
Mar-<br />
04<br />
Apr-<br />
04<br />
May-<br />
04<br />
Jun-04 Jul-04 Aug-<br />
04<br />
Sep-<br />
04<br />
Oct-04 Nov-<br />
04<br />
Dec-<br />
04<br />
Kpasenkpe Sc 500 500 500 500 500 500 500 500 500 500 500 500<br />
Naga Sc. 380 380 380 380 380 380 380 380 380 380 380 380<br />
Naga Sc.3 380 380 380 380 380 380 380 380 380 380 380 380<br />
Nasia SR 3 380 380 380 380 380 380 380 380 380 380 380 380<br />
Ningo Sc 380 380 380 380 380 380 380 380 380 380 380 380<br />
SR 5 1000 1000 1000 1000 1000 1000 1000 1000 1000 1000 1000 1000<br />
Sandema SR3 380 380 380 380 380 380 380 380 380 380 380 380<br />
Sc.3 380 380 380 380 380 380 380 380 380 380 380 380<br />
Sokoti SR3 380 380 380 380 380 380 380 380 380 380 380 380<br />
Tula Sc 3 380 380 380 380 380 380 380 380 380 380 380 380<br />
Yinduri Sc 380 380 380 380 380 380 380 380 380 380 380 380<br />
Zarre Sc 3 380 380 380 380 380 380 380 380 380 380 380 380<br />
All Others 8512 7904 6992 7376 16370 16370 16370 16370 16370 16267 14815 13297<br />
Sum 13812 13204 12292 12676 21670 21670 21670 21670 21670 21567 20115 18597<br />
48
Appendix 3 Results of demand site coverage in percentage for the current account year<br />
Jan Feb Mar April May June July Aug Sept Oct Nov Dec<br />
Agric3 100 100 100 100 100 100 100 100 100 100 100 100<br />
Asungi 1 100 100 100 100 100 100 100 100 100 100 100 100<br />
Atoba 1 100 100 100 100 100 100 100 100 100 100 100 100<br />
Bansi Sc 59.6 50.3 43.2 36.3 100 100 100 100 100 100 86.2 72.9<br />
Bazua 1 100 100 100 100 100 100 100 100 100 100 100 100<br />
Binaba 1 98.9 95.0 93.5 56.7 100 100 100 100 100 100 100 100<br />
Bisigu Sc 100 100 100 100 100 100 100 100 100 100 100 100<br />
Bolga 1 100 100 100 100 100 100 100 100 100 100 100 100<br />
Boyaa 1 98.9 98.1 96.4 86.3 100 100 100 100 100 100 100 100<br />
Bugri 1 63.6 53.4 45.4 38.2 100 100 100 100 100 100 88.0 76.4<br />
Bui Sc 3 100 100 100 100 100 100 100 100 100 100 100 100<br />
Chiana Sc 0 0 0 0 0 0 0 0 0 0 0 0<br />
Corner 1 66.0 56.5 48.2 40.9 100 100 100 100 100 100 89.0 78.2<br />
Datoko Sc 68.7 60.2 51.9 100.0 100 100 100 100 100 100 89.9 80.2<br />
Dua 2 34.5 20.0 7.8 0.0 100 100 100 100 100 100 71.4 53.0<br />
Fumbisi 1 60.0 51.9 44.4 37.3 100 100 100 100 100 89.7 79.9 70.4<br />
Gbedema 1 60.0 51.9 44.4 37.3 100 100 100 100 100 89.7 79.9 70.4<br />
Kaadi 1 58.8 48.5 41.7 35.3 100 100 100 100 100 100 86.0 72.5<br />
Kaadi Sc 66.1 56.6 48.3 41.8 100 100 100 100 100 100 89.0 78.2<br />
Kadema 1 68.3 59.6 51.3 43.9 100 100 100 100 100 100 89.8 79.9<br />
Kadema 100.0 100.0 100.0 100.0 100 100 100 100 100 100 100.0 100.0<br />
Sc.3<br />
Kagbiri Sc 63.6 53.5 45.6 39.2 100 100 100 100 100 100 88.0 76.4<br />
Kalbeo 2 100.0 100.0 100.0 100.0 100 100 100 100 100 100 100 100<br />
Katigri 100.0 98.8 97.0 96.1 100 100 100 100 100 100 100 100<br />
Kayile 1 100.0 100.0 100.0 100.0 100 100 100 100 100 100 100 100<br />
Kayoro 1 76.9 67.9 58.9 100.0 100 100 100 100 100 100 100 89.651<br />
Kpasen Sc. 0 0 0 0 0 0 0 0 0 0 0 0<br />
Kugurago 1 66.0 56.5 48.2 41.4 100.0 100.0 100.0 100.0 100.0 100.0 89.0 78.2<br />
Naga Sc 100.0 100.0 100.0 100.0 100.0 100.0 100.0 100.0 100.0 100.0 100.0 100.0<br />
Naga Sc. 100.0 100.0 100.0 100.0 100.0 100.0 100.0 100.0 100.0 100.0 100.0 100.0<br />
49
Nakola Sc 68.6 60.0 51.8 44.4 100.0 100.0 100.0 100.0 100.0 100.0 89.9 80.1<br />
Nakong 1 68.3 59.6 51.3 100.0 100.0 100.0 100.0 100.0 100.0 100.0 89.8 79.9<br />
Nasia 1 100.0 100.0 100.0 100.0 100.0 100.0 100.0 100.0 100.0 100.0 100.0 100.0<br />
Navrongo 1 68.6 60.0 51.8 44.4 100.0 100.0 100.0 100.0 100.0 100.0 89.9 80.1<br />
Ningo Sc 100.0 100.0 100.0 100.0 100.0 100.0 100.0 100.0 100.0 100.0 100.0 100.0<br />
Pelungu 2 12.8 0.0 0.0 100.0 100.0 100.0 100.0 100.0 100.0 100.0 63.9 34.8<br />
Sambolgu2 100.0 100.0 100.0 100.0 100.0 100.0 100.0 100.0 100.0 100.0 100.0 100.0<br />
Sandema 1 100.0 100.0 100.0 100.0 100.0 100.0 100.0 100.0 100.0 100.0 100.0 100.0<br />
Sc 3 100.0 100.0 100.0 100.0 100.0 100.0 100.0 100.0 100.0 100.0 100.0 100.0<br />
Sekoti 1 100.0 100.0 100.0 100.0 100.0 100.0 100.0 100.0 100.0 100.0 100.0 100.0<br />
Seshi1 100.0 100.0 100.0 100.0 100.0 100.0 100.0 100.0 100.0 100.0 100.0 100.0<br />
Sherigu 1 100.0 100.0 100.0 100.0 100.0 100.0 100.0 100.0 100.0 100.0 100.0 100.0<br />
Sikiri Sc 58.8 47.3 40.9 34.9 100.0 100.0 100.0 100.0 100.0 100.0 86.2 72.8<br />
Sinensi Sc 69.0 60.4 52.2 100.0 100.0 100.0 100.0 100.0 100.0 100.0 90.0 80.4<br />
Sugudi 1 58.9 48.7 41.8 35.2 100.0 100.0 100.0 100.0 100.0 100.0 86.0 72.5<br />
Tili 1 58.2 47.8 41.1 34.9 100.0 100.0 100.0 100.0 100.0 100.0 86.0 72.5<br />
Timonde 1 100.0 100.0 100.0 100.0 100.0 100.0 100.0 100.0 100.0 100.0 100.0 100.0<br />
Tula sc 100.0 100.0 100.0 100.0 100.0 100.0 100.0 100.0 100.0 100.0 100.0 100.0<br />
Uwasi 1 100.0 98.8 91.7 91.7 100.0 100.0 100.0 100.0 100.0 100.0 100.0 100.0<br />
Wrinyanga1 68.3 59.6 51.3 43.9 100.0 100.0 100.0 100.0 100.0 100.0 89.8 79.9<br />
Yarugu 2 100.0 100.0 100.0 100.0 100.0 100.0 100.0 100.0 100.0 100.0 100.0 100.0<br />
Yelwoko 1 68.2 59.5 51.2 43.7 100.0 100.0 100.0 100.0 100.0 100.0 89.7 79.8<br />
Yinduri Sc 100.0 100.0 100.0 100.0 100.0 100.0 100.0 100.0 100.0 100.0 100.0 100.0<br />
Yorogo 2 92.2 20.0 7.8 0.0 100.0 100.0 100.0 100.0 100.0 100.0 100.0 100.0<br />
Zarre Sc 100.0 100.0 100.0 100.0 100.0 100.0 100.0 100.0 100.0 100.0 100.0 100.0<br />
Zebila 1 58.7 47.9 41.2 34.9 100.0 100.0 100.0 100.0 100.0 100.0 86.0 72.5<br />
Zoko Sc. 67.1 58.1 49.0 40.3 100.0 100.0 100.0 100.0 100.0 100.0 89.3 79.0<br />
Zongoyiri<br />
Sc<br />
100.0 100.0 100.0 100.0 100.0 100.0 100.0 100.0 100.0 100.0 100.0 100.0<br />
50
Appendix 4 Results of the demand site coverage in percentage for the year 2010<br />
Jan-<br />
10<br />
Feb-<br />
10<br />
Mar-<br />
10<br />
Apr-<br />
10<br />
May-<br />
10<br />
Jun-<br />
10<br />
Jul-<br />
10<br />
Aug-<br />
10<br />
Sep-<br />
10<br />
Oct-<br />
10<br />
Nov-<br />
10<br />
Dec-<br />
10<br />
Agric3 100 100 100 100 100 100 100 100 100 100 100 100<br />
Asungi 1 100 100 100 100 100 100 100 100 100 100 100 100<br />
Atoba 1 100 100 100 100 100 100 100 100 100 100 100 100<br />
Bansi Sc 61 51 44 37 100 100 100 100 100 100 86 73<br />
Bazua 1 100 100 100 100 100 100 100 100 100 100 100 100<br />
Binaba 1 100 100 91 59 100 100 100 100 100 100 100 100<br />
Bisigu Sc 100 100 100 100 100 100 100 100 100 100 100 100<br />
Bolga 1 100 100 100 100 100 100 100 100 100 100 100 100<br />
Boyaa 1 100 100 91 80 100 100 100 100 100 100 100 100<br />
Bugri 1 64 54 46 38 100 100 100 100 100 100 88 76<br />
Bui Sc 3 100 100 100 100 100 100 100 100 100 100 100 100<br />
Chiana Sc 0 0 0 0 0 0 0 0 0 0 0 0<br />
Corner 1 66 55 47 39 100 100 100 100 100 100 88 76<br />
Datoko Sc 71 62 53 100 100 100 100 100 100 100 90 80<br />
Dua 2 33 16 4 0 100 100 100 100 100 100 69 49<br />
Fumbisi 1 59 51 43 35 100 100 100 100 100 89 78 68<br />
Gbedema 1 59 51 43 36 100 100 100 100 100 89 78 68<br />
Kaadi 1 59 48 41 34 100 100 100 100 100 100 85 71<br />
Kaadi Sc 66 55 47 40 100 100 100 100 100 100 88 76<br />
Kadema 1 68 59 51 43 100 100 100 100 100 100 89 78<br />
Kadema 100 100 100 100 100 100 100 100 100 100 100 100<br />
Sc.3<br />
Kagbiri Sc 64 54 46 39 100 100 100 100 100 100 88 76<br />
Kalbeo 2 100 100 100 100 100 100 100 100 100 100 100 100<br />
Katigri 100 100 100 100 100 100 100 100 100 100 100 100<br />
Kayile 1 100 100 100 100 100 100 100 100 100 100 100 100<br />
Kayoro 1 78 69 59 100 100 100 100 100 100 100 100 89<br />
Kpasen Sc. 0 0 0 0 0 0 0 0 0 0 0 0<br />
Kugurago 1 66 55 47 39 100 100 100 100 100 100 88 76<br />
Naga Sc 100 100 100 100 100 100 100 100 100 100 100 100<br />
51
Naga Sc. 100 100 100 100 100 100 100 100 100 100 100 100<br />
Nakola Sc 70 61 52 45 100 100 100 100 100 100 89 79<br />
Nakong 1 68 59 51 100 100 100 100 100 100 100 89 78<br />
Nasia 1 100 100 100 100 100 100 100 100 100 100 100 100<br />
Navrongo 1 70 61 52 45 100 100 100 100 100 100 89 79<br />
Ningo Sc 100 100 100 100 100 100 100 100 100 100 100 100<br />
Pelungu 2 9 0 0 100 100 100 100 100 100 100 61 30<br />
Sambolgu2 100 100 100 100 100 100 100 100 100 100 100 100<br />
Sandema 1 100 100 100 100 100 100 100 100 100 100 100 100<br />
Sc 3 100 100 100 100 100 100 100 100 100 100 100 100<br />
Sekoti 1 100 100 100 100 100 100 100 100 100 100 100 100<br />
Seshi1 100 100 100 100 100 100 100 100 100 100 100 100<br />
Sherigu 1 100 100 100 100 100 100 100 100 100 100 100 100<br />
Sikiri Sc 60 48 41 35 100 100 100 100 100 100 86 73<br />
Sinensi Sc 71 62 54 100 100 100 100 100 100 100 90 80<br />
Sugudi 1 59 48 41 34 100 100 100 100 100 100 85 71<br />
Tili 1 57 47 40 34 100 100 100 100 100 100 85 71<br />
Timonde 1 100 100 100 100 100 100 100 100 100 100 100 100<br />
Tula sc 100 100 100 100 100 100 100 100 100 100 100 100<br />
Uwasi 1 100 100 100 100 100 100 100 100 100 100 100 100<br />
Wrinyanga1 68 59 51 43 100 100 100 100 100 100 89 78<br />
Yarugu 2 100 100 100 100 100 100 100 100 100 100 100 100<br />
Yelwoko 1 68 59 50 43 100 100 100 100 100 100 89 78<br />
Yinduri Sc 100 100 100 100 100 100 100 100 100 100 100 100<br />
Yorogo 2 94 16 4 0 100 100 100 100 100 100 100 100<br />
Zarre Sc 100 100 100 100 100 100 100 100 100 100 100 100<br />
Zebila 1 58 48 41 34 100 100 100 100 100 100 85 71<br />
Zoko Sc. 69 60 51 43 100 100 100 100 100 100 89 79<br />
ZongoyiriSc 100 100 100 100 100 100 100 100 100 100 100 100<br />
52
Appendix 5 Results of the storage volume of reservoirs for scenario 3; Increase in demand<br />
during the wet months.<br />
Thousand Cubic Meter<br />
16,000<br />
15,000<br />
14,000<br />
13,000<br />
12,000<br />
11,000<br />
10,000<br />
9,000<br />
8,000<br />
7,000<br />
6,000<br />
5,000<br />
4,000<br />
3,000<br />
2,000<br />
1,000<br />
0<br />
Jan Aug Apr Dec<br />
2004 2004 2005 2005<br />
Aug<br />
2006<br />
Reservoir Storage Volume<br />
Scenario: increase in demand, All months<br />
Apr Dec Aug Apr Dec Aug Apr Dec Aug<br />
2007 2007 2008 2009 2009 2010 2011 2011 2012<br />
Apr<br />
2013<br />
Dec Aug Apr Dec<br />
2013 2014 2015 2015<br />
gfedcb<br />
gfedcb<br />
gfedcb<br />
gfedcb<br />
gfedcb<br />
gfedcb<br />
gfedcb<br />
gfedcb<br />
gfedcb<br />
gfedcb<br />
gfedcb<br />
gfedcb<br />
gfedcb<br />
Kpasenkpe Sc<br />
Naga Sc.<br />
Naga Sc.3<br />
Nasia SR 3<br />
Ningo Sc<br />
SR 5<br />
Sandema SR3<br />
Sc.3<br />
Sokoti SR3<br />
Tula Sc 3<br />
Yinduri Sc<br />
Zarre Sc 3<br />
All Others<br />
53
Appendix 6 Results of the demand in percentage of the additional reservoirs as described in<br />
scenario 2<br />
Demand coverage of new reservoirs.<br />
100<br />
95<br />
90<br />
85<br />
80<br />
75<br />
70<br />
Demand Site Coverage (% of requirement met)<br />
Scenario: more reservoirs, All months<br />
gfedcb<br />
gfedcb<br />
gfedcb<br />
gfedcb<br />
gfedcb<br />
gfedcb<br />
gfedcb<br />
gfedcb<br />
Balungu MR<br />
Kugli MR<br />
MR 3<br />
Naga MR<br />
Nangodi MR<br />
Pwalugu<br />
Wiaga MR<br />
Zarre MR<br />
65<br />
60<br />
55<br />
Percent<br />
50<br />
45<br />
40<br />
35<br />
30<br />
25<br />
20<br />
15<br />
10<br />
5<br />
0<br />
Jan Jun<br />
2004 2004<br />
Dec<br />
2004<br />
Jun<br />
2005<br />
Dec<br />
2005<br />
Jun<br />
2006<br />
Dec<br />
2006<br />
Jun<br />
2007<br />
Dec<br />
2007<br />
Jun<br />
2008<br />
Dec<br />
2008<br />
Jun<br />
2009<br />
Dec<br />
2009<br />
Jun<br />
2010<br />
Dec<br />
2010<br />
Jun<br />
2011<br />
Dec<br />
2011<br />
Jun<br />
2012<br />
Dec<br />
2012<br />
Jun<br />
2013<br />
Dec<br />
2013<br />
Jun<br />
2014<br />
Dec<br />
2014<br />
Jun<br />
2015<br />
Dec<br />
2015<br />
54
Appendix 7 Discharge values for some selected gauge stations.<br />
White Volta Yakala<br />
headflow<br />
Month Flow Month Flow m 3 /s<br />
m 3 /s<br />
Jan 0 Jan 0<br />
Feb 0 Feb 0<br />
March 0 March 0<br />
April 0 April 0<br />
May 6.8 May 14.76<br />
June 40.2 June 22.81<br />
July 37.9 July 12.85<br />
August 27.5 August 47.266<br />
Sept 34 Sept 3.5<br />
Oct 3.64 Oct 0<br />
Nov 0 Nov 0<br />
Dec. 0 Dec 0<br />
River 47 Gagaba<br />
Gaba<br />
Month Flow m 3 /s Month m 3 /s<br />
Jan 0 Jan 20.84<br />
Feb 0 Feb 1.68<br />
March 0 March 1.15<br />
April 0 April 1.27<br />
May 0.67 May 2.47<br />
June 5.57 June 10.75<br />
July 12.6 July 48.42<br />
August 102.57 August 137.19<br />
Sept 87.485 Sept 75.87<br />
Oct 5.445 Oct 10.68<br />
Nov 0 Nov 3.5<br />
Dec. 0 Dec. 14.35<br />
55
White Volta below River 21 Pwalugu<br />
Month Flow m 3 /s Month Flow m 3 /s<br />
Jan 18.25 Jan 0<br />
Feb 32.86 Feb 0<br />
March 39.03 March 0<br />
April 53.27 April 0<br />
May 66.55 May 0.85<br />
June 87.06 June 1.89<br />
July 168.05 July 0.579<br />
August 271.17 August 3.5<br />
Sept 241.49 Sept 4.97<br />
Oct 53.56 Oct 0.51<br />
Nov 28.95 Nov 0<br />
Dec 23.67 Dec 0<br />
56