EDITORIALS Rapeseed/Mustard seeds fundamentals - World ... - MCX
EDITORIALS Rapeseed/Mustard seeds fundamentals - World ... - MCX
EDITORIALS Rapeseed/Mustard seeds fundamentals - World ... - MCX

Create successful ePaper yourself
Turn your PDF publications into a flip-book with our unique Google optimized e-Paper software.
DATABANK - NON-AGRI COMMODITIES<br />
DATABANK - AGRI COMMODITIES<br />
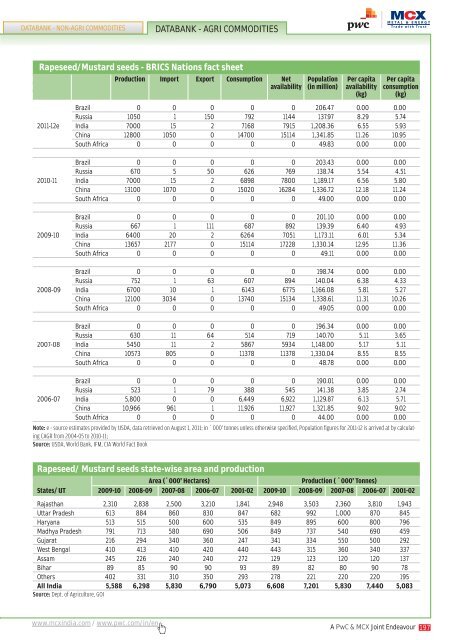
<strong>Rapeseed</strong>/<strong>Mustard</strong> <strong>seeds</strong> - BRICS Nations fact sheet<br />
Production Import Export Consumption Net Population Per capita Per capita<br />
availability (in million) availability consumption<br />
(kg)<br />
(kg)<br />
Brazil 0 0 0 0 0 206.47 0.00 0.00<br />
Russia 1050 1 150 792 1144 137.97 8.29 5.74<br />
2011-12e India 7000 15 2 7168 7915 1,208.36 6.55 5.93<br />
China 12800 1050 0 14700 15114 1,341.85 11.26 10.95<br />
South Africa 0 0 0 0 0 49.83 0.00 0.00<br />
Brazil 0 0 0 0 0 203.43 0.00 0.00<br />
Russia 670 5 50 626 769 138.74 5.54 4.51<br />
2010-11 India 7000 15 2 6898 7800 1,189.17 6.56 5.80<br />
China 13100 1070 0 15020 16284 1,336.72 12.18 11.24<br />
South Africa 0 0 0 0 0 49.00 0.00 0.00<br />
Brazil 0 0 0 0 0 201.10 0.00 0.00<br />
Russia 667 1 111 687 892 139.39 6.40 4.93<br />
2009-10 India 6400 20 2 6264 7051 1,173.11 6.01 5.34<br />
China 13657 2177 0 15114 17228 1,330.14 12.95 11.36<br />
South Africa 0 0 0 0 0 49.11 0.00 0.00<br />
Brazil 0 0 0 0 0 198.74 0.00 0.00<br />
Russia 752 1 63 607 894 140.04 6.38 4.33<br />
2008-09 India 6700 10 1 6143 6775 1,166.08 5.81 5.27<br />
China 12100 3034 0 13740 15134 1,338.61 11.31 10.26<br />
South Africa 0 0 0 0 0 49.05 0.00 0.00<br />
Brazil 0 0 0 0 0 196.34 0.00 0.00<br />
Russia 630 11 64 514 719 140.70 5.11 3.65<br />
2007-08 India 5450 11 2 5867 5934 1,148.00 5.17 5.11<br />
China 10573 805 0 11378 11378 1,330.04 8.55 8.55<br />
South Africa 0 0 0 0 0 48.78 0.00 0.00<br />
Brazil 0 0 0 0 0 190.01 0.00 0.00<br />
Russia 523 1 79 388 545 141.38 3.85 2.74<br />
2006-07 India 5,800 0 0 6,449 6,922 1,129.87 6.13 5.71<br />
China 10,966 961 1 11,926 11,927 1,321.85 9.02 9.02<br />
South Africa 0 0 0 0 0 44.00 0.00 0.00<br />
Note: e - source estimates provided by USDA, data retrieved on August 1, 2011; in `000' tonnes unless otherwise specified, Population figures for 2011-12 is arrived at by calculating<br />
CAGR from 2004-05 to 2010-11;<br />
Source: USDA, <strong>World</strong> Bank, IFM, CIA <strong>World</strong> Fact Book<br />
<strong>Rapeseed</strong>/ <strong>Mustard</strong> <strong>seeds</strong> state-wise area and production<br />
Area (`000' Hectares)<br />
Production ( `000' Tonnes)<br />
States/ UT 2009-10 2008-09 2007-08 2006-07 2001-02 2009-10 2008-09 2007-08 2006-07 2001-02<br />
Rajasthan 2,310 2,838 2,500 3,210 1,841 2,948 3,503 2,360 3,810 1,943<br />
Uttar Pradesh 613 884 860 830 847 682 992 1,000 870 845<br />
Haryana 513 515 500 600 535 849 895 600 800 796<br />
Madhya Pradesh 791 713 580 690 506 849 737 540 690 459<br />
Gujarat 216 294 340 360 247 341 334 550 500 292<br />
West Bengal 410 413 410 420 440 443 315 360 340 337<br />
Assam 245 226 240 240 272 129 123 120 120 137<br />
Bihar 89 85 90 90 93 89 82 80 90 78<br />
Others 402 331 310 350 293 278 221 220 220 195<br />
All India 5,588 6,298 5,830 6,790 5,073 6,608 7,201 5,830 7,440 5,083<br />
Source: Dept. of Agriculture, GOI<br />
www.mcxindia.com / www.pwc.com/in/en<br />
A PwC & <strong>MCX</strong> Joint Endeavour 197