Trust Recovery Growth Vitalization - Marubeni
Trust Recovery Growth Vitalization - Marubeni
Trust Recovery Growth Vitalization - Marubeni

Create successful ePaper yourself
Turn your PDF publications into a flip-book with our unique Google optimized e-Paper software.
<strong>Trust</strong><br />
<strong>Recovery</strong><br />
<strong>Growth</strong><br />
<strong>Vitalization</strong><br />
<strong>Marubeni</strong> Corporation 2005 2 / 3<br />
Annual Report 2005<br />
For the fiscal year ended March 31, 2005<br />
✔<br />
✔<br />
✔<br />
✔
Financial Highlights<br />
<strong>Marubeni</strong> Corporation<br />
Years ended March 31<br />
Thousands of<br />
U.S. Dollars<br />
Millions of Yen (Note 1)<br />
2005 2004 2003 2005<br />
For the year:<br />
Total volume of trading transactions ¥7,939,437 ¥7,905,640 ¥8,793,303 $74,200,346<br />
Gross trading profit 436,055 409,461 424,643 4,075,280<br />
Net income 41,247 34,565 30,312 385,486<br />
At year-end:<br />
Total assets 4,208,037 4,254,194 4,321,482 39,327,449<br />
Net interest-bearing debt 1,823,909 1,969,323 2,264,117 17,045,879<br />
Total shareholders’ equity 443,152 392,982 260,051 4,141,607<br />
Amounts per 100 shares (¥/US$):<br />
Basic earnings 2,661 2,285 2,030 24.87<br />
Diluted earnings 2,231 2,016 1,896 20.85<br />
Cash dividends 400 300 300 3.74<br />
Ratios:<br />
Return on assets (%) 1.0 0.8 0.7<br />
Return on equity (%) 9.9 10.6 11.6<br />
Net D/E ratio (times) 4.1 5.0 8.7<br />
Notes: 1. U.S. dollar amounts above and elsewhere in this report are converted from yen, for convenience only, at the prevailing rate of ¥107 to US$1 as of March 31, 2005.<br />
2. The total volume of trading transactions is calculated according to generally accepted accounting principles in Japan. This figure includes the total amount of<br />
transactions in which <strong>Marubeni</strong> and its consolidated subsidiaries acted in the capacity of selling contractor or agent.<br />
Contents<br />
1 Strength in Accomplishment<br />
2 Fundamental “V” PLAN Policies and Progress<br />
4 To Our Stakeholders<br />
6 Interview with the President and CEO<br />
14 Corporate Social Responsibility<br />
14 Guided by the Spirit of<br />
“Fairness, Innovation, Harmony”<br />
16 Corporate Governance<br />
18 Risk Management<br />
19 Compliance<br />
20 Our Commitment to Sustainable <strong>Growth</strong><br />
21 Corporate Citizenship<br />
22 At a Glance<br />
26 Strategy by Business Segment<br />
26 Agri-Marine Products<br />
28 Textile<br />
30 Forest Products & General Merchandise<br />
32 Chemicals<br />
34 Energy<br />
36 Metals & Mineral Resources<br />
38 Transportation Machinery<br />
40 Industrial Machinery & Information Business<br />
42 Plant, Power & Infrastructure Projects<br />
44 Development & Construction<br />
46 Finance & Logistics Business<br />
48 Iron & Steel Strategies and<br />
Coordination Department<br />
49 Business Incubation Department<br />
50 Overseas Operations<br />
54 Organization<br />
55 Financial Section<br />
100 Overseas Network<br />
102 Major Subsidiaries and Affiliates<br />
109 Directors, Corporate Auditors and<br />
Corporate Vice Presidents<br />
110 Management Policies at <strong>Marubeni</strong>/Corporate Data<br />
Disclaimer Regarding Forward-Looking Statements<br />
This annual report contains forward-looking statements about the performance and management plans of <strong>Marubeni</strong> and its Group companies, based on<br />
management’s assumptions in light of current information. The following factors may therefore influence actual results. These factors include consumer trends<br />
in Japan and in major global markets, private capital expenditures, currency fluctuations, notably against the U.S. dollar, materials prices, and political turmoil<br />
in certain countries and regions.
Strength in Accomplishment<br />
<strong>Marubeni</strong> Corporation 2005 0 / 1<br />
<strong>Marubeni</strong> is currently executing the “V” PLAN, a three-year management plan, which runs<br />
through the fiscal year ending March 31, 2006. Two years into the plan, <strong>Marubeni</strong> stands<br />
poised to achieve all of the numerical targets of the plan. During the current fiscal year, the<br />
final year of the “V” PLAN, we will continue to steadily and decisively enact the initiatives<br />
necessary to complete the plan, as we strive to realize the return of a stronger <strong>Marubeni</strong>.<br />
<strong>Trust</strong><br />
For two consecutive years since the start of the “V” PLAN, <strong>Marubeni</strong><br />
achieved the initial targets of the plan. As a result, <strong>Marubeni</strong>’s profitability<br />
and financial position have both improved far faster than anticipated.<br />
A rising share price and higher credit ratings indicate that outside<br />
approval of <strong>Marubeni</strong> is growing.<br />
<strong>Recovery</strong><br />
<strong>Marubeni</strong> posted record-high consolidated net income for a second<br />
consecutive year even as it absorbed nearly ¥100.0 billion in losses<br />
stemming from efforts to enhance asset quality through greater selectivity<br />
and focus.<br />
<strong>Growth</strong><br />
We are investing between ¥80.0 billion and ¥100.0 billion a year, mainly<br />
in priority business fields and markets where <strong>Marubeni</strong> either has clear<br />
strengths or where we anticipate future growth. Most of these investments<br />
have the potential to contribute to performance by realizing<br />
quick returns.<br />
<strong>Vitalization</strong><br />
The penetration of our management approach, the recent recovery in<br />
performance, and the greater certainty of achieving the “V” PLAN have<br />
combined with other factors to imbue employees with a newfound<br />
confidence and vigor as <strong>Marubeni</strong> becomes resurgent.<br />
✔<br />
✔<br />
✔<br />
✔
Fundamental “V” PLAN Policies<br />
and Progress<br />
The two biggest objectives of the “V” PLAN were to restore confidence and trust in the <strong>Marubeni</strong><br />
brand and transform <strong>Marubeni</strong> into a resilient corporate group. To accomplish this, our management<br />
policy is to strive to maintain top portfolio units in each industry.<br />
By strengthening the Company’s earnings base and improving its financial position primarily<br />
through stronger portfolio management and by placing renewed emphasis on risk-return profiles,<br />
the goals of the “V” PLAN are consolidated net income of ¥50.0 billion, consolidated net interestbearing<br />
debt of ¥2 trillion or less, and a net D/E ratio of 5.0 times or less in the fiscal year ending<br />
March 31, 2006.<br />
✔ Plan Progress<br />
<strong>Marubeni</strong> has posted record-high consolidated net income for two years running: ¥34.6 billion and<br />
¥41.2 billion for the years ended March 31, 2004 and 2005, respectively. As of March 31, 2005, net<br />
interest-bearing debt was ¥1,823.9 billion, as we enhanced profitability while holding this figure<br />
well below the “V” PLAN target of ¥2 trillion.<br />
The result of lower net interest-bearing debt and an improvement in shareholders’ equity due to<br />
growth in consolidated net income was that <strong>Marubeni</strong>’s net D/E ratio was 4.12 times at March 31,<br />
2005. In light of this steady progress with the plan, we are projecting results above plan for all numerical<br />
targets for the year ending March 31, 2006. That is, we are forecasting consolidated net income of<br />
¥60.0 billion, net interest-bearing debt of ¥1,950.0 billion and a net D/E ratio of 4.0 times or less.<br />
✔ Portfolio Management<br />
Alongside management at the traditional business division level, since April 2003, our drive to<br />
promote greater selectivity and focus has seen us conduct business management through the<br />
detailed separation of operations into 103 portfolio units (as of March 31, 2005), organized<br />
according to products handled, function, business model, region, client base and other criteria.<br />
✔ Management Emphasizing Risk-return Profiles<br />
<strong>Marubeni</strong>’s most important management indicator is PATRAC*, a unique metric based on the<br />
concept of the cost of capital and developed to ensure that returns are commensurate with<br />
assumed risk. PATRAC is used to evaluate business divisions and portfolio units, and provides the<br />
basis for upgrading our portfolio to include highly profitable assets and other actions to promote<br />
greater selectivity and focus in managing <strong>Marubeni</strong>’s asset base.<br />
* PATRAC (Profit After Tax less Risk Asset Cost) = Net income – (Risk assets x 8%)<br />
The performance benchmark is to achieve a positive and optimized PATRAC.
To Our Stakeholders<br />
In the two years since initiating the “V” PLAN, we have seen for ourselves the return<br />
of an undoubtedly stronger <strong>Marubeni</strong>. Propelled by the urgent agenda outlined by the<br />
“A” PLAN, our officers, including those at <strong>Marubeni</strong> Group companies, came together<br />
on a common vector with all other employees in our workforce to complete the “V”<br />
PLAN. Efforts thus far have resulted in a stronger earnings base and an improved<br />
financial position, both much faster than initially forecast. We are now well positioned<br />
to achieve all of the goals we set in the fiscal year ending March 31, 2006, the final<br />
year of the “V” PLAN.<br />
We envisioned the three years of the “V” PLAN as a period for the <strong>Marubeni</strong><br />
Group to regain the trust of our stakeholders and to cement the fundamentals required<br />
to leap ahead to our next stage of growth. Our steady progress in meeting plan objectives<br />
has brought with it other benefits, namely a rising share price and improved credit<br />
ratings. These outcomes have convinced me that we have regained the confidence of<br />
the markets and that trust in <strong>Marubeni</strong> is again growing.<br />
Our overarching goals for the current fiscal year are two-fold: to be a resilient group<br />
possessing the industry’s top portfolio units, and to put the finishing touches to initiatives<br />
needed to deliver a corporate structure for tackling competition from other trading<br />
companies head on. Having come this far, we have no intention of letting up now.<br />
Spurred on by a sense of urgency, we are committed to completing the objectives of the<br />
“V” PLAN, and to winning back the trust of all <strong>Marubeni</strong> stakeholders.<br />
Every one of us at <strong>Marubeni</strong>, officers and all other employees included, is driven to<br />
do our utmost to raise corporate value and become a worthy enterprise in the eyes of<br />
our stakeholders. As always, your steadfast support and encouragement will be essential<br />
to our success in this endeavor.<br />
July 2005<br />
Nobuo Katsumata, President and CEO
<strong>Marubeni</strong> Corporation 2005 4<br />
/ 5
Interview with the President and CEO<br />
Meeting our objectives over the past three years has given employees greater confidence,<br />
while ingraining in all of us a corporate culture of going the extra mile to fulfill the promises<br />
that we make. In this way, we have held firmly and unswervingly to the road to recovery. As<br />
president, let me say on behalf of <strong>Marubeni</strong>’s directors and other employees that we stand<br />
ready to bring the “V” PLAN to a successful close, and will take every feasible course to<br />
realize the reemergence of a stronger <strong>Marubeni</strong>.<br />
Question 01<br />
The “V” PLAN for creating a stronger <strong>Marubeni</strong> has just<br />
completed its second year. How would you rate your progress<br />
on the plan thus far?<br />
The “V” PLAN was launched in April 2003. Yet in two short years, we have witnessed far faster<br />
progress in achieving our most pressing objectives—restoring confidence and trust in the <strong>Marubeni</strong><br />
Group and transforming ourselves into a resilient corporate group—than I initially believed possible. On<br />
a consolidated basis, net income for the year under review rose 19% from the previous fiscal year to<br />
¥41.2 billion, for a second straight year of record earnings. We also shored up our financial position,<br />
reducing net interest-bearing debt to ¥1,823.9 billion, substantially lower than our target of ¥2,000<br />
billion by March 31, 2006. Steadily accumulating earnings have also had a positive effect on shareholders’<br />
equity, which was up ¥50.2 billion from the previous fiscal year-end to ¥443.2 billion. This, in turn,<br />
helped our net D/E ratio improve to 4.12 times, compared to 5.01 times a year earlier. Since<br />
our goal for March 31, 2006 calls for shareholders’ equity of between ¥400 billion and ¥500<br />
billion, and a net D/E ratio of 5.0 times or lower, we have, in effect, successfully achieved<br />
both these objectives ahead of schedule.<br />
During the past year, we accelerated our push to be more selective and focused<br />
by replacing assets in our portfolio to enhance asset quality. This drive included the<br />
booking of losses stemming from our complete withdrawal from the Chandra Asri<br />
Project in Indonesia, which had become the largest point of concern for the<br />
Group. We achieved record net income even while absorbing the roughly<br />
¥100.0 billion in losses resulting from the early implementation of this and<br />
other initiatives. And virtually all business divisions posted higher earnings.<br />
This was clear evidence of the steady progress we have made in<br />
bolstering <strong>Marubeni</strong>’s earnings generation ability.<br />
Nobuo Katsumata<br />
President and CEO
Question 02 What factors do you believe allowed <strong>Marubeni</strong> to achieve consolidated<br />
Question 03<br />
net income above target for the second consecutive year?<br />
<strong>Marubeni</strong> Corporation 2005 6 / 7<br />
Strong commodity prices were one factor, as were favorable economic conditions in the United<br />
States and Asia, particularly China. But the single largest factor was the effective penetration and<br />
steady implementation of management policies and strategies that reflected the tough lessons<br />
learned in the past.<br />
Extensive portfolio management has been the most important factor. This involved the detailed<br />
separation of our previous business divisions and operating companies into 103 portfolio units organized<br />
according to product and business model, region, client base and other criteria. These units and<br />
operating companies are evaluated using PATRAC*, a metric based on the concept of the cost of<br />
capital, and which has provided the basis for the vigorous elimination of unprofitable operations.<br />
Prioritizing the concentration of management resources in fields where <strong>Marubeni</strong> has competitive<br />
advantages has been vital to stimulating earnings growth. In the first two years of the “V” PLAN, we<br />
invested around ¥180.0 billion in priority fields, among them food distribution, pulp and paper, natural<br />
resource development and the overseas Independent Power Producer (IPP) business. Of these, our<br />
investments in natural resource development and overseas IPP projects have had an almost immediate<br />
effect on earnings. In fact, the contribution from these projects was largely responsible for the significant<br />
earnings growth posted in the past year.<br />
In the current fiscal year, we plan to make nearly ¥100.0 billion in new investments, mostly in<br />
priority business fields. That amount will rise further if we uncover more promising targets that meet<br />
our investment criteria.<br />
*PATRAC (Profit After Tax less Risk Asset Cost) = Net income – (Risk assets x 8%)<br />
The performance benchmark is to achieve a positive and optimized PATRAC.<br />
One of <strong>Marubeni</strong>’s strengths is the commodity trade business model.<br />
What are your strategies in this area?<br />
For the commodity trade business model, we are developing a value chain through business investments<br />
in upstream through to downstream areas, where we are generating earnings at every stage.<br />
This model is one of <strong>Marubeni</strong>’s traditional strong suits, and has become a vital earnings pillar. We will<br />
build a resilient earnings base by being more selective in where we focus resources and investing in<br />
the priority fields of food distribution, pulp and paper, and natural resource development.<br />
In food distribution, we were chosen as a sponsor for the corporate revitalization of food retailer<br />
The Daiei, Inc. Successful completion of this rehabilitation program will enable us to create a complete<br />
value chain covering upstream through to downstream areas, but it will also provide an opportunity to<br />
take optimal advantage of our upstream and midstream strengths. Upstream, we handle one of the
Interview with the President and CEO<br />
✔ Food Distribution<br />
<strong>Marubeni</strong> decided to subscribe in part to a private placement of shares by<br />
Daiei, a major Japanese food retailer. <strong>Marubeni</strong> will assist Daiei by supplying<br />
merchandise attuned to customer needs and will take part in joint<br />
development projects. In addition, leveraging its strengths as a general<br />
trading company, <strong>Marubeni</strong> will forge ties with influential partners in a<br />
variety of fields to attract high-quality tenants,<br />
achieve greater distribution efficiency, and<br />
reconfigure information systems, for example.<br />
All support will aid Daiei’s rehabilitation.<br />
March 7, 2005 press conference announcing support for Daiei<br />
largest volumes of soybeans and wheat among Japanese trading companies. In midstream fields,<br />
<strong>Marubeni</strong> has Nacx Nakamura Corporation and Yamaboshiya Co., Ltd., two prominent wholesalers.<br />
In downstream areas, amid increasingly diverse consumer needs, we have already invested in The<br />
Maruetsu, Inc. and Tobu Store Co., Ltd. The sheer volume of information from retail spaces on the<br />
scale made possible through Daiei will emerge as an essential asset in helping to fully leverage<br />
<strong>Marubeni</strong>’s upstream and midstream capabilities. Moreover, stronger buying power will lead to<br />
lower distribution costs, enabling us to develop a structure for providing customers with better<br />
products at a lower cost.<br />
In paper and pulp, we have completely withdrawn from the Chandra Asri Project, acquiring<br />
instead business rights to P.T. Mushi Pulp in Indonesia. This move positions <strong>Marubeni</strong> to respond to<br />
projected growth in demand in Asia with an integrated production and supply framework encompassing<br />
everything from afforestation to pulp operations. As a result, we have a bi-polar structure with<br />
bases situated in North America, centered on Daishowa-<strong>Marubeni</strong> International Ltd., and Asia that will<br />
enable us to reinforce the value chain in this field, which we believe will lead to more dynamic and<br />
expansive pulp operations. Natural resource development, meanwhile, will see us continue efforts<br />
begun three years ago to acquire additional equity stakes and other assets in this area.<br />
In energy-related operations, in the past fiscal year, we acquired additional oil and gas assets<br />
in U.K. waters in the North Sea, and increased metal and mineral resource-related investment in<br />
mines in Australia and elsewhere. These investments, in fact, became a major driver behind<br />
earnings during the past year. Natural resource development is a priority field, one that we plan to<br />
continue actively investing in.
Question 04<br />
The Sakhalin I Project<br />
in Russia.<br />
by Courtesy of Exxon<br />
Neftegas Limited<br />
Natural resource development led substantial earnings growth<br />
during the year under review.<br />
What strategies are in the works for this field?<br />
✔ Natural Resource Development<br />
<strong>Marubeni</strong> Corporation 2005 8 / 9<br />
<strong>Marubeni</strong> already possesses rights to more than 30,000 barrels/day of oil and gas (barrels of oil<br />
equivalent per day (boed)). In the fiscal year ending March 31, 2006, one goal is to boost that level to<br />
somewhere around 50,000 boed. Our fundamental strategy will be to skillfully balance a combination of<br />
production assets that can contribute immediately to <strong>Marubeni</strong>’s business performance with development<br />
assets that show substantial promise for the future. We are also looking to achieve stable growth<br />
by diversifying our investments to mitigate risk from a geopolitical standpoint. Where coal, copper,<br />
aluminum and other metal and mineral resources are concerned, we continue to extend our portfolio of<br />
assets through additional investments, pursuing earnings opportunities at every possible stage, including<br />
resource development and trade.<br />
In the energy field, <strong>Marubeni</strong> has been involved in<br />
the Sakhalin I Project as a shareholder in Sakhalin<br />
Oil and Gas Development Co., Ltd. (SODECO), in<br />
addition to owning oil and gas interests in U.K.<br />
waters in the North Sea, U.S. waters in the Gulf<br />
of Mexico, and in India and Qatar. With the<br />
purchase in October 2004 of Energy North Sea<br />
Holdings Ltd., which has its own oil and gas<br />
interests in the North Sea, <strong>Marubeni</strong> has expanded<br />
its earnings base in this region.
Interview with the President and CEO<br />
✔ Overseas IPP<br />
In January 2005, <strong>Marubeni</strong> won the right to a 20-year contract for<br />
operating a large-scale power and water project in the Emirate of Abu<br />
Dhabi, UAE. The total cost of the project is approximately US$3.0<br />
billion, including costs for the purchase of existing plants and land for<br />
the construction of new plants. On a monetary scale, this project is the<br />
world’s largest Independent Water and Power Project (IWPP). Initial<br />
operations commenced in April 2005, with new plants scheduled for<br />
completion in July 2008.<br />
Question 05<br />
Question 06<br />
On what grounds did <strong>Marubeni</strong> decide to support Daiei,<br />
and what specific rehabilitation plans do you have in mind?<br />
Food distribution is one of <strong>Marubeni</strong>’s priority fields in the “V” PLAN. We have boosted our presence in<br />
this area through investments in Maruetsu and Tobu Store. <strong>Marubeni</strong>’s support role for Daiei meshes<br />
perfectly with our food distribution strategies. Moreover, prospects are extremely good that Daiei’s<br />
corporate rehabilitation plan will improve its financial position, lead to effective business plan implementation,<br />
and actually revitalize its operations. Viewed as an individual business project, Daiei meets<br />
our prerequisites for investment and offers ample opportunity for returns, which is why we decided to<br />
participate as one of its sponsors. Our primary task will be to raise Daiei’s corporate value. As we<br />
communicate closely with Daiei’s management team and the Industrial Revitalization Corporation of<br />
Japan (IRCJ), we will bring <strong>Marubeni</strong>’s full capabilities as a general trading company to bear in helping<br />
Daiei reemerge as a more appealing retail enterprise in the eyes of consumers. To do this, we have<br />
assigned directors and a number of personnel drawn from across the <strong>Marubeni</strong> Group to serve at Daiei<br />
to ensure that our sponsorship duties are fully met. With this support, I am convinced that Daiei can<br />
succeed in revitalizing its business.<br />
What are your strategies for the project solution<br />
service business model?<br />
Taweelah B power and<br />
water plant in Abu Dhabi<br />
Reflecting on past experience, we will clarify the types of projects that <strong>Marubeni</strong> will steer clear of,<br />
while making the most of the industrial and power plants we have built to develop this business model<br />
into one able to secure stable earnings over the long term.<br />
In the “V” PLAN, we positioned the overseas IPP business as a priority business field, but it is also<br />
one where we have a strong track record and expertise. During the year under review, we won the right<br />
to operate one of the world’s largest power and water facilities in the Emirate of Abu Dhabi, UAE. This<br />
project has resulted in <strong>Marubeni</strong> possessing a gross capacity of around 6,400 MW, and has enhanced
Question 07<br />
Question 08<br />
<strong>Marubeni</strong> Corporation 2005 10 / 11<br />
our presence as one of the top players in the IPP business in Asia. Moreover, based on average 20-year<br />
contracts for supplying electricity to regional power companies, we are striving to make this business<br />
model into a long-term source of consistent earnings. In Development & Construction, too, our hard-won<br />
expertise in condominium sales, a key earner in this business area, is enabling us to make inroads into<br />
real estate funds and other new fields.<br />
China has been cited as <strong>Marubeni</strong>’s most important market.<br />
Has the relationship between China and Japan in recent<br />
years caused any changes in this policy?<br />
Our stance remains that Asia, and particularly China, as a force propelling favorable global economic<br />
growth, represents a priority market for <strong>Marubeni</strong>. China continues to grow in stature as a global<br />
manufacturing center, and has recently emerged as an enormous market in its own right where the<br />
level of demand is substantial. I believe this demand will only grow in the years that follow, which is<br />
why we established the China Business Strategic Planning & Promotion Committee to coordinate our<br />
China initiatives across business divisions.<br />
Our alliances in China typically follow one of two patterns. One is to forge ties with Japanese<br />
manufacturers looking to establish production and other bases in China. We take the initiative in<br />
building the production bases and supplying them with the necessary raw materials. We then supply<br />
the goods produced to markets worldwide. In light of the rapid spread of next-generation mobile<br />
phones, LCD televisions and other equipment in recent years, we think that basic chemicals and<br />
electronic materials hold particular promise as major business fields in the coming years. The other<br />
pattern is to establish partnerships with prominent Chinese enterprises, making investments along the<br />
way as needed.<br />
China’s growth has sparked changes in its relations with other regions in Asia. It is likely that the<br />
trading relationships between Japan and ASEAN nations that predominated until recently will gradually<br />
give way to increased trade between China and ASEAN nations, as well as within the ASEAN region. In<br />
response, we are appointing a General Manager for ASEAN charged exclusively with overseeing our<br />
operations in the ASEAN region as we recruit the assistance of business divisions at our Head Office in<br />
a proactive thrust to expand transaction volume.<br />
Your consolidated net income forecast for the current fiscal year<br />
was revised upward to ¥60 billion. Is this target attainable?<br />
I am confident that we can attain it. Our clear management strategies, alongside management systems<br />
that place emphasis on risk-return profiles, have permeated the Group in an extremely effective<br />
manner. Together with our aggressive investment in priority business fields, our core earnings*, which<br />
* Core earnings refer to the sum of real operating profit, dividend income and equity in earnings of affiliated companies<br />
(excluding restructuring-related items).
Interview with the President and CEO<br />
Question 09<br />
indicate the extent of <strong>Marubeni</strong>’s actual earnings power, have risen by around 21% since the fiscal year<br />
ended March 31, 2004. Meanwhile, we have taken proactive steps to reduce and write off loss-making<br />
businesses and problem assets, including the complete withdrawal from the Chandra Asri Project,<br />
which had become a major cause for concern. We have now completed actions for dealing with<br />
problematic business and large losses. Our decision to proactively replace portfolio assets over the last<br />
two years was directly responsible for the sharply improved performance seen in the past fiscal year.<br />
At this point, we are expecting all business segments to turn a profit in the fiscal year ending March 31,<br />
2006, and for profitable subsidiaries to account for around 90% of all Group companies. Alongside<br />
divisions involved in natural resource development, such as Energy and Metals & Mineral Resources,<br />
two key earnings drivers during the year under review, we hope to see earnings growth from those<br />
divisions we have prioritized for investment, namely Agri-Marine Products, Forest Products & General<br />
Merchandise, and Utility & Infrastructure. Earnings growth should also emerge in the Industrial<br />
Machinery & Information Business, the Plant, Power & Infrastructure Projects and other restructured<br />
divisions. From the current fiscal year onward, unprofitable businesses will require less attention.<br />
Moreover, benefits should start to appear from our investments in priority fields and regions, meaning<br />
that, barring any radical external changes, we are undoubtedly on course to achieve our revised<br />
earnings target.<br />
Backed by stronger earnings power, we have posted record earnings for two years running.<br />
Meanwhile, we are on track to accomplish all of the objectives outlined in the “V” PLAN, including<br />
improving our financial standing. To return part of this profit growth to our shareholders, for the year<br />
under review, we declared a cash dividend of ¥4 per share of common stock, ¥1 more than in the<br />
previous year. We plan to raise this payout again in the fiscal year ending March 31, 2006, this time to<br />
¥6 per share, including an interim dividend of ¥2 per share.<br />
Could you describe some of <strong>Marubeni</strong>’s initiatives for strengthening<br />
corporate governance and corporate social responsibility (CSR),<br />
given the growing importance of both in recent years ?<br />
Since unveiling the “V” PLAN, we have reduced the term of office for directors from two years to one<br />
in a move to invigorate management further. In parallel, we made changes in how the Board of<br />
Directors is chaired and have recruited people from outside the Group to serve on the Management<br />
Remuneration Committee, among other actions. In one move, the Board of Directors has been<br />
presided over by the chairman since April 2004, who has no business execution authority. This is a step<br />
specifically designed to clarify and demarcate management’s business execution and oversight<br />
functions. In June 2005, we welcomed aboard <strong>Marubeni</strong>’s first outside directors to improve management<br />
soundness and transparency, as well as to reinforce the supervisory and oversight functions of<br />
our representative directors. Previously, in April 2004, we launched the Internal Control System Project,<br />
a Group-wide program aimed at ensuring the reliability of the Group’s financial reporting. Led by this<br />
project, we have completed the documentation of operational processes and made other decisive<br />
choices to upgrade our systems.
Question 10<br />
<strong>Marubeni</strong> Corporation 2005 12 / 13<br />
In terms of CSR, initiatives have centered on the creation of new internal structures for the<br />
detailed allocation of personnel responsible for CSR information disclosure. Measures have included<br />
the appointment of a director in charge of CSR, establishment of a CSR Committee and a specialized<br />
CSR section, and the publication of a CSR Report, just to name a few. In other CSR actions, we are<br />
aggressively promoting environmental businesses, and have adopted a system that allows employees<br />
to take time off for volunteer work. And as always, we continue to take on board a range of initiatives<br />
in support of the environment and human rights, as well as to contribute to the communities where we<br />
operate. All of this is part of our commitment to making a sustainable contribution to the greater<br />
society. For over 30 years, one symbol of this commitment has been the <strong>Marubeni</strong> Foundation, a social<br />
welfare organization established by <strong>Marubeni</strong> and the <strong>Marubeni</strong> Group through which we continue to<br />
provide assistance to private-sector groups involved in social welfare activities.<br />
Do you have any final remarks for <strong>Marubeni</strong>’s stakeholders ?<br />
Today, <strong>Marubeni</strong> has stronger earnings power, a more solid financial foundation, and improved credit<br />
ratings, as well as a rising share price and a lower bond spread—definite proof that both the trust<br />
<strong>Marubeni</strong> commands and its reputation among those outside the Group are growing. We positioned<br />
the three-year period of the “V” PLAN as a time for the <strong>Marubeni</strong> Group to regain stakeholder trust in<br />
terms of earnings and financial position, in preparation for competition on an equal footing against other<br />
trading companies. But my perception is that we have narrowed the gap between <strong>Marubeni</strong> and its<br />
industry peers far faster since the start of the plan than anyone expected. While we are already<br />
formulating our post-”V” PLAN vision for <strong>Marubeni</strong>, completion of the plan still stands as the last and<br />
most important hurdle we first need to clear. Meeting our objectives over the past three years has<br />
given employees greater confidence, while ingraining in all of us a corporate culture of<br />
going the extra mile to fulfill the promises that we make. In this way, we have held<br />
firmly and unswervingly to the road to recovery. A sense of urgency is still evident<br />
among all <strong>Marubeni</strong> Group employees, and we have no intention of letting go of this<br />
crisis response mindset just yet. Instead, we will take this opportunity to reconfirm our<br />
dedication as we move to achieve the objectives ahead of us. As president, let me say<br />
on behalf of <strong>Marubeni</strong>’s directors and other employees that we stand ready to bring the<br />
“V” PLAN to a successful close, and will take every feasible course to realize the<br />
reemergence of a stronger <strong>Marubeni</strong>.
Corporate Social Responsibility<br />
Guided by the Spirit of “Fairness, Innovation, Harmony”<br />
The basis for corporate social responsibility (CSR) at <strong>Marubeni</strong> is<br />
“Fairness, Innovation, Harmony,” which was formulated as the company creed<br />
when <strong>Marubeni</strong> was established in 1949. Every member of the <strong>Marubeni</strong> Group<br />
is committed to carrying on with the corporate ambitions passed on by<br />
our predecessors in order to make a meaningful contribution to society.<br />
Although CSR is a concept that has gained attention only in<br />
the past few years, corporate citizenship has been central to<br />
the operations of <strong>Marubeni</strong> since its 1949 establishment, as<br />
well as through the years dating back to its earliest days in the<br />
mid-19th century. <strong>Marubeni</strong> founder Chubei Ito sought to<br />
prosper together with society, rather than merely pursuing<br />
profits only for his company. Upon <strong>Marubeni</strong>’s 1949 establishment,<br />
and despite the immense challenges of Japan’s postwar<br />
period, <strong>Marubeni</strong>’s first president Shinobu Ichikawa set<br />
forth the principles of “Fairness, Innovation, Harmony” as the<br />
company’s guiding management philosophy. In the ensuing<br />
years, <strong>Marubeni</strong> has never forgotten the need to place priority<br />
on building sound relationships with society, the environment<br />
and people.<br />
“Fairness” refers to the strict compliance with laws,<br />
conducting operations in a fair and transparent manner.<br />
“Innovation” expresses our determination to be passionate<br />
Fairness:<br />
Act with fairness and integrity at all times.<br />
Innovation:<br />
Pursue creativity with enterprise<br />
and initiative.<br />
Harmony:<br />
Give and earn the respect of others<br />
through cooperation.<br />
about our work, always striving to bring about change from<br />
within and thinking creatively. “Harmony” represents the<br />
desire to be in step with all elements of society, always acting<br />
in a manner that earns the trust of the public.<br />
General trading companies handle a broad spectrum of<br />
products and services worldwide. Due to this enormous<br />
scope of activities, CSR is deeply ingrained not only in every<br />
aspect of our organization, but also in every individual who<br />
works at the <strong>Marubeni</strong> Group. A company must develop new<br />
markets and businesses in order to generate earnings. But<br />
profits must be earned while respecting social standards for<br />
behavior and gaining the trust of all stakeholders. In other<br />
words, profits are pointless unless they are accompanied by<br />
business activities that are transparent and fair. In this sense,<br />
the “Fairness, Innovation, Harmony” concept that has guided<br />
activities for more than 50 years lies at the heart of all<br />
<strong>Marubeni</strong> CSR activities.<br />
<strong>Marubeni</strong> Corporate Principles<br />
<strong>Marubeni</strong> Corporation, as a business enterprise, will actively pursue its business<br />
interests through the exercise of fair and legal competition. As a company, <strong>Marubeni</strong> will<br />
also continue to play its part in the enlargement of the global economy, while always<br />
striving to enrich the society within which it operates. To achieve these goals, <strong>Marubeni</strong><br />
is committed to the following six basic principles of business:<br />
• We shall conduct fair and transparent business activities.<br />
• We shall seek to develop a globally connected company.<br />
• We shall strive to create new value through our business vision.<br />
• We shall respect and encourage individuality and originality.<br />
• We shall promote good corporate governance.<br />
• We shall safeguard ecological and cultural diversity.
In April 2004, <strong>Marubeni</strong> established the CSR Committee.<br />
Until then, individual departments had been responsible for<br />
CSR activities covering social contribution, environmental<br />
preservation, human rights and other themes. The committee<br />
provides a unified platform for determining group-wide CSR<br />
policies and increasing the group’s commitment to CSR. The<br />
committee reports directly to the president. Its chairman is<br />
the director in charge of CSR, who is named by the president,<br />
and other members are general managers of the Corporate<br />
Staff division. The CSR Committee has selected various<br />
themes which <strong>Marubeni</strong> is tasked with carrying out as a good<br />
corporate citizen: strengthening corporate governance;<br />
conducting a rigorous compliance program; conducting<br />
environmental protection programs; improving various<br />
systems to fully tap the capabilities of employees; ensuring<br />
respect for human rights; and supporting employees who<br />
serve as volunteers at charities. Action plans are formulated<br />
The storefront of <strong>Marubeni</strong> Corporation forerunner Ito Chubei Shoten, and an antique<br />
oilpaper umbrella embossed with the kanji character “Beni.” Long synonymous in Japan<br />
with honor and nobility, the spirit of this character continues to be reflected in <strong>Marubeni</strong>’s<br />
own lofty ambitions.<br />
<strong>Marubeni</strong> Corporation 2005 14 / 15<br />
so that CSR activities can be conducted by harnessing the<br />
collective initiative of all divisions and group companies.<br />
Information on CSR activities is provided through the<br />
<strong>Marubeni</strong> CSR Report as well as the company’s website, annual<br />
report, corporate advertisements and other channels. Within<br />
the <strong>Marubeni</strong> Group, this information is distributed using<br />
internal publications, the intranet, e-mail messages from the<br />
president and other means. Everyone at the group is frequently<br />
reminded of the corporate ambitions that have pervaded<br />
<strong>Marubeni</strong> since its founding. Through these activities, <strong>Marubeni</strong><br />
is constantly fostering a corporate culture that encourages<br />
employees to make the company creed “Fairness, Innovation,<br />
Harmony” a part of every aspect of their work.
Corporate Governance<br />
The <strong>Marubeni</strong> Group’s pursuit of stronger corporate governance closely reflects the underlying<br />
spirit expressed in its corporate creed, company doctrine, and the <strong>Marubeni</strong> Corporate Principles.<br />
Through its efforts, the Group strives to ensure management transparency and maximize corporate<br />
value. By earning the trust of its stakeholders, the <strong>Marubeni</strong> Group is working to build a reliable and<br />
sustainable Group business base.<br />
Structure for Enhancing Corporate<br />
Governance<br />
Past measures taken by <strong>Marubeni</strong> to enhance corporate<br />
governance have included shortening the terms of directors<br />
from two years to one, replacing the company president as<br />
chair of the Board of Directors with the company chairman,<br />
recruiting outside experts to the Management Remuneration<br />
Committee, and convening meetings of the Advisory Committee.<br />
However, in a move to further strengthen corporate<br />
governance by reinforcing checks and balances and supervision<br />
over its directors, <strong>Marubeni</strong> appointed two outside<br />
directors in June 2005.<br />
Nobuo Katsumata<br />
President and CEO<br />
Kazuo Ogawa<br />
Corporate Executive<br />
Vice President<br />
Tomoyuki Nakayama<br />
Corporate Senior<br />
Vice President<br />
Since April 2004, the <strong>Marubeni</strong> Group has also been implementing<br />
the Internal Control System Project, primarily to ensure<br />
the reliability of its financial reporting. Steady progress is being<br />
made on the project; outside consultants have been brought on<br />
to share expertise and the documentation of operational<br />
processes, IT systems and other areas is now complete.<br />
These and other initiatives have increased <strong>Marubeni</strong>’s<br />
transparency in the eyes of its diverse stakeholders and led to<br />
tougher corporate governance. Hence, <strong>Marubeni</strong> is confident<br />
that it can mold itself into the kind of company demanded in<br />
this new era of business.<br />
Michio Kuwahara<br />
Corporate Senior<br />
Vice President<br />
Akira Matsuda<br />
Corporate Executive<br />
Vice President<br />
Teruo Asada<br />
Corporate Senior<br />
Vice President
Management Control Organization at <strong>Marubeni</strong><br />
Masaru Funai<br />
Corporate Senior<br />
Vice President<br />
Nomination and<br />
dismissal<br />
Board of<br />
Directors<br />
Nomination, dismissal,<br />
supervision<br />
Directors<br />
Twelve directors (2 outside)<br />
Shigeki Kuwahara<br />
Executive Deputy<br />
President<br />
President<br />
Corporate Management<br />
Committee<br />
Investment and Credit Committee<br />
“V” PLAN Committee<br />
Committee of Executive Officers<br />
Executive Officers<br />
General Meeting of Shareholders<br />
Audit<br />
Accounting audit<br />
Compliance Committee<br />
Management Remuneration<br />
Committee<br />
Commendation & Disciplinary<br />
Action Committee<br />
Environment Committee<br />
Makoto Isogai<br />
Corporate Executive<br />
Vice President<br />
Operating Divisions<br />
Board of<br />
Corporate Auditors<br />
Corporate Staff Divisions<br />
Domestic and Overseas Business Offices<br />
Masao Fujii<br />
Auditors<br />
Outside Director<br />
Nomination and<br />
dismissal<br />
Four Corporate Auditors (2 outside)<br />
Independent Auditor<br />
Accounting audit<br />
Customs Management Committee<br />
Security Export Control Committee<br />
CSR Committee<br />
Environmental Businesses<br />
Promotion Committee<br />
(Business<br />
Execution<br />
System)<br />
<strong>Marubeni</strong> Corporation 2005 16 / 17<br />
Takaji Kunimatsu<br />
Outside Director<br />
Nomination and<br />
dismissal<br />
Audit Office<br />
Internal audit<br />
Cooperation<br />
Audit Department<br />
Tohru Tsuji<br />
Chairman
Risk Management<br />
As emphasized in the “V” PLAN, we have positioned risk management as the key<br />
tool to ensure our earning power and to maximize corporate value. <strong>Marubeni</strong> has<br />
implemented an integrated risk management system based on Value at Risk (VaR) as<br />
part of a ceaseless drive to improve the management of risk.<br />
Through the 1990s, <strong>Marubeni</strong> applied a project-by-project<br />
approach to risk management that made risk-return<br />
performance a function of the aggregate of many individual<br />
management decisions. This approach had the disadvantage<br />
that it did not provide adequate control over risk<br />
diversification. Consequently, <strong>Marubeni</strong> was unable to<br />
appropriately respond to the simultaneous and frequent<br />
materialization of risks in specific segments like during the<br />
currency crisis in Asia.<br />
Based on these experiences, <strong>Marubeni</strong> is shifting its focus<br />
to a management method, which uses “portfolio management”<br />
to oversee the risk in group assets as a whole so as<br />
not to appropriate assets unevenly among certain countries,<br />
industries, or clients.<br />
The basis of portfolio management is in quantifying the<br />
risk of assets for the Group as a whole, including those<br />
held by subsidiaries. In order to do this, assets are categorized<br />
by country, industry, credit rating, and projected<br />
recovery date, and by calculating the Value at Risk (VaR),<br />
“Value at Risk” Assessment Scale<br />
Small asset value Large asset value<br />
Worst case (99%) asset value<br />
Unexpected loss =<br />
Handled with equity capital<br />
Expected asset value<br />
Expected loss =<br />
Reserves<br />
which takes into account dispersion effects and correlations.<br />
By adopting a simulation system that uses an<br />
independently developed computerized statistical model,<br />
we have made it possible to grasp risk levels at a more<br />
minute level than other companies. The method, called<br />
“Integrated Risk Management,” integrates various risk<br />
factors, and monitors them as one risk value.<br />
Based on the risk of the maximum decline in the value of<br />
Group assets as quantified by integrated risk management,<br />
profit after tax less risk asset cost (PATRAC*, which equals<br />
net income – [risk assets x 8%]), the main management<br />
metric in the “V” PLAN, is calculated and used as the portfolio<br />
unit performance indicator.<br />
PATRAC indicates total added value after adjustment for risk<br />
and enables each portfolio unit to achieve maximum returns<br />
for a given level of risk. <strong>Marubeni</strong> is committed to proactive<br />
review and reshuffling of its assets to achieve balanced<br />
growth through the maximization of PATRAC.<br />
*PATRAC = Profit After Tax less Risk Asset Cost<br />
Amount of principal<br />
High possibility<br />
Low possibility<br />
Definition<br />
The largest amount of momentary<br />
loss expected to occur within a<br />
certain time period, based on a<br />
certain probability standard<br />
determined by the decision maker.<br />
= VaR reliability interval of 99%<br />
= Required stockholder capital<br />
= Risk asset
Compliance<br />
The <strong>Marubeni</strong> Group not only views legal compliance as the most basic duty of all<br />
Group directors and employees, but is also, as a member of society, committed to<br />
corporate behavior that conforms to the highest ethical standards. Accordingly, the<br />
Group has positioned compliance as management’s top priority, and is committed to<br />
creating and maintaining a framework that supports and ensures sound compliance.<br />
Framework for Stronger Group Compliance<br />
In April 2002, <strong>Marubeni</strong> established a Compliance Committee<br />
that is under direct supervision of the president as a step<br />
towards building a Group-wide compliance framework. In parallel,<br />
<strong>Marubeni</strong> has installed separate, effective compliance structures<br />
within all business divisions and Group companies. The aim of<br />
these structures, centered on a system of compliance officers<br />
appointed in each business area, is to accurately reflect the<br />
differences that exist between various areas and industries.<br />
Aiming to further reinforce compliance activities, the “V”<br />
PLAN in April 2003 also identifies strengthening of the Group<br />
compliance framework as one of the most important issues<br />
facing the company. To this end, the chair of the Compliance<br />
Committee visits major Group companies, reporting on the<br />
compliance frameworks in place and status of compliance<br />
activities, and holds discussions with Group employees to<br />
drive home the critical importance of compliance and ensure<br />
that employees are on the same wavelength in terms of<br />
compliance thinking.<br />
Compliance Organization Chart of <strong>Marubeni</strong> Group<br />
Group Companies<br />
Board of Directors<br />
President<br />
Nomination<br />
Compliance Officers of Divisional and<br />
Branch Office<br />
Instruction and<br />
advice<br />
Report<br />
Officer Responsible for Compliance in Each Group Company<br />
Employees of each Group Company<br />
Report and consultation<br />
Corporate Auditors<br />
General Managers of Iron & Steel<br />
Strategies and Coordination Dept.,<br />
Business Incubation Dept. and CS Dept.<br />
<strong>Marubeni</strong> Corporation 2005 18 / 19<br />
In April 2005, <strong>Marubeni</strong>’s compliance manual was revised to<br />
reflect recent legal changes and trends, and distributed to all<br />
Group officers and employees.<br />
Issues to Be<br />
Addressed<br />
Actions taken by <strong>Marubeni</strong><br />
over the past three years<br />
have highlighted the importance<br />
of fostering a deep-<br />
e-learning training screen<br />
rooted compliance-oriented<br />
mindset among Group officers and employees. Since it is vital<br />
for all employees to regularly remind themselves of<br />
compliance requirements, <strong>Marubeni</strong> is currently introducing<br />
an e-learning-based compliance training program. Moving<br />
forward, <strong>Marubeni</strong> will further entrench compliance thinking<br />
group-wide in order to bolster the <strong>Marubeni</strong> Group’s reputation<br />
as a “credibility-oriented, reliable business group.”<br />
Compliance Officer<br />
Compliance Committee<br />
Instruction<br />
External Legal Counsel<br />
Employees<br />
* A broken line means a route of report and consultation.
Our Commitment to Sustainable <strong>Growth</strong><br />
Environmental issues emerged as a global concern from the late 1980s throughout the 1990s.<br />
As the 21 st century unfolds, conducting eco-conscious business operations is becoming an increasingly<br />
vital task for corporations to attain a society where sustainable growth can be realized.<br />
<strong>Marubeni</strong> recognizes the responsibility that all people and enterprises on Earth today have to<br />
protect our natural environment. It was this awareness that led it to establish the Committee on<br />
Global Environmental Preservation as well as other initiatives, such as the <strong>Marubeni</strong> Group’s Environmental<br />
Policy, in an effort to promptly address environmental issues.<br />
Here at the dawn of the 21st century, people are more conscious<br />
than ever that environmental problems are the most recognizable<br />
threat to humanity’s very survival. As a trading company<br />
involved in a range of different business operations, <strong>Marubeni</strong><br />
has promoted Group-wide measures that take aim at environmental<br />
concerns. Guiding these efforts were the establishment<br />
of the Committee on Global Environmental Preservation in 1990,<br />
the formulation of an environmental guideline in 1991, and the<br />
creation of the <strong>Marubeni</strong> Group’s Environmental Policy as an<br />
upgraded version of this guideline in 1998.<br />
Based on the fundamental philosophy underlying its Environmental<br />
Policy, the <strong>Marubeni</strong> Group recognizes its responsibilities<br />
as a good corporate citizen to do its utmost to preserve<br />
the environmental well-being of the Earth, while striving for the<br />
harmony and prosperity of human society. With this commitment<br />
in mind, all <strong>Marubeni</strong> employees do their part to address<br />
environmental problems in the hope of ushering in a society<br />
where truly sustainable growth can be realized.<br />
In line with the aforementioned philosophy, <strong>Marubeni</strong> is<br />
introducing an Environmental Management System based on<br />
the internationally recognized ISO 14001 standard. This system<br />
will ensure that Group employees around the world share a<br />
common awareness of the <strong>Marubeni</strong> Group’s Environmental<br />
Policy, and will also serve as a tool for dealing with environmental<br />
issues. All divisions at the <strong>Marubeni</strong> Head Office<br />
acquired ISO 14001 certification in August 1999, followed soon<br />
after by branch companies and offices, overseas subsidiaries,<br />
and operating companies. As of March 31, 2005, 35 organizations<br />
within the <strong>Marubeni</strong> Group have received certification.<br />
The <strong>Marubeni</strong> Group’s Environmental Policy is also the driving<br />
force behind <strong>Marubeni</strong>’s involvement in eco-friendly businesses<br />
in an array of fields. Leveraging its unique traits as a trading<br />
company, the company is involved in operations as diverse as<br />
wind power generation, the recycling of PET bottles, and the<br />
conversion of waste construction materials into ethanol, to<br />
name a few. Most recently, <strong>Marubeni</strong> formed a new Emissions<br />
Credits Business Team to promote emissions trading, joint<br />
implementation and the Clean Development Mechanism<br />
(CDM). The adoption of these three “mechanisms” is stipulated<br />
in the “Kyoto Protocol,” the global environmental treaty that<br />
came into effect in February 2005.<br />
Another key action by <strong>Marubeni</strong> is its cooperation with<br />
different groups working to tackle environmental problems.<br />
Here, <strong>Marubeni</strong> provides support to TRAFFIC, an NGO<br />
managed jointly by the World Wildlife Fund (WWF) and the<br />
International Union for the Conservation of Nature and Natural<br />
Resources (IUCN) to monitor international trade in wild<br />
animals. In 2003, <strong>Marubeni</strong> assisted in the publication of<br />
educational leaflets about the Convention on International<br />
Trade in Endangered Species of Wild Fauna and Flora (CITES),<br />
also known as the “Washington Convention.” In the fiscal year<br />
ended March 31, 2005, this was followed by support for the<br />
creation of a website on the convention.<br />
Details of <strong>Marubeni</strong>’s environmental programs can be found<br />
in the <strong>Marubeni</strong> CSR Report and on its<br />
website. Going forward, <strong>Marubeni</strong> aims to<br />
use these and a host of other tools and<br />
opportunities to provide fair and accurate<br />
disclosure of such information within and<br />
outside of the Group, with a view to gaining<br />
the understanding of the public with regard<br />
to its activities in this area.
Corporate Citizenship<br />
<strong>Marubeni</strong> Corporation 2005 20 / 21<br />
Devising social contribution programs in which all employees could take part was one of <strong>Marubeni</strong>’s primary<br />
objectives for the fiscal year ended March 31, 2005. To this end, <strong>Marubeni</strong> embarked on several new initiatives,<br />
including the launch of a Volunteer Promotion Team, as well as disaster relief and environment cleanup activities.<br />
The <strong>Marubeni</strong> Foundation, a social corporation, stands as an example of effective and unique social welfare<br />
operations in Japan. Each year, the scale of donations made by the foundation is generally ¥100 million in total.<br />
Its generosity also extends to the dedicated men and women at the frontlines of social welfare, and it enjoys<br />
the support of the entire <strong>Marubeni</strong> Group.<br />
In 1998, <strong>Marubeni</strong> pledged in its Corporate Principles to<br />
“Respect international cultural diversity and seek to enhance<br />
regional prosperity through <strong>Marubeni</strong>’s business activities.”<br />
This commitment is the philosophy underlying <strong>Marubeni</strong>’s<br />
social contribution activities.<br />
In the fiscal year ended March 31, 2005, <strong>Marubeni</strong> made it<br />
one of its objectives to emphasize employee participation in<br />
its social contribution programs. The result was the inclusion<br />
of the following initiatives alongside <strong>Marubeni</strong>’s regular social<br />
contribution activities.<br />
Launch of the Volunteer Promotion Team: This team,<br />
responsible for planning and managing volunteer programs<br />
open to all employees, was formed to encourage employees<br />
to contribute to society, thereby enhancing corporate value.<br />
Disaster relief: As a key element in its support of disaster<br />
recovery efforts, <strong>Marubeni</strong> provided approximately ¥10<br />
million in donations and relief supplies to assist victims of<br />
the Niigata-Chuetsu Earthquake that struck Niigata, Japan.<br />
Employees were also dispatched to provide support in the<br />
affected region.<br />
Environment cleanup activities: Alongside cleanup efforts<br />
regularly spearheaded by its branch in Kyushu, <strong>Marubeni</strong>’s<br />
Osaka Head Office also initiated its own cleanup program<br />
during the fiscal year ended March 31, 2005.<br />
Other actions in <strong>Marubeni</strong>’s multifaceted social contribution<br />
programs during the fiscal year included the collection of<br />
individual donations to aid survivors of the Sumatra Earthquake<br />
that struck the<br />
coast of Indonesia, as<br />
well as participation in<br />
a regional tree-planting<br />
campaign in Nagoya,<br />
Japan.<br />
Cleanup activities during the year.<br />
(Osaka Head Office)<br />
30 Years of the <strong>Marubeni</strong> Foundation<br />
Founded over 30 years ago with a grant from <strong>Marubeni</strong> Corporation,<br />
the <strong>Marubeni</strong> Foundation has donated a total of ¥3 billion in<br />
support of 1,637 social welfare projects since 1975.<br />
Most social welfare institutions and groups struggle to<br />
procure the vehicles needed for their daily transportation of<br />
staff and products, as well as other equipment and facilities<br />
critical to their day-to-day activities. Despite this hardship,<br />
many social welfare foundations tend to exclude vehicle<br />
purchases from the scope of their donation. Moreover, many<br />
foundations that do provide such assistance still require<br />
recipients to bear a certain amount of the purchase cost for<br />
this essential equipment, putting needed funding well out of<br />
reach for numerous institutions and groups across Japan. The<br />
<strong>Marubeni</strong> Foundation has never erected such barriers, and all<br />
funding decisions are based solely on urgency and need. In<br />
this way, the foundation is lending grassroots-level support to<br />
social welfare programs throughout Japan.<br />
One of the sources of support for the <strong>Marubeni</strong> Foundation<br />
is individual donations from the ¥100 Club * . Recipients<br />
are featured in the foundation’s newsletter to provide<br />
employees with feedback on how the donations they helped<br />
to collect are being put to use. Through these donation<br />
activities, the <strong>Marubeni</strong> Foundation is playing a vital role in<br />
helping the <strong>Marubeni</strong> Group fulfill its responsibilities as a<br />
good corporate citizen.<br />
* The ¥100 Club is a system whereby <strong>Marubeni</strong> directors, employees and retirees<br />
pledge monthly donations in increments of ¥100. The total donations collected<br />
each year, typically around ¥10 million, are then given to the <strong>Marubeni</strong> Foundation.<br />
<strong>Marubeni</strong>’s philosophy that within all people is<br />
the generosity to help one another, and that all<br />
of us can work together to create a society that<br />
cares for the welfare of its people, is embodied<br />
in the logo of the <strong>Marubeni</strong> Foundation. The<br />
color green symbolizes peace, while light red<br />
stands for warmth and compassion. The “M”<br />
shape, meanwhile, represents <strong>Marubeni</strong>, while<br />
the ring symbolizes social harmony.
At a Glance<br />
Segment<br />
Agri-Marine<br />
Products<br />
Textile<br />
Forest Products &<br />
General Merchandise<br />
Chemicals<br />
Energy<br />
Metals &<br />
Mineral Resources<br />
Segment Trading Segment Assets<br />
Transactions as as Percentage of Total<br />
Percentage of Total<br />
12.3% 9.5%<br />
4.5% 2.8%<br />
10.0% 7.5%<br />
8.4% 4.0%<br />
22.3% 9.3%<br />
7.7% 4.6%<br />
Main Products and Services<br />
• The division is involved in the production and sale of food and food products<br />
of all kinds, including agricultural produce, such as grains and vegetables,<br />
marine products, livestock, processed foods, beverages and their<br />
ingredients, livestock feed and fodder, and fertilizers, and the provision of<br />
related services. Utilizing its global network, the division procures products<br />
matched to customer needs and ensures a stable product supply by conducting<br />
efficient logistics operations.<br />
• The division handles a broad range of goods destined for consumer products.<br />
Besides fiber, yarn, textiles, finished garments and non-apparel consumer<br />
items, including interior items and sundries, the division handles a<br />
variety of industrial materials. Leveraging <strong>Marubeni</strong>’s global network, the<br />
division uses its formidable procurement capabilities in both upstream and<br />
midstream channels to act as a comprehensive wholesaler that is pivotal to<br />
global production. Using its integrated capabilities that range from product<br />
planning to logistics, the division seeks to play a direct role in the expansion<br />
of consumer markets.<br />
•In pulp and paper, the division has built a value chain covering upstream to<br />
downstream areas, encompassing everything from afforestation to the<br />
manufacture of wood chips and pulp, and paper and paperboard, including<br />
the collection of wastepaper. The division conducts operations and trading<br />
activities in each of these business domains.<br />
•In general merchandise, the division handles a wide variety of products<br />
such as natural rubber, rubber products, leather, footwear, sporting goods,<br />
timber and plywood.<br />
•Operation of businesses spanning a broad range of chemical-related sectors,<br />
both in Japan and overseas, from commodity chemicals such as petrochemical<br />
feedstocks and plastics, inorganic chemicals such as sulfur and<br />
salt, and fatty acids and other specialty chemicals, to advanced materials<br />
and biotech-related chemicals. By giving priority to initiatives in China particularly<br />
in electronic materials, basic chemicals, and plastics, the division<br />
is seeking to provide multifunctional, value-added business operations.<br />
• Exploration and production (E&P) of energy resources<br />
•Trading, marketing and retail businesses for petroleum products, crude oil,<br />
LPG, natural gas, LNG and equipment for nuclear power plants<br />
•Provision of various services pertaining to the nuclear fuel cycle<br />
•Overseas metals and mineral resources development, including aluminum<br />
smelting and the development of mines for coal, non-ferrous metals and<br />
raw materials for steel production<br />
•Sale of raw materials for steel production (iron ore, coal, coke, anthracite,<br />
ferro alloys, steel scrap, etc.), thermal coal for power companies and general<br />
industry, non-ferrous metals such as copper, zinc, and aluminum, and<br />
precious metals<br />
•Manufacture and sale of non-ferrous metal products and materials for electronics<br />
Notes: 1. Segment performance throughout this report is based on business results for the year ended March 31, 2005. Information regarding business lines, products and services is as of April 2005.<br />
2. The total volume of trading transactions is calculated according to generally accepted accounting principles in Japan. This figure includes the total amount of transactions in which<br />
<strong>Marubeni</strong> and its consolidated subsidiaries acted in the capacity of selling contractor or agent.
2005 Results<br />
•Total volume of trading transactions:<br />
¥979,855 million<br />
• Gross trading profit: ¥71,312 million<br />
•Operating income: ¥9,515 million<br />
• Segment net income: ¥1,169 million<br />
•Segment assets: ¥398,517 million<br />
•Total volume of trading transactions:<br />
¥355,311 million<br />
• Gross trading profit: ¥25,174 million<br />
•Operating income: ¥5,154 million<br />
• Segment net income: ¥2,612 million<br />
•Segment assets: ¥119,807 million<br />
•Total volume of trading transactions:<br />
¥792,377 million<br />
• Gross trading profit: ¥46,612 million<br />
•Operating income: ¥13,857 million<br />
• Segment net income: ¥7,520 million<br />
•Segment assets: ¥317,678 million<br />
•Total volume of trading transactions:<br />
¥667,473 million<br />
• Gross trading profit: ¥26,857 million<br />
•Operating income: ¥5,095 million<br />
• Segment net income: ¥4,513 million<br />
•Segment assets: ¥167,157 million<br />
•Total volume of trading transactions:<br />
¥1,773,951 million<br />
• Gross trading profit: ¥42,132 million<br />
•Operating income: ¥23,648 million<br />
• Segment net income: ¥15,888 million<br />
•Segment assets: ¥390,939 million<br />
•Total volume of trading transactions:<br />
¥609,274 million<br />
• Gross trading profit: ¥15,709 million<br />
•Operating income: ¥7,965 million<br />
• Segment net income: ¥9,813 million<br />
•Segment assets: ¥195,110 million<br />
Highlights<br />
<strong>Marubeni</strong> Corporation 2005<br />
•<strong>Marubeni</strong> forged capital ties with The Daiei, Inc., Japan’s largest retailer, and will play an important role in the<br />
company’s management as a business sponsor.<br />
•<strong>Marubeni</strong> expanded its turnover for grain to become the largest trader of wheat, barley and corn among<br />
Japanese trading companies, and has become one of Japan’s top soybean traders.<br />
•Rangers Valley Cattle Station Pty. Ltd., our subsidiary company in Australia, acquired JAS (Japan Agricultural<br />
Standard) certification for its traceability program for beef products, accredited by the Ministry of Agriculture,<br />
Forestry and Fisheries of Japan (MAFF).<br />
• The division pursued a brand licensing business as part of its downstream strategy. Activities included the<br />
introduction of the French sports brand Oxbow and the U.S. apparel and sundries brand OshKosh to Japan<br />
through licensing agreements and expansion of the established bag brand GLOBE-TROTTER in Japan through<br />
the opening of directly managed shops in Aoyama and Marunouchi, Tokyo.<br />
• The division also moved into a new mobile e-commerce business through an alliance with ZAPPALLAS, Inc.<br />
The arrangement involves an outlet website operated by ZAPPALLAS through which consumers can purchase<br />
fashion brands via mobile phones.<br />
* ZAPPALLAS has top-notch capabilities in the development of content for mobile phones.<br />
•In January 2005, WA Plantation Resources Pty Ltd. (WAPRES), based in Western Australia, acquired The<br />
Australian Forestry Standard, an official forestry management certification, as part of its commitment to<br />
conducting environmentally sound corporate activities.<br />
• In December 2004, the division established Nantong Jiehong Recycle Corporation in Nantong, China, as a<br />
processing and sales subsidiary specializing in wastepaper. The company is striving to capture synergies in<br />
this business between the U.S., China and Japan.<br />
•Precision Japan Ltd. commenced sales of imported fitness equipment in January 2005. Prospective sales<br />
targets include nursing care facilities, a sector where demand is projected to grow, in addition to fitness clubs.<br />
• The division invested approximately ¥2 billion, corresponding to an equity stake of 10%, in Beijing BOE<br />
Investment & Development Co., Ltd. to strengthen alliances with BOE Technology Group Co., Ltd., a prominent<br />
Chinese IT enterprise. This move concluded with the signing of a cooperative agreement for strategic<br />
partnership. In the priority Chinese market, the division also handled more products in electronic materials,<br />
one of its focus fields.<br />
• The division teamed up with Tosoh Corporation, Asia’s largest maker of electrolysis and vinyl chloride monomer,<br />
to invest in vinyl chloride resin manufacturing operations in Changzhou and Guangzhou, China. This investment<br />
has supported expanded sales volume of vinyl chloride resin and vinyl chloride monomer in China.<br />
• The division’s crude oil and gas production operations overseas continued to perform favorably in such regions<br />
as the U.K., U.S., India, and Qatar, as did its ongoing LNG Project. Several measures were taken to further<br />
expand the earnings base, including the decision to acquire additional interests in oil and gas fields in U.K.<br />
waters in the North Sea.<br />
• The division’s joint venture with local Chinese partners for the sale of imported LPG in China maintained its<br />
leading share, once again accounting for nearly 20% of China’s imported LPG market in 2004.<br />
• In petroleum trading, the division saw brisk performance. Particularly in petrochemical feedstock trading, the division<br />
handled approximately 25% of Japan’s naphtha imports and played an important role in the related industry.<br />
•Amid escalating copper prices, the Los Pelambres copper mine in Chile contributed substantially to earnings with an<br />
annual production capacity of 800,000 metric tons.<br />
• The division concluded a strategic cooperative agreement with Sinosteel Corporation in March 2005. Under this agreement,<br />
both parties will work jointly to broaden the trade of raw materials for steel production and develop mineral resources.<br />
•In electronic materials, preparations are under way for the start of production at Shenzhen KTM Glass Substrates Co., Ltd.<br />
(KTM). A joint venture in Shenzhen Province, China between the division, Toyo Kohan Co., Ltd. and Shenzhen Kaifa Magnetic<br />
Recording Co., Ltd. (KAIFA), KTM is preparing to manufacture glass substrates used in hard disk drives starting 2005.<br />
•<strong>Marubeni</strong> Metals Corporation commenced sales of LED chips produced by Lumileds Lighting, LLC following its selection<br />
as the sole sales agent in Japan for these products.<br />
22 / 23
At a Glance<br />
Segment<br />
Transportation<br />
Machinery* 3<br />
Industrial Machinery<br />
& Information<br />
Business* 3<br />
Plant, Power &<br />
Infrastructure<br />
Projects* 3<br />
Development &<br />
Construction<br />
Finance & Logistics<br />
Business<br />
Segment Trading Segment Assets<br />
Transactions as as Percentage of Total<br />
Percentage of Total<br />
8.8% 6.9%<br />
5.7% 5.4%<br />
8.4% 15.3%<br />
2.5% 7.5%<br />
0.3% 3.1%<br />
Main Products and Services<br />
• The division mainly handles transportation-related equipment, including<br />
aircraft, aero engines, helicopters, defence systems, passenger automobiles,<br />
trucks, construction and mining equipment, agricultural equipment,<br />
marine vessels, and ship machinery.<br />
• The business model of the division is mainly commodity trade, including<br />
export and wholesale and retail business overseas. The division also offers<br />
a broad range of project solutions, including investment, sales financing,<br />
leasing, trade brokerage and assistance to overseas manufacturing.<br />
• The provision of telecommunication infrastructure and solutions services, export<br />
and arrangement of third-country transactions involving telecommunications<br />
equipment, development of broadcasting and telecommunications<br />
businesses, wholesaling of PC-related equipment, and retail sales of mobile<br />
communication-related products<br />
•Import and export of production and industrial machinery used in the fields of automobile<br />
manufacturing, pulp and papermaking, printing, nanotechnology and hi-tech,<br />
consumer industries, environmental systems, healthcare and textile industries<br />
•Integration of public security systems and the development of RFID<br />
•Development and operation of a variety of social capital and infrastructure schemes<br />
such as power plants as an Independent Power Producer (IPP), and water supply<br />
and sewerage systems<br />
• Engineering, procurement and construction (EPC) services for power projects,<br />
railway and transport projects, and environment infrastructure projects covering<br />
water and sewerage, and waste management<br />
• Full-line services for plant projects in the oil and gas, petrochemicals, metal resources,<br />
steel and environment sectors—from EPC services to total coordination<br />
covering project development, financing, logistics, and operation and maintenance<br />
•Property development, focused mainly on condominium development<br />
in Japan<br />
•Housing development projects in overseas markets using domestically<br />
acquired expertise.<br />
•Rental, subleasing, brokerage and development of commercial property<br />
in Japan; asset and property management pertaining to private real estate<br />
funds and investment trusts<br />
• Funds and financing service business<br />
•Trading of financial products<br />
• Forwarding business, third-party logistics (3PL) and logistics consulting businesses,<br />
and container terminal business<br />
•Insurance agency and brokerage<br />
•Temporary staffing service and advertising agency<br />
Notes: 1. Segment performance throughout this report is based on business results for the year ended March 31, 2005. Information regarding business lines, products and services is as of April 2005.<br />
2. The total volume of trading transactions is calculated according to generally accepted accounting principles in Japan. This figure includes the total amount of transactions in which<br />
<strong>Marubeni</strong> and its consolidated subsidiaries acted in the capacity of selling contractor or agent.<br />
3. Due to a business division realignment, the above figures are preliminary.
2005 Results<br />
•Total volume of trading transactions:<br />
¥700,400 million<br />
• Gross trading profit: ¥51,673 million<br />
•Operating income: ¥14,481 million<br />
• Segment net income: ¥9,184 million<br />
•Segment assets: ¥290,782 million<br />
•Total volume of trading transactions:<br />
¥455,800 million<br />
• Gross trading profit: ¥36,718 million<br />
•Operating loss: ¥3,297 million<br />
• Segment net loss:¥14,827 million<br />
•Segment assets: ¥228,563 million<br />
•Total volume of trading transactions:<br />
¥666,500 million<br />
• Gross trading profit: ¥28,313 million<br />
•Operating loss: ¥505 million<br />
• Segment net loss: ¥12,027 million<br />
•Segment assets: ¥643,435 million<br />
•Total volume of trading transactions:<br />
¥196,844 million<br />
• Gross trading profit: ¥27,530 million<br />
•Operating income: ¥9,121 million<br />
• Segment net loss: ¥11,362 million<br />
•Segment assets: ¥317,692 million<br />
•Total volume of trading transactions:<br />
¥21,313 million<br />
• Gross trading profit: ¥5,785 million<br />
•Operating loss: ¥518 million<br />
• Segment net income: ¥4,047 million<br />
•Segment assets: ¥128,760 million<br />
Highlights<br />
<strong>Marubeni</strong> Corporation 2005 24 / 25<br />
•As an import agent, the division realized an order for Trent 1000 aircraft engines, being newly developed by<br />
Rolls-Royce plc of the United Kingdom, from a major Japanese airline.<br />
• The division delivered a search and rescue jet aircraft manufactured by Gulfstream Aerospace Corporation of<br />
the U.S. to Japan Coast Guard.<br />
• The division sold passenger automobiles and trucks totaling 85,000 units overseas.<br />
• The division delivered four large chemical product carriers (two 50,000-ton vessels and two 70,000-ton vessels)<br />
to the Formosa Group, a major chemical-products manufacturer in Taiwan.<br />
• Received an order for an automated mail sorting system from the Brazilian Post Office<br />
•Concluded an agreement with U.S.-based Symbol Technologies, Inc., for exclusive sales rights to UHF-band RFID<br />
products in Japan; delivered an RFID system for baggage management to the Airport Authority in Hong Kong<br />
•Recorded brisk sales of enterprise IP networks and strong sales in the optical cable network business conducted<br />
through the Vectant Group<br />
•Delivered an automobile engine manufacturing line to Australia and a transmission manufacturing line to Mexico<br />
•Delivered electric power generation equipment and a black-liquor recovery boiler facility, the largest in Japan, to<br />
the plant of a domestic paper maker<br />
•Awarded 20-year BOO (build, own and operate) rights for the Taweelah B power and water desalination project in the<br />
Emirate of Abu Dhabi, UAE (Total project cost of $3 billion, the world’s largest in monetary terms)<br />
• Entered into EPC service contracts for a coal-fired power plant in Indonesia, a hydro power plant in India and a<br />
transmission plant in Qatar<br />
•Initiated a domestic wind-power project in Ikata, Ehime Prefecture, Japan<br />
•Contracted for the supply of diesel electric railcars and Light Rail Vehicles to Iran (120 units each), and the supply of<br />
tilting rolling stock to Taiwan (48 units)<br />
•Signed a substantial syndicated loan agreement for the development of an offshore oil field and an EPC service<br />
contract for a steel plant, both in Brazil<br />
• Sales in the key area of domestic condominium complexes were strong. In the Tokyo Metropolitan Area, sales<br />
of upscale buildings in exclusive areas were especially brisk, as were sales of highly convenient condominium<br />
complexes adjacent to suburban railway hub stations. In the Kinki region, high-rise condominium complexes in<br />
the central areas of Osaka recorded particularly strong unit sales.<br />
•Overseas, sales of residential housing units under construction in Shanghai remained buoyant, with approximately<br />
800 units sold during the year (Phoenix City).<br />
•United Urban Investment Corporation, an investment company formed by real estate investment trust management<br />
affiliate Japan REIT Advisors Co., Ltd., carried out a second round of funding through a subscription<br />
in December 2004, thereby expanding its assets.<br />
• In finance, the division realized significant returns from selling portfolio companies such as Yayoi Co., Ltd.<br />
from the fund <strong>Marubeni</strong> participates in as an originator and operator. It also took part in the launch of a new<br />
buyout fund (MBI 3 rd fund), and successfully completed fundraising with total commitments of ¥46.5 billion,<br />
one of the largest sums in the Japanese private equity market. Gaining a reputation in the field, the division is<br />
expanding activities in the venture capital area, and its subsidiary newly formed a venture capital fund, receiving<br />
a monetary commitment from the Tokyo Metropolitan Government.<br />
•In logistics, the division established Logipartners Inc. to further develop 3PL operations in Japan.<br />
• In insurance, the division conducted the purchase of insurance commercial rights for companies listed on the<br />
First Section of the Tokyo Stock Exchange, and took other steps to expand its operating base.
Strategy by Business Segment<br />
Strategy by Business Segment<br />
Agri-Marine Products Division<br />
✔ Leveraging strengths in raw ingredients<br />
procurement to optimal effect<br />
During the past fiscal year, the division’s consolidated net income declined as<br />
we liquidated marine product-related affiliates and took other measures that<br />
led to the booking of one-time losses. Now that an end to actions to deal with<br />
problematic projects is in sight, the conditions are ripe for a sharp recovery in<br />
performance beginning in the current fiscal year. By leveraging fully the<br />
division’s dominant industry position in the procurement of raw ingredients,<br />
we plan to promote product development and its efficient distribution<br />
that meet consumer needs, as we strive to establish a value chain<br />
from raw ingredients procurement to end product supply.<br />
Division Strategies and Strengths<br />
Tetsuro Sakamoto<br />
Corporate Vice President, COO<br />
<strong>Marubeni</strong> has traditionally maintained a strong presence in<br />
grain trading. Turnover in wheat and corn is the highest of any<br />
general trading company, and <strong>Marubeni</strong>’s record in soybean<br />
trading also ranks it near the top in this area. Grains are a<br />
fundamental ingredient for the food industry, making stable<br />
supplies all the more important. The division’s in-house procurement<br />
function includes Columbia Grain International, Inc.,<br />
(CGII), one of the largest grain procurement and export bases<br />
on the U.S. West Coast. At the same time, the division is also<br />
focusing on developing <strong>Marubeni</strong>’s grain procurement network<br />
by trading with some of the U.S.’ most prominent names in the<br />
field. Among its actions, the division has concluded a strategic<br />
alliance with major grain supplier Archer Daniels Midland Company<br />
(ADM) that covers the production, import and marketing<br />
of feed grains and oilseeds, and forged a business alliance with<br />
grain processor and food products giant General Mills, Inc. in<br />
order to expand its grain procurement network. In Japan, the<br />
division maintains a leading grain silo network, operates<br />
<strong>Marubeni</strong> Nisshin Feed Co., Ltd., the country’s leading privatesector<br />
feed compounding company, and is moving ahead with<br />
greater integration of distribution channels linking producing<br />
regions overseas to supply points in Japan.<br />
As Japan’s socioeconomic structure matures, the country’s<br />
food market is becoming increasingly consumer-oriented.<br />
<strong>Marubeni</strong> has positioned food retail distribution as a priority<br />
investment field, and is constructing a value chain by channeling<br />
feedback on consumer needs into upstream areas through<br />
initiatives targeting downstream sectors close to the consumer.<br />
In this vein, <strong>Marubeni</strong> previously entered capital alliances<br />
with The Maruetsu, Inc. and Tobu Store Co., Ltd., two<br />
leading supermarket operators in Japan’s Tokyo Metropolitan<br />
Area. In March 2005, <strong>Marubeni</strong> also developed a capital partnership<br />
with The Daiei, Inc. (Daiei), one of Japan’s largest<br />
supermarket chains, and will take part in management as<br />
Daiei’s corporate rehabilitation sponsor. The scope of this partnership<br />
with Daiei will span the entire <strong>Marubeni</strong> Group, and the<br />
Agri-Marine Products Division will play a central role. As it<br />
does, the division aims to move briskly to push forward management<br />
reforms at Daiei, achieve that company’s corporate<br />
rehabilitation goals, and boost its corporate value.
Business Topics<br />
Capital ties with Daiei and selection<br />
as business sponsor<br />
<strong>Marubeni</strong> has entered into a capital partnership with<br />
Japan’s top retailer, Daiei. With the support of the<br />
Industrial Revitalization Corporation of Japan (IRCJ),<br />
Daiei has begun to enact a corporate rehabilitation<br />
plan. <strong>Marubeni</strong>, along with investment firm Advantage<br />
Partners, Inc., was chosen as one of Daiei’s<br />
business sponsors. <strong>Marubeni</strong> will have a hand in<br />
Daiei’s management, and will take steps to rehabilitate<br />
the retailer and raise its corporate value.<br />
Increased trading volume for grain<br />
<strong>Marubeni</strong> is steadily expanding its grain procurement network in an effort to ensure reliable<br />
grain supplies. Turnover at CGII, a leading grain exporter operated by <strong>Marubeni</strong> in the U.S.<br />
state of Oregon, accounts for around 30% of all the wheat and barley exported from the<br />
U.S. West Coast. <strong>Marubeni</strong> has also inked alliances with several prominent companies, including<br />
major U.S. grain supplier ADM and prominent<br />
flour and food producer General Mills. In the<br />
fiscal year ended March 31, 2005, these initiatives<br />
helped rank <strong>Marubeni</strong> first among general<br />
trading companies in wheat, barley and corn turnover,<br />
as well as become one of Japan’s top soybean<br />
traders.<br />
Acquisition of JAS certification for traceability program<br />
for beef products<br />
<strong>Marubeni</strong>, with a view to ensuring food reliability and safety, is developing products in a<br />
way that ensures traceable product information, and is innovating its information trace-back<br />
system. As part of these efforts, Rangers Valley Cattle Station Pty. Ltd., a feedlot and<br />
wholly owned subsidiary company in Australia, acquired JAS (Japan Agricultural Standard)<br />
certification for a traceability program for beef<br />
products accredited by the Ministry of Agriculture,<br />
Forestry and Fisheries of Japan (MAFF).<br />
Under this program, Rangers Valley developed a<br />
trace-back system, and publishes all information,<br />
including any feed consumed or treatments<br />
administered, from the birth of its cattle to processed<br />
beef products.<br />
<strong>Marubeni</strong> Corporation 2005<br />
Segment Assets<br />
(At March 31)<br />
347,483 417,735<br />
’03 ’04 ’05<br />
(Millions of yen)<br />
Segment Net Income<br />
(Years ended March 31)<br />
7,066<br />
(Millions of yen)<br />
6,957<br />
398,517<br />
1,169<br />
’03 ’04 ’05<br />
Agri-Marine Products<br />
Division<br />
Cereals & Sugar Unit<br />
Grain & Feedstuff Unit<br />
Oilseeds, Fats & Oils Unit<br />
Beverage Unit<br />
Foods Merchandising Unit<br />
Foods Marketing Project Unit<br />
Farm Products Unit<br />
Meat Unit<br />
Seafood Unit<br />
Osaka Foodstuff Unit<br />
26 / 27
Strategy by Business Segment<br />
Textile Division<br />
✔<br />
Bolstering initiatives targeting everyday activities<br />
The past fiscal year saw the division reverse course to post higher trading<br />
transactions and consolidated net income, and come one step closer to a full<br />
recovery. Likewise, the fiscal year ending March 31, 2006 will be an important year<br />
for making a definitive leap forward in revitalizing the division. One advantage that<br />
<strong>Marubeni</strong>’s Textile Division has over other trading companies is an integrated<br />
value chain covering upstream through to downstream areas; this strength will<br />
continue to distinguish the division in the years ahead. By merging the expertise<br />
of outside specialists with <strong>Marubeni</strong>’s unique strengths, we hope to take the<br />
division beyond the traditional boundaries of the garment field to establish a<br />
presence in footwear, luggage and handbags, furnishings, sundries and other<br />
non-garment domains essential to daily life. In doing so, we will unfurl<br />
innovative ideas in a bid to establish new earnings streams.<br />
Hiroshi Koyabu<br />
Corporate Vice President, COO<br />
Division Strategies and Strengths<br />
Consumer tastes are getting increasingly diversified as a result<br />
of large shifts in the current market situation. To grow the<br />
business portfolio under these circumstances, the textile division<br />
aims to create new value by consolidating footholds in<br />
every consumer field and continually monitoring trends in<br />
consumer markets, from the materials to the products stage.<br />
<strong>Marubeni</strong> aims to strengthen its presence in these areas by<br />
improving its capabilities in information and distribution, product<br />
planning, and product development to expand and enhance<br />
its integrated wholesale function.<br />
Downstream strategies: To generate stronger growth in the<br />
apparel field in Japan, the division proceeded with brand<br />
marketing operations that saw it conclude licensing agreements<br />
for French sports brand Oxbow, U.S. apparel and<br />
sundries brand OshKosh, and U.S. outdoor, casual bag brand<br />
Overland Equipment. Other downstream brand marketing<br />
strategies included the opening of directly managed stores for<br />
the established U.K. bag brand GLOBE-TROTTER in London<br />
and Tokyo (Aoyama and Marunouchi). At the same time, the<br />
division sought to expand and enhance its development<br />
capabilities in downstream channels closer to the consumer<br />
market by leveraging its retail know-how and constructing<br />
mechanisms for directly assessing market needs.<br />
Stepped-up business investment: The division aggressively<br />
carried out business investment aimed at expanding its<br />
operating domain and at shoring up its earnings base. To facilitate<br />
this process, textile project and planning teams were set up<br />
in Tokyo and Osaka. Aimed at more than just expanding trade<br />
benefits and securing business profits, this proactive investment<br />
program is designed to enhance the division’s role as a comprehensive<br />
wholesaler and to expand its operating domain.<br />
Accelerated expansion into overseas markets: To construct<br />
a more integrated business system in China, from raw<br />
materials to finished products, the division merged Passport<br />
Fashion Company Limited’s office in China with <strong>Marubeni</strong><br />
Textile (Shanghai) Co., Ltd. (MTS), thereby inaugurating a new<br />
MTS. The division is also preparing to establish a sales company<br />
for Japanese brand garment goods. Additionally, eying the<br />
abolition of import quotas in the U.S. and Europe, the division<br />
aims to expand the garment goods business, particularly exports<br />
from third countries to Europe and the United States.<br />
In other developments, the division has positioned the<br />
ASEAN region as the next important market after China and is<br />
working to enhance related production and sales functions.
Business Topics<br />
Opening of directly managed shops<br />
for U.K. bag brand GLOBE-TROTTER<br />
Directly managed shops for the U.K. bag brand<br />
GLOBE-TROTTER were opened on main streets<br />
in London. In Japan, two domestic locations were<br />
opened in Tokyo, one in Aoyama and the other in<br />
Marunouchi. Established in 1897 with a product<br />
lineup comprising mostly travel bags, the GLOBE-<br />
TROTTER brand has gained a stature rivaling that<br />
of Louis Vuitton, boasting a client list that includes famous adventurers as well as the British<br />
Royal Air Force, the British Royal Navy, and the British Royal Family.<br />
Introduction of French sports brand<br />
Oxbow to Japan<br />
<strong>Marubeni</strong> concluded licensing contracts for<br />
apparel and sundries between Japanese merchants<br />
and Oxbow, a French sports brand built on<br />
surfing and snowboarding apparel. Oxbow’s head<br />
office is located in Bordeaux, a coastal region facing<br />
the Atlantic Ocean and a mecca for European<br />
surfing enthusiasts. Oxbow targets men and<br />
women 25 years of age and older with a brand<br />
image that appeals to those with highly active,<br />
sports-oriented lifestyles. The brand evokes a<br />
lifestyle epitomizing emotional fulfillment, freedom,<br />
and harmony with nature. Major sporting<br />
goods chain stores started including the sale in<br />
their product selections in autumn 2004.<br />
Launch of mobile phone-accessible site<br />
for sales of outlet products<br />
In an alliance with ZAPPALLAS, Inc., <strong>Marubeni</strong> inaugurated<br />
a mobile phone-accessible site for sales of outlet<br />
garments and sundries. This site combines<br />
ZAPPALLAS’ expertise in operating mobile phoneaccessible<br />
websites with <strong>Marubeni</strong>’s own skills in the<br />
supply of garments and sundries and its know-how in<br />
fashion operations, and represents the pursuit of a new<br />
kind of mobile e-commerce business.<br />
<strong>Marubeni</strong> Corporation 2005<br />
Segment Assets<br />
(At March 31)<br />
’03 ’04 ’05<br />
(Millions of yen)<br />
Segment Net Income<br />
(Years ended March 31)<br />
1,934<br />
123,868<br />
127,045<br />
(Millions of yen)<br />
1,753<br />
’03 ’04 ’05<br />
Textile Division<br />
Apparel Unit<br />
Apparel Retail Unit<br />
119,807<br />
2,612<br />
Utility Apparel Unit<br />
Textile Raw Material Unit<br />
Textile Unit<br />
Industrial Material &<br />
Interiorfurnishings Unit<br />
28 / 29
Strategy by Business Segment<br />
Forest Products &<br />
General Merchandise Division<br />
✔<br />
A dominant presence backed by a positive cycle<br />
The division’s value chain, encompassing upstream fields to those<br />
downstream, allows each operating company along the chain to<br />
accentuate its presence. In fact, our comprehensive capability is<br />
giving rise to a true positive cycle for the division. Building on<br />
these strengths, we are focusing attention on wood chips, pulp,<br />
and wastepaper, while sufficiently appealing to our trading<br />
company functions in Asia, and China in particular. Specifically,<br />
the division is focusing on importing finished products from<br />
China, while supplying China with raw materials and expanding<br />
operations within the country.<br />
Division Strategies and Strengths<br />
Pulp and paper: In this field, one of the division’s strengths is<br />
its ability to organically link business operations and trading<br />
throughout the entire cycle surrounding the use of paper and<br />
paperboard made from wood chips, pulp and wastepaper, to<br />
the reuse of wastepaper resources.<br />
Regarding wood chips, the division has a well-balanced mix<br />
of regional supply sources including South Africa, South America<br />
and Western Australia, enabling it to claim a leading share of<br />
Japan’s wood chip imports. The <strong>Marubeni</strong> Group has two pulp<br />
producers—Daishowa-<strong>Marubeni</strong> International Ltd., located in<br />
Canada, and P.T. Tanjungenim Lestari, based in Indonesia—that<br />
together have a remarkable production capacity of 1.25 million<br />
tons of pulp per year. Synergies from the handling of products<br />
from not only these two suppliers but other companies, makes<br />
for another advantage in this field.<br />
In printing paper, <strong>Marubeni</strong> is the only Sogo Shosha (trading<br />
company) fully engaged in this field. The division leverages a<br />
unique sales strategy underpinned by its three different supply<br />
sources: major domestic paper manufacturers, imported paper,<br />
and paper manufacturers from the <strong>Marubeni</strong> Group. The division<br />
also operates its own network of sales agents, logistics<br />
Toshinori Umezawa<br />
Corporate Vice President, COO<br />
companies, and online sales companies. Unparalleled initiatives<br />
in handling printing paper are a key element of <strong>Marubeni</strong>’s comprehensive<br />
capabilities spanning all aspects of pulp and paper.<br />
General merchandise: In this field, the division handles a variety<br />
of different products, including rubber products, natural rubber,<br />
leather, footwear, sporting goods, timber and plywood. The division<br />
identifies those commercial goods and business formats<br />
best able to exemplify the company’s strengths, while striving<br />
to maximize PATRAC, <strong>Marubeni</strong>’s key risk-return indicator.<br />
In housing and construction materials, the division seeks to<br />
grow earnings by securing increasingly vital wood resources<br />
upstream, while reinforcing sales through <strong>Marubeni</strong> Building<br />
Materials Co., Ltd. in downstream areas.<br />
In footwear, the division has the sourcing functions of<br />
<strong>Marubeni</strong> Footwear Resources Limited (MFR), OEM transactions<br />
and the wholesale function of <strong>Marubeni</strong> Footwear Inc.<br />
(MFI), conducted by MFR. These operations from upstream<br />
to downstream areas enable the division to access operations<br />
at a number of different stages, another of <strong>Marubeni</strong>’s<br />
strong points. Looking ahead, the division intends to<br />
upgrade MFR’s sourcing functions and MFI’s proposaloriented<br />
planning capabilities.
Business Topics<br />
Daishowa-<strong>Marubeni</strong> International Ltd.<br />
(DMI)<br />
DMI is <strong>Marubeni</strong>’s joint venture with Nippon Paper<br />
Industries Co., Ltd. As a pulp manufacturer, the<br />
company has two production sites in Canada at<br />
Peace River and Cariboo. DMI has a total production<br />
capacity of around 800,000 metric tons per year, of which <strong>Marubeni</strong> handles 670,000 metric<br />
tons. Both sites possess unparalleled competitive advantages in the North American market,<br />
including abundant forest resources and technology honed over many years. On the quality<br />
front, Peace River and Cariboo have been widely praised for their 100% elemental chlorinefree<br />
(ECF) products. Steps to lower production costs and other measures to sharpen its competitive<br />
edge will be a focus for DMI as it strives to build a stable earnings structure.<br />
Koa Kogyo Co., Ltd.<br />
Based in the city of Fuji (Shizuoka Prefecture,<br />
Japan), Koa Kogyo Co., Ltd. is a supplier of liner<br />
board, medium board, duplex board and magazine<br />
paper, with total paper production and sales volume<br />
of about 550,000 metric tons per year. Besides the<br />
logistical advantage of proximity to one of the<br />
world’s largest markets, Koa Kogyo generates all<br />
of its own electricity in-house, and leverages this<br />
cost competitiveness to maintain a high earnings structure. Koa Kogyo is now working to<br />
broaden the sale of high-added-value products and develop new products. At the same<br />
time, the company uses wastepaper for virtually 100% of its raw materials, in the hope of<br />
contributing to the formation of a recycling-oriented society as an eco-friendly enterprise.<br />
Group initiatives in natural rubber<br />
The <strong>Marubeni</strong> Group’s strength in natural rubber stems from handling products in all stages,<br />
from upstream to downstream areas. This enables the Group to use the futures market to<br />
manage the risk of spot trades while generating profits. UNIMAC Rubber Company Ltd. and<br />
Thaimac STR Co., Ltd., two subsidiaries in<br />
Thailand, operate plants with a total production<br />
capacity of 100,000 metric tons per<br />
year. <strong>Marubeni</strong> tops the domestic ranking<br />
by handling just over 300,000 metric tons<br />
of natural rubber each year. In a drive to<br />
further expand its global share, <strong>Marubeni</strong> is<br />
now reinforcing operations at <strong>Marubeni</strong><br />
International Commodities (Singapore) Pte.<br />
Ltd., a sales subsidiary based in Singapore,<br />
a purchasing hub for natural rubber.<br />
<strong>Marubeni</strong> Corporation 2005<br />
Segment Assets<br />
(At March 31)<br />
’03 ’04 ’05<br />
(Millions of yen)<br />
Segment Net Income<br />
(Years ended March 31)<br />
4,868<br />
(Millions of yen)<br />
299,009<br />
315,720<br />
317,678<br />
6,253<br />
7,520<br />
’03 ’04 ’05<br />
Forest Products & General<br />
Merchandise Division<br />
Rubber Unit<br />
Hide, Leather & Footwear Unit<br />
General Merchandise & New<br />
Products Unit<br />
Housing & Construction<br />
Materials Unit<br />
Leisure Business Unit<br />
Pulp Unit<br />
Wood Chip Unit<br />
Printing & Publication Paper Unit<br />
Packaging Paper & Board Unit<br />
Osaka Pulp, Paper &<br />
Paperboard Unit<br />
Musi Pulp Project Unit<br />
30 / 31
Strategy by Business Segment<br />
Chemicals Division<br />
✔<br />
Taking advantage of strengths in China and other parts of Asia<br />
Due to the breadth of products handled by the Chemicals Division, each member<br />
of the division must act independently and decisively. This aspect of operations<br />
has helped the division to nurture talented personnel who can root out the<br />
mechanisms for conducting business in markets in virtually every corner of the<br />
globe, and comprises one of its strengths. This strength has been instrumental<br />
to the division’s ability to establish a borderless earnings structure. Having<br />
identified China and the whole of Asia as a priority region, we will<br />
take steps to provide manufacturers with our general trading<br />
company functions, such as information gathering and networks,<br />
as well as outstanding human resources, in a drive to<br />
maximize our earnings potential.<br />
Ko Mori<br />
Corporate Senior Vice President, COO<br />
Division Strategies and Strengths<br />
The division focuses mainly on vinyl alkali and basic chemical<br />
products, including olefin and synthetic fiber materials, which<br />
are representative of markets where the division can exert its<br />
strengths and that offer high margins. Centered on advanced<br />
technology fields, the division also focuses on electronic materials<br />
and other markets with strong growth potential.<br />
In basic chemical products, <strong>Marubeni</strong> ranks as one of the<br />
industry’s top groups in terms of transactions in Asia involving<br />
ethylene and chemical synthetic fiber, boasting top shares of<br />
the markets for polyvinyl chloride (PVC), vinyl chloride monomer<br />
(VCM), and caustic soda. In these fields, where <strong>Marubeni</strong><br />
has built considerable competitive advantages, the division<br />
participates in local production projects with prominent Japanese<br />
makers that have formidable technological capabilities,<br />
and through these activities, it has acquired the right to supply<br />
raw materials and sell finished products, thereby expanding<br />
transaction volume, establishing a strong market presence, and<br />
boosting earnings capabilities.<br />
In the field of electronic materials, <strong>Marubeni</strong> has constructed<br />
an even stronger system for executing transactions by<br />
investing in BOE Technology Group Co., Ltd., a major IT group<br />
in China. To foster a comprehensive alliance with the group,<br />
<strong>Marubeni</strong> concluded a strategic partnership under a cooperative<br />
agreement that enables it to procure key materials for one<br />
of the group’s core businesses, LCD panels. This agreement<br />
also puts <strong>Marubeni</strong> in a position to promote the localization of<br />
associated peripheral businesses.<br />
In addition, having positioned China as a key market,<br />
<strong>Marubeni</strong> is working to expand transactions by establishing a<br />
sales system within China that taps the full capabilities of<br />
<strong>Marubeni</strong> Information Technology (Shanghai) Co., Ltd., an<br />
electronic materials venture, <strong>Marubeni</strong> Chemicals (Shanghai)<br />
Co., Ltd., which handles olefins and synthetic fiber materials,<br />
and <strong>Marubeni</strong> Plax China Ltd., which specializes in the sale of<br />
chemical products, particularly synthetic resin. In PVC resin,<br />
<strong>Marubeni</strong> has joined forces with Tosoh Corporation, Asia’s<br />
largest maker of electrolysis and VCM, to invest in Changzhou<br />
Honesty Resin Co., Ltd. and Tosoh Guangzhou Chemical Industries,<br />
Inc. <strong>Marubeni</strong>’s business objective here is trade, and this<br />
investment will help to expand PVC resin and VCM sales<br />
volume in China.
Business Topics<br />
Ethylene carriers<br />
Among trading companies,<br />
<strong>Marubeni</strong> handles one of the<br />
industry’s largest volumes of olefins<br />
and synthetic fiber materials,<br />
both used as petrochemical feedstock.<br />
Particularly in terms of<br />
trading volume for ethylene, the<br />
Company boasts the industry’s<br />
leading share and maintains its<br />
own fleet of specialized ethylene<br />
carriers, assets that help underscore<br />
its competitive advantages in this area and expand trading volume. In synthetic fiber<br />
materials, <strong>Marubeni</strong> is working to further enhance initiatives in partnership with prominent<br />
suppliers. Meanwhile, with the establishment of <strong>Marubeni</strong> Chemicals (Shanghai) in China,<br />
the Company has put a comprehensive and well-defined sales structure in place by leveraging<br />
ties with the head office in Japan.<br />
China’s PVC market<br />
China represents an enormous market for PVC<br />
resin. Placing the highest priority on this market,<br />
<strong>Marubeni</strong> has focused efforts on the sale<br />
of vinyl chloride resin and VCM, a key material<br />
for this product. In the fiscal year ended March<br />
31, 2005, the Company teamed up with<br />
Tosoh, Asia’s largest maker of electrolysis,<br />
VCM and vinyl chloride resin, to jointly invest in Changzhou Honesty Resin Co., Ltd. and Tosoh<br />
Guangzhou Chemical Industries, Inc. This investment is expected to drive expansion in sales<br />
volume of these materials in China.<br />
Partnership with BOE Technology Group<br />
<strong>Marubeni</strong> has invested in Beijing BOE Investment & Development Co., Ltd., the holding<br />
company of the BOE Technology Group Co., Ltd., a prominent Chinese IT enterprise. By the<br />
close of 2004, BOE-OT Optoelectronics Technology Co., Ltd., a company established by the<br />
BOE Technology Group Co., Ltd., had set up<br />
a fifth-generation production line and begun<br />
full-scale shipments of PC monitor materials.<br />
Tying into this and other BOE Technology<br />
Group strategies, <strong>Marubeni</strong> is focusing on<br />
the supply of color filters, glass substrates<br />
and other LCD-related materials in the key<br />
electronic materials field, in addition to<br />
materials for conventional CRT displays.<br />
<strong>Marubeni</strong> Corporation 2005<br />
Segment Assets<br />
(At March 31)<br />
147,420<br />
(Millions of yen)<br />
Segment Net Income<br />
(Years ended March 31)<br />
(Millions of yen)<br />
147,118<br />
167,157<br />
’03 ’04 ’05<br />
2,063 3,326 4,513<br />
’03 ’04 ’05<br />
Chemicals Division<br />
Electronic Materials Unit<br />
Basic Chemicals Unit<br />
Vinyl Alkali Unit<br />
Inorganic & Agricultural<br />
Chemicals Unit<br />
Specialty Chemicals Unit<br />
Osaka Chemicals Unit<br />
Chemix Project Unit<br />
Plastics Planning Unit<br />
Agrovista Project Unit<br />
32 / 33
Strategy by Business Segment<br />
Energy Division<br />
✔<br />
Balancing three core businesses<br />
The division optimized its business portfolio by prioritizing the allocation<br />
of management resources to strategic fields. The division’s sharply higher<br />
earnings in the past fiscal year were the cumulative outcome of these<br />
initiatives. The firm fundamentals now in place at the division will play<br />
a key role in the successful completion of the “V” PLAN. At the same<br />
time, in order to keep its status as one of <strong>Marubeni</strong>’s core divisions over<br />
the next five to ten years, we have positioned natural resource exploration<br />
and production business as our highest priority field, while we will<br />
also strengthen our trading and marketing capabilities. Looking ahead,<br />
we plan to stimulate growth by maintaining an optimal balance among<br />
these three core businesses.<br />
Koichi Mochizuki<br />
Corporate Senior Vice President, COO<br />
Division Strategies and Strengths<br />
The Energy Division operates three core businesses: energy<br />
resource exploration and production, trading, and marketing<br />
and retailing.<br />
In energy resource exploration and production, the division<br />
has continued to broaden its business scope in recent years.<br />
Production was steady at existing oil and gas projects. The<br />
division has already achieved a total production volume of more<br />
than 30,000 boed (barrels of oil equivalent per day). Looking<br />
forward, the division will continue to actively invest in promising<br />
new projects in a drive to further expand its earnings base. In<br />
LNG, the division’s project in Qatar is proceeding favorably. In<br />
Sakhalin, Russia, where the division takes part in the Sakhalin I<br />
Project through investment in Sakhalin Oil and Gas Development<br />
Co., Ltd., good progress is being made on the construction of<br />
related onshore facilities and production well drilling in preparation<br />
for full-scale crude oil production in early 2006.<br />
In trading, which has long been <strong>Marubeni</strong>’s core field, the<br />
division is primarily engaged in transactions including crude oil,<br />
gasoline, kerosene, diesel fuel and other petroleum products,<br />
mainly through its headquarters in Japan and principal subsidiaries<br />
in the U.S. and Singapore. The division has particularly<br />
distinguished itself in the trade of naphtha, accounting for 25%<br />
of annual imports to Japan. To supply competitive petroleum<br />
products, the division will leverage risk management functions<br />
backed by years of business experience and talented personnel,<br />
utilize futures trading, processing at refineries and various other<br />
techniques, and optimize ties between branches and Group<br />
companies in its worldwide business network.<br />
In the fields of marketing and retailing, the division has a<br />
diverse portfolio of businesses, and delivers distinctive, valueadded<br />
services to each of these business sectors. In particular,<br />
the division is involved in sales of imported LPG in China’s<br />
Guangdong Province, where demand for imported LPG is greatest<br />
in the country, through a joint venture with local partners. In<br />
Japan, the division conducts nationwide retailing operations,<br />
selling petroleum products and LPG via a distribution infrastructure<br />
network comprising storage terminals, filling stations and<br />
other distribution facilities. In terms of critical fuels for power<br />
generation, the division stands apart by handling a diverse lineup<br />
of products, from LNG and nuclear fuel to petroleum products.<br />
Where new business is concerned, the Energy Division conducts<br />
feasibility studies for the commercialization of innovative<br />
fuels with lower environmental load, has launched a business in<br />
trading greenhouse gas emission quotas and takes other creative<br />
initiatives amid a fast-changing business environment.
Business Topics<br />
Purchase of oil and gas field assets in<br />
the North Sea<br />
In October 2004, <strong>Marubeni</strong> purchased all shares of<br />
Energy North Sea Holdings Ltd., making the company<br />
a subsidiary. Energy North Sea Holdings owns<br />
a number of oil and gas field assets in U.K. waters<br />
in the North Sea, including mining areas where production<br />
is ongoing. This purchase was intended to<br />
further expand <strong>Marubeni</strong>’s earnings base in this<br />
region, where it already possesses other interests.<br />
Moving forward, the company will seek greater<br />
growth by prioritizing the channeling of management<br />
resources into operations in this field.<br />
Qatargas LNG Project<br />
<strong>Marubeni</strong> is a partner in the Qatargas LNG<br />
Project, which saw its first LNG delivery in<br />
1997. Since then, production and sales<br />
operations, largely targeting Japan and certain<br />
European markets, have steadily grown,<br />
with long-term contracts effective until 2021<br />
with 5 power companies and 3 gas companies<br />
in Japan. Moreover, the upgrade of<br />
facilities onsite is expected to increase the annual production level to approximately 9.7<br />
million metric tons. The sales volume will be boosted accordingly.<br />
Sales of imported LPG in China<br />
In 1995, <strong>Marubeni</strong> formed Shenzhen Sino-<br />
Benny LPG Co., Ltd. with local Chinese partners<br />
in China’s Guangdong Province. This<br />
was followed by construction of an import<br />
terminal for refrigerated LPG with a storage<br />
capacity of 80,000 metric tons and equipped<br />
with a berth large enough to accommodate<br />
refrigerated LPG tankers. In 2004, Shenzhen<br />
Sino-Benny LPG sold approximately 1.3 million metric tons of imported LPG, accounting for<br />
nearly 20% of China’s imported LPG market. Shenzhen Sino-Benny LPG’s supply stability,<br />
made possible by its use of large terminals, is highly commended by both local governmental<br />
organizations and the LPG industry.<br />
<strong>Marubeni</strong> Corporation 2005<br />
Segment Assets<br />
(At March 31)<br />
348,338<br />
’03 ’04 ’05<br />
(Millions of yen)<br />
Segment Net Income<br />
(Years ended March 31)<br />
6,556 10,113<br />
’03 ’04 ’05<br />
(Millions of yen)<br />
319,584 390,939<br />
Energy Division<br />
15,888<br />
Oil and Gas E & P Unit<br />
Sakhalin Project Unit<br />
LNG Unit<br />
LPG Unit<br />
Energy Trading Unit<br />
Petroleum Products Unit<br />
Nuclear Power Unit<br />
MIECO Unit<br />
<strong>Marubeni</strong> Energy Unit<br />
<strong>Marubeni</strong> Ennex Unit<br />
34 / 35
Strategy by Business Segment<br />
Metals & Mineral Resources Division<br />
✔<br />
Building a business base to weather market changes<br />
During the past three years, efforts to bolster the division structurally<br />
through organizational enhancements and tackling<br />
problem assets have paid off. Today, the division possesses an<br />
improved financial position and mostly highly productive assets,<br />
and is prepared to assume a more aggressive posture. Moving<br />
forward, as we invest in increasingly larger-scale projects, we<br />
plan to sustain project valuation and invest in projects where<br />
risks can be more easily managed. The goal is to create an<br />
earnings structure that can steadily generate profits even under<br />
adverse market conditions.<br />
Division Strategies and Strengths<br />
Through the development of ore and coal mines, and participation<br />
in smelting projects overseas, the Metals & Mineral<br />
Resources Division secures its own supply of resources and<br />
works to boost the profitability of its businesses. At the same<br />
time, the division engages in trading and is involved in downstream<br />
businesses that harness metal resources, notably electronic<br />
materials. In other words, the division aims to build a<br />
vertically integrated value chain covering every stage, from<br />
upstream to downstream areas, and links its extensive lineup of<br />
products, as well as expertise, experience and a wide range of<br />
trading house functions to maximize earnings.<br />
In the fiscal year ended March 31, 2005, China’s powerful<br />
economic growth fueled tight supply and demand dynamics in<br />
the market that drove prices higher for many products, including<br />
iron ore, coal, ferro alloys, steel scrap and other raw materials for<br />
steel production, as well as copper, aluminum and other nonferrous<br />
metals. In this climate, the division pushed forward in<br />
upstream areas with resource projects and these efforts paid off<br />
in the form of higher profitability. From a medium- to long-term<br />
perspective, these projects will steadily bear fruit.<br />
The division’s trading company functions, backed by its<br />
wealth of experience and information capabilities, also assume a<br />
Tadatsugu Nakajima<br />
Corporate Senior Vice President, COO<br />
prominent role as it strives to deliver products to customers in<br />
the volumes they need, and respond rapidly to fluctuations in<br />
product prices. Central to this is the division’s ability to supply its<br />
own resources through investments in resource development.<br />
In electronic materials, the division boasts the leading share<br />
of aluminum disks used in hard disk drives (HDDs). Capitalizing<br />
on the division’s product knowledge and sales expertise in the<br />
aluminum disk business, <strong>Marubeni</strong> decided in June 2004 to form<br />
a joint venture with Toyo Kohan Co., Ltd. and Shenzhen Kaifa<br />
Magnetic Recording Co., Ltd., a subsidiary of China Great Wall<br />
Computer Group Co for the manufacture and sale of glass substrates<br />
used in HDDs. This combined investment culminated in<br />
the establishment of Shenzhen KTM Glass Substrates Co., Ltd.<br />
in December 2004. This reflected the move to glass substrates<br />
from the aluminum disk manufacturing jointly conducted with<br />
Toyo Kohan in Malaysia. Demand for glass substrates is<br />
projected to grow sharply, particularly for use in notebook computers<br />
and portable audio devices with large storage capacity.<br />
The division is also taking steps to develop innovative materials<br />
and technologies into new businesses and commercial products,<br />
as illustrated by the nomination of its subsidiary, <strong>Marubeni</strong><br />
Metals Corporation, as the sole sales agent in Japan for LED<br />
chips produced by Lumileds Lighting, LLC of the United States.
Business Topics<br />
Operations at copper mining project in Chile<br />
<strong>Marubeni</strong> has an 8.75% equity stake in the Los<br />
Pelambres copper mining project in Chile through<br />
<strong>Marubeni</strong> LP Holding B.V. Since the start of production<br />
in November 1999, the project has provided a<br />
stable supply of 800,000 metric tons of copper<br />
concentrate per year to Japan and other markets in<br />
Asia and Europe. Mirroring conditions in the previous<br />
year, rising copper prices during the March 2005 fiscal year have both sharply improved<br />
the profitability of this project and contributed to earnings for the Metals & Mineral Resources<br />
Division.<br />
Coal operations in Australia<br />
and Canada<br />
At the Hail Creek coal mine in Australia,<br />
where coal shipments began<br />
in July 2003, moves are under way<br />
to develop a production framework<br />
to boost annual output from<br />
5.5 million metric tons to 8 million<br />
metric tons by 2006. Production<br />
and sales have also risen at Grande<br />
Cache Coal Corporation and Pine<br />
Valley Mining Corporation since the start of development at both mines, located in Canada,<br />
in late 2004. Strong demand for coking and PCI coal from Asia has been the driving force for<br />
<strong>Marubeni</strong>’s decision to start operations at these two mines.<br />
Partnership with Sinosteel Corporation<br />
<strong>Marubeni</strong> and Sinosteel Corporation, a major Chinese trading company, have signed a strategic<br />
cooperative agreement under which the two companies will work jointly to promote the<br />
trade of iron ore, coal, coke, steel scrap, ferro alloys, hot-briquetted iron (HBI) and other products,<br />
as well as investment in Chinese domestic and overseas resource development<br />
projects. While <strong>Marubeni</strong> and Sinosteel have been trading partners for more than two<br />
decades, this agreement to further strengthen cooperation in procurement and sales was<br />
prompted by challenging supply and demand<br />
conditions in recent years, particularly for raw<br />
materials used in steel production. For rapidly<br />
growing China, securing resource supplies overseas<br />
has become vital, and will likely lead to bigger<br />
initiatives with Sinosteel in the future.<br />
<strong>Marubeni</strong> Corporation 2005<br />
Segment Assets<br />
(At March 31)<br />
(Millions of yen)<br />
Segment Net Income<br />
(Years ended March 31)<br />
(Millions of yen)<br />
157,820<br />
180,257<br />
195,110<br />
’03 ’04 ’05<br />
1,923 4,258<br />
9,813<br />
’03 ’04 ’05<br />
Metals & Mineral<br />
Resources Division<br />
Iron Ore Unit<br />
Steel Making Raw Materials<br />
Unit<br />
Coal Unit<br />
Non-Ferrous Metals & Ores<br />
Unit<br />
Precious Metals Unit<br />
Light Metals Unit<br />
MMC Unit<br />
36 / 37
Strategy by Business Segment<br />
Transportation Machinery Division<br />
✔<br />
Developing new business models<br />
In the past fiscal year, we succeeded in the acquisition of promising<br />
new businesses for the aerospace and defense systems group, and<br />
developed business models in the automobile, construction & agricultural<br />
machinery and ship groups, contributed to the earnings of our<br />
division. In this fiscal year, we will strengthen our organization and<br />
three advantages based on the three strategies to continue developing<br />
new business models to enable further growth of our division.<br />
Division Strategies and Strengths<br />
Michihiko Ota<br />
Corporate Vice President, COO<br />
In the past fiscal year, our division contributed ¥9.2 billion, 22%<br />
of the Company’s consolidated net profit, and succeeded in the<br />
sale of aircraft engines to a major Japanese airline as an import<br />
agent, and the export of a large amount of Japanese construction<br />
machinery and won large orders for marine vessels from<br />
Japanese and overseas shipping lines.<br />
We have three advantages: “handling transportation<br />
machinery to grow promisingly throughout the 21st century, ”<br />
“having solid trading relationships and alliances with reputable<br />
large Japanese and overseas companies” and “having reliable<br />
experiences and know-how of investment, financing and the<br />
management of wholesale and retail machinery businesses”.<br />
To achieve our goal for this fiscal year and further strengthen<br />
our earnings base for the 2006 fiscal year and beyond, we will<br />
drive our business forward by improving our advantages based<br />
on the following three strategies;<br />
• Develop new business models, new products and new<br />
markets.<br />
• Maximize free cash flow through the sale of assets and<br />
business rights which are deemed both highly liquid and<br />
optimally valued, and reinvest such cash-in flow to promising<br />
new businesses.<br />
• Provide composite services to be generated by leveraging<br />
trading relationships and business alliances with our customers<br />
through our global network, thereby timely meeting<br />
our customer needs.<br />
Our action plans are:<br />
• In the aerospace and defense systems group, develop the<br />
import of private and regional jets for the private sector, as<br />
well as helicopters, aeroplane engines and electronic instruments<br />
for the public sector.<br />
• In the automotive, construction and agricultural machinery<br />
group, strengthen automotive wholesale and retail businesses<br />
in the U.S., Europe and other areas, and pursue automotive<br />
sales financing and automobile-parts sales business. Also,<br />
strengthen the export of construction, mining and agricultural<br />
machinery to North Africa, Middle East, Asia, China and the<br />
Confederation of Independent States (CIS).<br />
• In the marine vessel group, further develop the sales of new<br />
and used vessels and maritime machinery to Japanese and<br />
overseas shipping lines and charter brokerage activities. Also,<br />
maximize our own ship fleet.
Business Topics<br />
Aerospace and defense systems<br />
As an import agent, the division realized an<br />
order for Trent 1000 aircraft engines, currently<br />
being developed by Rolls-Royce plc of the U.K.,<br />
from a major Japanese airline. A jet aircraft<br />
manufactured by Gulfstream Aerospace Corporation<br />
was delivered to Japan Coast Guard for<br />
search and rescue missions, and the division<br />
won additional orders for large-size helicopters<br />
Trent 1000 aircraft engine being developed manufactured in Europe from the Japanese<br />
by Rolls-Royce plc of the U.K.<br />
Defense Agency. The division also started the<br />
lease business of transmission lines of a INMARSAT satellite positioned above the Indian<br />
Ocean. “Himawari 6,”a transportation and meteorological satellite, delivered by the division<br />
as an import agent, was successfully positioned above the Pacific Ocean.<br />
Automotive, construction and agricultural machinery<br />
Retail and wholesale operations of passenger<br />
automobiles and trucks overseas performed<br />
well, with annual handling volume<br />
reaching 85,000 units. Exports of construction<br />
machinery to Middle East, North Africa<br />
and Asia performed strongly, especially for<br />
mines undergoing aggressive expansion.<br />
Sales of agricultural machinery by overseas<br />
affiliates were also strong and the division<br />
started the development of sales channels in<br />
Eastern Europe.<br />
Chemical product carrier for the Formosa Group,<br />
manufactured by Universal Shipbuilding Corporation<br />
Large dump truck manufactured by Komatsu Ltd. in use<br />
at an Indonesian mine<br />
Marine vessels<br />
The division delivered four large-scale chemical product carriers (two 50,000-ton carriers<br />
and two 70,000-ton carriers) to the Formosa Group, a major chemical-products manufacturer<br />
in Taiwan. The division also received<br />
orders for three 200,000-ton bulk carriers<br />
and three 60,000-ton tankers from Japanese<br />
shipping lines, four 80,000-ton<br />
Panamax bulk carriers from a Greek shipping<br />
line, and two 150,000-ton tankers<br />
from a German shipping line. In total, the<br />
division received orders for more than 50<br />
vessels during the past fiscal year.<br />
<strong>Marubeni</strong> Corporation 2005<br />
Segment Assets<br />
(At March 31)<br />
* Due to a business<br />
division realignment,<br />
results prior to 2004<br />
are not disclosed.<br />
(Millions of yen)<br />
Segment Net Income<br />
(Years ended March 31)<br />
* Due to a business<br />
division realignment,<br />
results prior to 2004<br />
are not disclosed.<br />
(Millions of yen)<br />
290,782<br />
’05<br />
9,184<br />
’05<br />
Transportation Machinery<br />
Division<br />
Aerospace Unit<br />
Defense Systems Unit<br />
Automotive Unit<br />
Construction & Agro<br />
Machinery Unit<br />
Automotive & Construction<br />
Machinery Solution Unit<br />
Ship Unit<br />
38 / 39
Strategy by Business Segment<br />
Industrial Machinery & Information<br />
Business Division<br />
✔<br />
Progress through the convergence of hardware and software<br />
During the past fiscal year, we largely completed steps to deal with projects<br />
that had been pending. For the current year, we recognize that in realigning<br />
the division’s operations, pursuing synergies between major operating<br />
companies will be crucial to achieving earnings growth. For the division, the<br />
key word will be convergence of hardware and software. The new business<br />
model we are creating will bring together hardware such as textile machinery,<br />
production and industrial machinery, and optical fiber networks with<br />
software development. Overall, we plan to take decisive actions for completing<br />
the “V” PLAN and achieving growth in the fiscal year ending March<br />
31, 2007 and following years.<br />
Division Strategies and Strengths<br />
The division’s core businesses are the IT infrastructure and<br />
solutions business, sales of PC- and mobile communicationrelated<br />
products, and sales of production and industrial<br />
machinery to the automobile, pulp and paper, environmental,<br />
healthcare, and textile industries. In addition to pursuing independent<br />
business models while strengthening alliances with<br />
other units to expand individual business portfolios and grow<br />
earnings, each business proactively combines the functions<br />
of IT solutions and industrial engineering to create high<br />
added-value and thereby meet the increasingly sophisticated<br />
needs of customers.<br />
The division has three main strengths: 1) comprehensive<br />
capabilities that enable it to tackle large projects, 2) expertise<br />
that allows specialization in specific fields, and 3) a telecommunications<br />
sales and service system that leverages companyowned<br />
infrastructure. Regarding the first strength, the division<br />
aims to win large contracts that require integrated capabilities,<br />
including engineering, in such fields as automobile manufacturing,<br />
pulp and papermaking, and healthcare industries. With the<br />
second strength, the division pursues increased global market<br />
share and profitability by utilizing <strong>Marubeni</strong>’s sales network and<br />
Yoshinori Kusagaya<br />
Corporate Vice President, COO<br />
proprietary technologies in the environmental systems, consumer<br />
industries, and textile machinery fields. As for the third<br />
strength, the Vectant Group, which has its own optical fiber<br />
network and data centers, works to expand sales channels for<br />
high-end dedicated lines and IP network services, which are<br />
selling briskly amid the shift to broadband networks.<br />
The division focuses on the development of businesses and<br />
the cultivation of markets that promise strong growth. Areas<br />
where the division is working to bolster its business underpinnings<br />
and create new earnings pillars include the RFID* business,<br />
which is expected to demonstrate rapid growth across a<br />
broad range of fields, especially logistics; public security, which<br />
involves the strengthening of government security services<br />
and systems, which is being pursued by national governments<br />
around the world; new environmentally friendly energy sectors,<br />
including the solar power generation and biomass ethanol<br />
manufacturing businesses; and broadcasting, which is<br />
expected to see increased capital investment along with the<br />
shift to digital formats.<br />
* RFID (radio frequency identification), a technology that enables the tracking<br />
of people and goods using wireless IC tags
Business Topics<br />
Vectant Group’s Closed IP Network<br />
The Vectant Group provides the “Vectant Closed IP Network,” based on an enterprise IP<br />
network that is not connected to the Internet, to address the needs of customers for which<br />
data security is highly critical. The<br />
“Vectant Closed IP Network” connects<br />
multiple customers’ sites through the<br />
FLET’S Access Service provided by NTT<br />
East Corporation and NTT West Corporation<br />
at the customer’s site, thereby<br />
providing a highly secure network service<br />
that is isolated from the Internet.<br />
Individualized pork tracking system<br />
for Itoham Foods Inc.<br />
Itoham Foods Inc. has started using RFID technology<br />
developed by <strong>Marubeni</strong> and <strong>Marubeni</strong><br />
Nisshin Feed Co., Ltd. to track individual animals<br />
throughout the entire cultivation process, from<br />
birth to shipment, that are raised to produce its<br />
Kagoshima Berkshire pork. The system records<br />
and manages data, including birth date, birthplace,<br />
feed given, and drugs administered, by imbedding it on an IC tag. This provides a<br />
highly effective method of realizing food traceability, a keyword in food safety.<br />
Biomass electric generation facility for Niigata plant of Hokuetsu Paper Mills<br />
The division received an order from Hokuetsu Paper Mills, Ltd. for the basic construction<br />
of a biomass electric power generation facility. Design calls for the facility to generate<br />
85MW of power by using black liquor (wood resin), a by-product of the papermaking process,<br />
as a biomass energy source. The facility was delivered to Hokuetsu’s Niigata plant,<br />
and features Japan’s largest hightemperature,<br />
high-pressure recovery<br />
boiler, with black liquor processing<br />
capacity of 2,900 tons per day. Biomass<br />
electric power generation contributes<br />
significantly to the reduction of<br />
CO2 emissions compared with existing<br />
methods of power generation.<br />
<strong>Marubeni</strong> Corporation 2005<br />
Segment Assets<br />
(At March 31)<br />
* Due to a business<br />
division realignment,<br />
results prior to 2004<br />
are not disclosed.<br />
(Millions of yen)<br />
Segment Net Loss Income<br />
(Years ended March 31)<br />
* Due to a business<br />
division realignment,<br />
results prior to 2004<br />
are not disclosed.<br />
(Millions of yen)<br />
Industrial Machinery &<br />
Information Business<br />
Division<br />
Vectant Unit<br />
Nexion Unit<br />
228,563<br />
’05<br />
’05<br />
(14,827)<br />
Solution Business Unit<br />
Media Business Unit<br />
Overseas Telecom &<br />
Information Unit<br />
Production Machinery Unit<br />
Industrial Machinery Unit<br />
Environmental Machinery Unit<br />
Medical Business Unit<br />
Tekmatex Business Unit<br />
RFID Project Department<br />
40 / 41
Strategy by Business Segment<br />
Plant, Power & Infrastructure Projects<br />
Division<br />
✔<br />
Aiming for further growth as a comprehensive project<br />
solution provider<br />
In the fiscal year ended March 31, 2005, <strong>Marubeni</strong> enhanced its leadership as a<br />
comprehensive solution provider for public utilities and infrastructure projects,<br />
which include one of the world’s largest independent water and power project<br />
in Abu Dhabi, UAE. We have integrated our strengths in the infrastructure and<br />
power plant fields and we are driving for further growth as a comprehensive<br />
project solution provider. At the same time, we are building on our strategic<br />
initiative in market development and our broad range of services and expertise<br />
in marketing, financing and risk management.<br />
Division Strategies and Strengths<br />
In overseas power plant projects, the division has accumulated<br />
expertise in Engineering, Procurement and Construction (EPC)<br />
projects with an aggregate capacity of about 69,000MW since<br />
1960, and proudly maintains a competitive advantage within the<br />
industry. Moreover, in Independent Power Producer (IPP) operations,<br />
the division has developed and acquired power plant assets<br />
with a gross capacity of 6,400MW. In 2005, the division is set to<br />
transfer to and unify most of its power plant assets under the<br />
management of a holding company. At the same time, the division<br />
is driving forward its growth strategy by acquiring, investing in and<br />
developing outstanding IPPs.<br />
In domestic power-related business concerns, the division<br />
took advantage of industry deregulation to sell electricity as a<br />
Power Producer and Supplier (PPS). Today, the division supplies<br />
electricity to 45 users with an aggregate capacity of about<br />
100,000kW. The division plans to expand the scale of its retail<br />
power business as deregulation is extended to all high-voltage<br />
power consumers in 2005. Moreover, the division is developing<br />
wind power projects as renewable portfolio standards (RPS) and<br />
now holds an aggregate capacity of 70,000kW. Meanwhile, sales<br />
of molten carbonate fuel cells produced by U.S.-based FuelCell<br />
Energy, Inc. are on track for further growth. In August, 2004,<br />
Fuel Cell Japan, Co., Ltd. was established to increase after-sales<br />
services targeting customers.<br />
Mamoru Sekiyama<br />
Corporate Senior Vice President, COO<br />
In railway and transport projects, the division’s competitive<br />
advantages include the ability to construct railway systems on a full<br />
turnkey basis. In addition, the division focuses on the offshore<br />
trading of transportation-related EPC projects such as airports,<br />
ports and harbors, bridges, and roads. Besides governmentally<br />
funded projects, the division is undertaking the operation of infrastructure<br />
under Public Private Partnership (PPP) schemes and the<br />
operation and maintenance services for railway systems.<br />
In the area of environment infrastructure, wide-ranging activities<br />
targeting total delegated water management service contracts in the<br />
public-sector water/wastewater market have been promoted nationwide<br />
in Japan by Jenets Co., Ltd., providing water bill collection and<br />
meter inspection services. In the overseas market, the division has<br />
had substantial successes in water and wastewater on a Build-Own-<br />
Transfer (BOT) basis; among them a water treatment plant in China<br />
and an industrial wastewater treatment project in Mexico. These<br />
exemplify the kinds of projects through which the division hopes to<br />
actively enlarge its activities in the future.<br />
In the plant business covering oil and gas, other natural<br />
resources, steel and cement, the division not only has relationships<br />
with a high degree of trust with first-class partners, but also has a<br />
high level of expertise in fields such as structured finance and risk<br />
management. Enhancing its broad range of functions and expertise,<br />
the division creates a value chain that is horizontally integrated<br />
among different divisions in <strong>Marubeni</strong> and provides customers with<br />
more value-added services.
Business Topics<br />
Tilting rolling stock for the<br />
Taiwan Rail Authority<br />
<strong>Marubeni</strong>, in collaboration with<br />
Hitachi, Ltd., contracted for the<br />
supply of tilting rolling stock for<br />
the Eastern Railway of Taiwan Railway<br />
Authority (TRA) (48 units for<br />
about ¥9 billion). The Eastern Railway,<br />
serving many tourists, runs<br />
from Taipei to Hualian, a tourist<br />
spot, through curved sections of<br />
track along the eastern side of the northern shore of the island. The rolling stock is<br />
equipped with automatic tilting systems that tilt the body automatically in conformance with<br />
the curve of the track under computerized control. This ensures a substantial improvement<br />
in speed control as well as a comfortable ride for passengers.<br />
Phu My 4 combined cycle power project for Electricity of Vietnam (EVN)<br />
<strong>Marubeni</strong>, in August 2004, completed the construction of the Phu My 4 combined cycle<br />
power plant with a gross capacity of<br />
450,000kW for Electricity of Vietnam (EVN).<br />
<strong>Marubeni</strong> executed the ¥26 billion project in<br />
cooperation with the French-Swiss company<br />
ALSTOM. Located in the suburbs of Ho Chi<br />
Min City in southern Vietnam, the plant supplies<br />
power mainly to the nation’s largest<br />
city and is expected to address the country’s<br />
demand for electricity, which is surging in<br />
step with economic growth.<br />
Cement plant in the Kingdom of Saudi Arabia<br />
<strong>Marubeni</strong> signed an EPC service contract with the privately owned Riyadh Cement Company<br />
for the supply of an integrated cement plant with a capacity of 1.6 million tons per<br />
year. <strong>Marubeni</strong>, jointly with Sinoma International<br />
Engineering Co., Ltd. (China), will<br />
implement the ¥18 billion project within 26<br />
months. This marks the first project in which<br />
<strong>Marubeni</strong> has undertaken the offshore transaction<br />
of a cement plant designed by a Chinese<br />
partner. <strong>Marubeni</strong> promotes offshore<br />
transactions in cooperation with Sinoma<br />
International, one of the largest cement<br />
plant engineering companies in China.<br />
<strong>Marubeni</strong> Corporation 2005<br />
Segment Assets<br />
(At March 31)<br />
* Due to a business<br />
division realignment,<br />
results prior to 2004<br />
are not disclosed.<br />
(Millions of yen)<br />
Segment Net Loss Income<br />
(Years ended March 31)<br />
* Due to a business<br />
division realignment,<br />
results prior to 2004<br />
are not disclosed.<br />
(Millions of yen)<br />
643,435<br />
’05<br />
’05<br />
(12,027)<br />
Plant, Power &<br />
Infrastructure Projects<br />
Division<br />
Overseas Power Project Unit-I<br />
Overseas Power Project Unit-II<br />
Domestic Power Project Unit<br />
New Energy Business Unit<br />
Environment Infrastructure Unit<br />
Railway & Transport Project Unit<br />
Energy & Natural Resources<br />
Projects Unit-I<br />
Energy & Natural Resources<br />
Projects Unit-II<br />
Asset Management Unit<br />
42 / 43
Strategy by Business Segment<br />
Development & Construction Division<br />
✔<br />
Maximizing profits and developing new commercial assets<br />
The division first started condominium sales operations in the 1960s. In the decades<br />
since, the division has constructed a framework that integrates and manages everything<br />
from the purchase of land to property construction, management and upkeep of the<br />
buildings. In fact, the division now boasts capabilities and experience that, at the very<br />
least, put it on an equal footing with dedicated property developers. As we look ahead,<br />
we intend to use these advantages to devise structures that will enable the<br />
division to raise its business volume even more. In conjunction with this goal,<br />
we are committed to helping to achieve the objectives of the “V” PLAN<br />
through actions that will include extending the division’s residential housing<br />
operations in China beyond the Shanghai region, as well as forays into REIT<br />
and private subscription funds and other new business fields.<br />
Norihiro Shimizu<br />
Corporate Vice President, COO<br />
Division Strategies and Strengths<br />
This division has developed approximately 70,000 units to date.<br />
Equipped with experienced staff and product planning capabilities<br />
comparable to even that of dedicated property developers,<br />
the condominium business focuses on development particularly<br />
in the Tokyo Metropolitan Area, and the Kinki and Nagoya<br />
regions. The division also incorporates a number of companies,<br />
including <strong>Marubeni</strong> Real Estate Sales Co., Ltd. (sales), Benny<br />
Estate Service Co., Ltd. (property management), and Tsunagu<br />
Network Communications, Inc. (IT promotion and ISP business<br />
targeting condominium developments). An integrated presence<br />
across all aspects of condominium development, from planning<br />
to sales and management, also counts as one of <strong>Marubeni</strong>’s<br />
strengths. Going forward, <strong>Marubeni</strong> plans to aggressively<br />
develop properties not only in highly convenient urban areas<br />
but also in outlying areas expected to demonstrate demand.<br />
<strong>Marubeni</strong> also participates in the residential property business<br />
outside of Japan. As the first Japanese real estate developer<br />
in the Shanghai market, <strong>Marubeni</strong> has sold approximately<br />
2,600 condominiums and townhouses to date. In 2005,<br />
<strong>Marubeni</strong> plans to carry out detached housing projects encompassing<br />
around 220 units.<br />
As the housing business is the field in which the division<br />
specializes, <strong>Marubeni</strong> is committed to further strengthening it<br />
as a pillar of sustained earnings.<br />
Furthermore, one of the key themes of the “V” PLAN is<br />
developing new sources of earnings in addition to the housing<br />
business. The Urban Development Unit, established in April<br />
2003, engages in the rental and subleasing business and<br />
aggressively pursues other avenues of growth, including the<br />
development of properties that can be sold to investors and<br />
generate fee-based revenue. Leveraging this approach, the unit<br />
is achieving steady earnings growth.<br />
<strong>Marubeni</strong> has also invested in Japan REIT Advisors Co.,<br />
Ltd., a real estate investment trust management firm. United<br />
Urban Investment Corporation (UUI), which was formed by<br />
Japan REIT Advisors, was listed on the Tokyo Stock Exchange<br />
in December 2003, and carried out its second round of funding<br />
through a public subscription in December 2004, thereby<br />
expanding its total assets.<br />
Through these and other proactive initiatives, <strong>Marubeni</strong><br />
remains committed to cultivating promising businesses as new<br />
earnings pillars in addition to strengthening the housing business.
Business Topics<br />
Domestic condominium business<br />
Sales of domestic condominiums, mainstay of this<br />
division, were firm overall. In the Tokyo<br />
Metropolitan Area, demand was especially strong<br />
for high-end units in the city center, exemplified<br />
by the “Grand-Suite Shirokane Marks.” Demand<br />
in suburban locations was concentrated on highly<br />
convenient properties located adjacent to major<br />
Grand-Suite Shirokane Marks<br />
railway hubs, such as the family-oriented<br />
“FAMILLE Square Matsudo Leala Commons.” In the Kinki region, the “Grand-Suite<br />
Nakanoshima Tower,” a high-rise complex located in central Osaka, proved to be highly<br />
popular with homebuyers.<br />
Overseas housing development unit<br />
<strong>Marubeni</strong> completed development of the 1,644-unit “Phoenix City Project” in Shanghai in<br />
December 2004. Started in December 2001,<br />
the three-stage project followed on the success<br />
of the “Sakura Garden” project, which<br />
encompasses 928 townhouses. The “Phoenix<br />
City Project” is now completely sold out,<br />
reflecting brisk demand fueled by the high<br />
esteem of buyers in this end of the Shanghai<br />
market. <strong>Marubeni</strong> is already working on a<br />
third project in Shanghai, “Quilin Garden,”<br />
that encompasses approximately 220<br />
Phoenix City Project<br />
detached houses. The project is proceeding<br />
smoothly, with sales slated to start in 2005.<br />
New business ventures<br />
UUI is a fund established by Japan REIT Advisors,<br />
in which <strong>Marubeni</strong> has invested. UUI is focused on<br />
developing balanced real estate investment portfolios<br />
that include commercial facilities, office buildings,<br />
hotels, and residential buildings based on a<br />
total risk-diversification approach. In December<br />
2003, UUI listed on the Tokyo Stock Exchange,<br />
and in December 2004 it carried out a new round<br />
of funding through a public subscription amounting<br />
to approximately ¥51.0 billion. Today, equity<br />
participation in UUI has climbed to approximately<br />
¥90.0 billion, as the fund continues to grow its<br />
asset scale.<br />
<strong>Marubeni</strong> Corporation 2005<br />
Segment Assets<br />
(At March 31)<br />
376,963<br />
’03 ’04 ’05<br />
(Millions of yen)<br />
Segment Net Loss Income<br />
(Years ended March 31)<br />
’03 ’04 ’05<br />
(205)<br />
(Millions of yen)<br />
330,506<br />
(154)<br />
317,692<br />
Development &<br />
Construction Division<br />
Tokyo Housing Development Unit-I<br />
Tokyo Housing Development Unit-II<br />
Construction Business Unit<br />
Urban Development Unit<br />
(11,362)<br />
Real Estate Business Unit-I<br />
Real Estate Business Unit-II<br />
Osaka Housing Development Unit<br />
Housing Supporting Business Unit<br />
Overseas Housing Development<br />
Unit<br />
Estate Management Unit<br />
44 / 45
Strategy by Business Segment<br />
Finance & Logistics Business Division<br />
✔<br />
Developing a structure for prudent but bold action<br />
The division’s activities can be summarized as the sale of services in our<br />
business domains of financing, logistics and insurance. Because we<br />
provide these services to the entire <strong>Marubeni</strong> Group, we have enhanced<br />
our solution capabilities. And we are now providing sophisticated and<br />
diversified services to external clients to extend our earnings structure. As<br />
a relatively young division that was established in 2001, one of our<br />
greatest strengths is our aggressiveness in meeting new challenges<br />
without being constrained by the past. As we work toward completion of<br />
the “V” PLAN, we are looking ahead to a new business structure for our<br />
post-“V” PLAN phase of growth by maintaining a prudent but bold<br />
business attitude.<br />
Toru Nishimi<br />
Division Strategies and Strengths<br />
The division is composed of five units: Finance Business, Treasury<br />
& Trading, Logistics Business, Insurance Business, and P&A (Personnel<br />
and Advertisement) Business. Each unit provides highquality<br />
services and functions to Group companies and external<br />
customers, backed by highly specialized expertise, broad business<br />
networks, and a high degree of recognition within the industry. In<br />
addition, each unit makes maximum use of synergies among each<br />
other and with other operating division businesses, comprising yet<br />
another of <strong>Marubeni</strong>’s strengths.<br />
In finance, we offer services that combine the collective<br />
strengths and expertise of <strong>Marubeni</strong> as a general trading company.<br />
When setting up, formulating, managing and selling management<br />
buy-in, venture capital, and real estate funds, we are able to draw<br />
on <strong>Marubeni</strong>’s extensive network and expertise in incubating businesses.<br />
And by capitalizing on in-depth knowledge and experience<br />
in portfolio management, we can develop and manage new types<br />
of investment products.<br />
In treasury & trading, we are actively trading in foreign currency,<br />
stocks and interest futures markets. We are also involved in hedge<br />
fund investments and their portfolio management. Making good<br />
use of our sophisticated know-how and information networks cultivated<br />
over the years in these markets, we provide high value-added<br />
advisory services to customers about comprehensive foreign<br />
exchange hedging.<br />
Corporate Senior Vice President, COO<br />
Logistics services is one of our fundamental functions and, therefore,<br />
a mainstay business. Alongside our traditional strength in sophisticated<br />
international logistics services, we have been expanding our<br />
capacity to offer supply chain management (SCM), third-party logistics<br />
(3PL) and other solutions in conjunction with logistics services. This has<br />
made us a one-stop source of logistics solutions that address client<br />
needs in Japan and overseas. Overseas, we operate container terminal<br />
businesses in Thailand, the Philippines and other countries that are<br />
peerless in the trading house sector.<br />
In insurance, we act as an agent and as a broker. Our services<br />
extend beyond life and non-life insurance policies for individual and<br />
corporate clients to include trade credit insurance, which is in increasing<br />
demand in Japan. Furthermore, we are broadening our<br />
horizons by exploring the feasibility of entering new markets that do<br />
not fall within the domains of the life or non-life insurance sectors.<br />
Notable examples are third-sector insurance products such as nursing<br />
care and disability income insurance. Moreover, weather derivatives,<br />
corporate pension funds and other areas on the fringe of the<br />
insurance industry also harbor potential as future businesses for the<br />
division.<br />
P&A Services is a field that we first entered during the year<br />
under review. Here, we are taking steps to expand business lines<br />
and the earnings base in our quest to provide high-quality personnel<br />
and advertising services.
Business Topics<br />
Launching new funds<br />
<strong>Marubeni</strong> started its activities in the buyout fund market in<br />
the 1990s, and is showing great performance to date by<br />
leveraging its cutting-edge investment technology. Its outstanding<br />
presence in the field allowed <strong>Marubeni</strong> to launch<br />
i-sigma Tokyo Venture Fund, a venture capital fund sponsored<br />
by the Tokyo Metropolitan Government.<br />
Logipartners’ Shin-Shonan<br />
Warehouse.<br />
Outlet of ACTUS Corporation, a fund<br />
portfolio company.<br />
Establishment of Logipartners Inc.<br />
<strong>Marubeni</strong> established a new company, Logipartners Inc.,<br />
as a vehicle for expanding its 3PL business. Deploying a<br />
consulting-based business model, Logipartners takes<br />
advantage of <strong>Marubeni</strong>’s own warehouse network to<br />
propose lower-cost logistics and other solutions to clients.<br />
Logipartners links incidental commercial distribution<br />
operations dependent on demand and production,<br />
such as inventory management and ordering operations,<br />
with a full range of logistics operations, from transportation<br />
to storage, logistics processing and sorting and<br />
small-volume retail delivery. Logipartners then combines<br />
the necessary information systems, equipment and<br />
devices into logistics infrastructure packages, with the aim<br />
of providing functional and integrated logistics services.<br />
Insurance operations in Europe<br />
In addition to operations centered on <strong>Marubeni</strong> Safenet Co., Ltd. as an agent and broker<br />
for life and non-life insurance policies in Japan, the division, through Marnix Corporation<br />
and U.K.-based Marnix Europe Ltd., is raising its profile outside Japan by forging alliances<br />
with key overseas brokers. These alliances enable the division to actively seek reinsurance<br />
broker opportunities in overseas markets, as it works to enhance the earnings power<br />
of its insurance brokerage operations.<br />
<strong>Marubeni</strong> Corporation 2005<br />
Segment Assets<br />
(At March 31)<br />
169,504<br />
’03 ’04 ’05<br />
(Millions of yen)<br />
Segment Net Income<br />
(Years ended March 31)<br />
3,344<br />
(Millions of yen)<br />
144,432<br />
2,502<br />
’03 ’04 ’05<br />
Finance & Logistics<br />
Business Division<br />
Finance Business Unit<br />
Treasury & Trading Unit<br />
Logistics Business Unit<br />
Insurance Business Unit<br />
P&A Business Unit<br />
128,760<br />
4,047<br />
46 / 47
Strategy by Business Segmentlance<br />
Iron & Steel Strategies and<br />
Coordination Department<br />
✔<br />
This department was established in May 2001, ahead of the transfer of the Iron and Steel business to<br />
<strong>Marubeni</strong>-Itochu Steel Inc. (MISI), a company founded on October 1, 2001.<br />
The department closely coordinates activities among between MISI, <strong>Marubeni</strong> Construction Material Lease,<br />
Thai Cold Rolled Steel and other operating companies, which in turn are used to promote more organic<br />
functions in the iron and steel business in every industry where <strong>Marubeni</strong> Group divisions are active.<br />
In the four years since its founding, MISI has marked rapid<br />
progress in integrating personnel from both <strong>Marubeni</strong> and<br />
ITOCHU Corporation, and is making its presence felt as a<br />
leading trading company in the steel sector. In the fiscal year<br />
ended March 31, 2005, MISI posted robust results centered<br />
on the shipbuilding, automotive, and industrial machinery<br />
fields in Japan, as well as brisk exports to China and other<br />
markets in Asia.<br />
Thai Cold Rolled Steel Sheet Public Co., Ltd. (TCR), a joint<br />
venture between JFE Steel Corporation and the Sahaviriya<br />
Group of Thailand, is a manufacturer of cold rolled steel sheets<br />
primarily used in the manufacture of automobiles and home<br />
appliances. TCR has steadily ramped up both production and<br />
sales volumes since operations commenced in 1997, providing<br />
high-quality cold rolled steel sheets to Japanese companies with<br />
localized operations and other sources of demand in Thailand.<br />
New Bangkok International Airport under construction<br />
MISI delivered pipes, steel reinforcements and other steel materials<br />
used in the construction of the New Bangkok International Airport, also<br />
known as the Suvarnabhumi (or “Golden Land”) Airport, scheduled to<br />
open in the fall of 2005.<br />
The new airport is being built to cope with the increased demand for air<br />
travel that has accompanied Thailand’s economic development. The<br />
facility is located 30km east of Bangkok in the Nong Ngu Hao district, and<br />
can handle a maximum of approximately 45 million air travelers annually.<br />
The new airport is also intended to stimulate a surge in the number of air<br />
passengers to Bangkok and the surrounding region. The airport, including<br />
the concourse and two runways, is 60m in width, and will run 4,000m<br />
and 3,700m along its eastern and western sides, respectively.<br />
<strong>Marubeni</strong> Construction Material Lease Co., Ltd., listed on the<br />
Second Section of the Tokyo Stock Exchange and having already<br />
staked out a corner of the heavy scaffolding and construction<br />
materials industry, is also steadily broadening its business scope.<br />
As a holding division for operating companies involved in<br />
iron and steel products, the Iron & Steel Strategies and Coordination<br />
Dept. will remain committed to growing earnings and<br />
generating new businesses via its operating companies. At the<br />
same time, the department is upgrading its intelligence functions,<br />
namely its capacity to gather, assess and provide market<br />
data pertaining to target customers, steel products and other<br />
market aspects, as well as its solutions functions, essentially<br />
its ability to analyze current trends, identify key topics, and<br />
propose solutions. In this way, the department is determined<br />
to help <strong>Marubeni</strong> sustain the comprehensive nature of its iron<br />
and steel product businesses.<br />
Jiaxing Hongzhong Steel Processing<br />
MISI established Jiaxing Hongzhong Steel<br />
Processing Co., Ltd. as a new steel plate and<br />
sheet processing center in the Jiaxing City region<br />
of China’s Zhejiang Province. The new company<br />
was capitalized at US$10 million. Recently, home<br />
appliance manufacturers and automakers have<br />
accelerated their advance into China. This trend<br />
has sparked a dramatic surge in demand for highquality<br />
steel plates and sheets, including highstrength<br />
products used in automobile production.<br />
In response, MISI moved to establish the new<br />
plant, which is scheduled to come on stream in<br />
early 2006.<br />
TCR<br />
The Thai automobile industry is aiming to<br />
become the “Detroit of Asia.” TCR focuses<br />
heavily on supplying this sector and the rest of<br />
Thailand with around 750,000 to 800,000 metric<br />
tons of high-quality cold rolled steel each year. At<br />
the same time, TCR exports between 150,000 to<br />
200,000 metric tons of these products to other<br />
fast-growing neighboring countries in Asia.
Business Incubation Department<br />
✔<br />
The Healthcare Group has entered and expanded its presence in<br />
the medical treatment, nursing care services, as well as the<br />
health improvement and disease prevention sectors. By establishing<br />
strategic alliances with companies in different industries,<br />
the department is constructing innovative business models.<br />
The Biotechnology and Regenerative Medicine Group has<br />
concentrated its activities on working to identify venture companies<br />
with advanced technology, establish joint ventures, and<br />
arrange licensing businesses.<br />
The Nanotechnology and New Technology Group has identified<br />
nanomaterials and nanoelectronics as its strategic fields<br />
of interest in this area, and various projects to develop the<br />
technologies and ventures are under way. At present, the<br />
department is working to invest in ventures possessing<br />
technologies with application already at hand and arrange<br />
Optware Corp.’s holographic data storage and disc<br />
The product will be designed to surpass the capacity of Blu-Ray and<br />
HD-DVD.<br />
Given Imaging’s capsule type<br />
endoscope<br />
The proliferation of the product is hoped to<br />
contribute to the improvement of disease<br />
prevention diagnosis in Japan.<br />
<strong>Marubeni</strong> Corporation 2005<br />
The activities of the Business Incubation Department are organized into three groups: healthcare,<br />
biotechnology and regenerative medicine, and nanotechnology and new technologies. The department<br />
was established in April 2001 and since then, the department has made investments in 32<br />
projects. In all cases, the growth potential and originality of the patents and expertise involved in<br />
each project were thoroughly assessed to create the most suitable business model.<br />
licensing and cross-licensing of the technology. Furthermore,<br />
in September 2004, <strong>Marubeni</strong> invested in Optware Corp.,<br />
which is steadily developing the commercialization of a nextgeneration<br />
optical data storage system. Furthermore, in March<br />
2004, the department invested in Showakasei Co., Ltd.,<br />
which manufactures and develops safety-oriented counter<br />
units with inbuilt handrails for places such as bathrooms and<br />
kitchens. <strong>Marubeni</strong> has assisted the OEM production of<br />
Showakasei’s products in China and sold the product in Japan.<br />
The department will continue to create new businesses in<br />
breakthrough technologies that are capable of transforming<br />
existing business sectors and industry structures and solution<br />
providing technologies as well as environmental business<br />
which utilizes microorganisms.<br />
Penox’s ultra-lightweight portable oxygen<br />
cylinder<br />
Currently working to introduce the product to the<br />
Japanese market.<br />
48 / 49
Strategy by Business Segmentlance<br />
Overseas Operations<br />
China<br />
<strong>Marubeni</strong> opened its first representative offices in China in 1979 just as the Chinese<br />
government began to adopt a policy of opening the economy to foreign investments.<br />
Having positioned China as a key market for many years, we have played a pioneering role<br />
among Japan’s general trading companies by aggressively raising the volume of trade and<br />
investments involving this country. Currently, we have 16 subsidiaries and offices in 14 cities in China<br />
and Hong Kong. Targeting opportunities created by rapid economic growth in China, we are using<br />
our global network to conduct aggressive trade and investment activities in many market sectors.<br />
Our trade with China has been climbing steadily, rising from<br />
US$5.0 billion in the fiscal year ended March 31, 2003, to<br />
US$6.0 billion the following year and US$7.2 billion in the fiscal<br />
year ended March 31, 2005. As of April 1, 2005, we have also<br />
made substantial investments, holding US$570 million in equity<br />
in 142 operating companies in China and Hong Kong that have<br />
total capital of about US$1.5 billion.<br />
Actions continue in line with <strong>Marubeni</strong>’s long-standing commitment<br />
to growing operations in China in close step with<br />
national-level policies within the country. Representative offices<br />
were opened in Chengdu in April 2004, allowing us to participate<br />
in developing western China, and Changchun in April 2005<br />
to increase economic activity in northeastern China.<br />
<strong>Marubeni</strong> is working with Chinese companies on joint<br />
projects in other countries. One accomplishment was the<br />
March 2005 winning of an order from China-based Sinoma<br />
International Engineering Co., Ltd. to construct a US$170 million<br />
cement plant in Saudi Arabia. We have also collaborated with<br />
Chinese companies to bid on power plant projects in Southeast<br />
Asia and participate in other types of projects.<br />
In recent years, many large nationally owned companies in<br />
China have been restructuring operations. One result is the<br />
investment of substantial foreign capital in these companies. In<br />
March 2005, <strong>Marubeni</strong> purchased equity in BOE Technology<br />
Group Co., Ltd., a leading company in China’s IT industry, and<br />
Conceptual image of a cement plant in Saudi Arabia. Partnership with Beijing BOE Investment & Development<br />
and BOE Technology Group.<br />
signed a strategic cooperation agreement with this company.<br />
We expect this to lead to growing business volume and joint<br />
investments in electronic materials for LCD panels and other<br />
growing market sectors in China.<br />
In the field of resource development, we have for many<br />
years been involved in coal and aluminum operations in Australia<br />
through a joint investment with CITIC. In March 2005, we<br />
signed a comprehensive cooperation agreement with China<br />
Steel Group. We plan to use this partnership to step up<br />
resource development activities in China and other countries,<br />
primarily involving steel resources.<br />
Looking ahead, investments and other <strong>Marubeni</strong> resources will<br />
be focused on four strategic categories in China: expanding business<br />
operations in western and northeastern China; working with<br />
Chinese companies on industrial plant projects in other countries;<br />
conducting natural resource development projects with Chinese<br />
companies in China and other countries; and investing in growing<br />
market sectors such as retail, high-tech and automobiles.<br />
Now that China has joined the WTO, the government is<br />
starting to lift restrictions on the distribution and sale of merchandise.<br />
In 2001, <strong>Marubeni</strong> established China’s first trading<br />
and wholesaling joint venture. By using experience gained<br />
through this company, which is based in Shanghai, we are now<br />
preparing to establish a wholly owned subsidiary in China that<br />
will handle foreign trade and wholesale operations.<br />
Signing ceremony for an agreement with Sinosteel<br />
Corporation.
North America<br />
In the United States, Helena Chemical Company and Carlisle Leasing<br />
International, LLC, the most important subsidiaries of<br />
<strong>Marubeni</strong> America Corporation, continue to perform well.<br />
We plan to continue using these two companies as a platform<br />
for executing our North American regional strategy that calls for<br />
enhancing our business activities and profitability.<br />
<strong>Marubeni</strong> America Corporation, the <strong>Marubeni</strong> Group’s largest<br />
overseas corporate subsidiary, is the platform for executing<br />
<strong>Marubeni</strong>’s North American regional strategy that calls for enhancing<br />
the Group’s business activities and profitability. In the United<br />
States, Helena Chemical Company and Carlisle Leasing International,<br />
LLC, two of the most important subsidiaries of <strong>Marubeni</strong><br />
America continue to perform well.<br />
<strong>Marubeni</strong> America has 12 subsidiaries with about 3,000 employees<br />
as well as 22 affiliated companies. In 2004, the economy<br />
of the United States expanded along with growing investments<br />
and exports due, in part, to low interest rates and a rebound in the<br />
global economy. In this environment, Helena Chemical and Carlisle<br />
Leasing International, the two largest businesses of <strong>Marubeni</strong><br />
America, both achieved record earnings. This performance helped<br />
propel consolidated pretax earnings of <strong>Marubeni</strong> America to an alltime<br />
high.<br />
Helena Chemical is a diversified marketer of agricultural products,<br />
such as agrochemicals, fertilizer and seeds, with 250 sales<br />
bases throughout the United States. Despite challenges from a<br />
contracting agrochemical market and rising competition from<br />
imports, this company reported record earnings. One reason was<br />
growth in its agrochemical market share due to an increase in<br />
direct sales to farm operators. Another factor was growth in the<br />
scope of operations through numerous acquisitions, including in<br />
the fertilizer industry. Carlisle Leasing International leases refrigerated<br />
containers for maritime transportation. Backed by growth<br />
in international trade, especially exports from China, and strong<br />
<strong>Marubeni</strong> Corporation 2005<br />
demand for ocean transport, Carlisle Leasing International ordered<br />
more than 10,000 containers in 2004. This lifted its share of the<br />
container operating lease market to about 30%, making it the<br />
effective global leader in the business. In addition, backed by<br />
growing domestic food consumption, MAC Trailer Leasing LLC,<br />
which leases refrigerated trailers, is posting steadily higher earnings<br />
each year.<br />
Regarding <strong>Marubeni</strong> America’s trading business, <strong>Marubeni</strong><br />
America consolidated its three bases in the Silicon Valley region to<br />
form the new Silicon Valley Branch. This brings together sales<br />
personnel handling metal resources, IT, chemicals and other businesses,<br />
providing a unified platform for increasing sales of materials<br />
and products used by high-tech industries. To set the stage for<br />
future growth, <strong>Marubeni</strong> America is investing in a variety of funds<br />
and biotech venture companies with the aim of earning capital<br />
gains. Other forward-looking actions include the identification of<br />
products and businesses, and associated investments, for which<br />
demand exists in Japan. Examples are fuel cells, radio frequency<br />
identification (RFID), new materials and composite semiconductors.<br />
Another goal is increasing business with customers in China<br />
and other Asian countries.<br />
<strong>Marubeni</strong> America is currently working on achieving the goals of<br />
its “V” PLAN. One way is by achieving further growth at Helena<br />
Chemical and Carlisle Leasing International. <strong>Marubeni</strong> America is<br />
also placing priority on building businesses with deep local roots<br />
that can become new profit centers, as well as on identifying and<br />
developing other business opportunities.<br />
Tank facilities at Helena Chemical. An office at Helena Chemical. A refrigerated trailer for overland transport handled by<br />
MAC Trailer Leasing LLC.<br />
50 / 51
Strategy Overseas by Operations Business Segmentlance<br />
Europe<br />
During the year ended March 31, 2005, the 12 euro zone countries recorded an average GDP<br />
growth of more than 2% while the 10 new EU members, excluding Malta, had a growth rate of<br />
more than 4%. Even more significant are the high growth rates of more than 7% in Romania<br />
and Turkey, two of the four nations that hope to join the EU. In general, higher growth rates<br />
are seen in countries able to supply low-cost labor, which attract large inflows of capital and<br />
capital goods. Successful trading company activities thus depend on the ability to acquire local<br />
information from these rapidly growing countries and regions.<br />
<strong>Marubeni</strong> Europe plc is focusing on two strategies in line with<br />
the “V” PLAN. One of them is to place our priorities on Poland,<br />
the Czech Republic, Hungary and Romania, which are becoming<br />
manufacturing bases for Western European nations. The<br />
other is to increase business volume in Turkey, the CIS region,<br />
the Arab Maghreb Union (Algeria, Morocco and Tunisia) and<br />
other countries near the borders of Europe. In the Czech Republic<br />
and Hungary, <strong>Marubeni</strong> Europe provides a full line of<br />
services for Japanese auto parts manufacturers, including the<br />
installation of production equipment and supply of materials. In<br />
Romania and Turkey, we are meeting the needs of local customers<br />
for medical equipment by packaging sales with credit<br />
extended by European and U.S. export credit organizations.<br />
Regarding market sectors, <strong>Marubeni</strong> Europe’s strategy is to<br />
build strong positions in niche products and services. One<br />
tactic is to increase sales in Europe of value-added synthetic<br />
resin products targeting specialized needs. <strong>Marubeni</strong> Europe is<br />
also acquiring rights to handle textile products with prestigious<br />
British brand names. To market these products, we draw on a<br />
complete line of functions that make use of <strong>Marubeni</strong>’s extensive<br />
sales channels and business relationships. For example,<br />
we made an investment in Mackintosh, a well-known British<br />
line of coats. We are using a variety of expertise to execute a<br />
global strategy for Mackintosh in conjunction with GLOBE-<br />
TROTTER, a travel bag brand.<br />
In the fiscal year ending March 31, 2006 as well, <strong>Marubeni</strong><br />
Europe is committed to the effective execution of the regional<br />
and merchandise strategies outlined above.<br />
GLOBE-TROTTER storefront and interior. The Futaba factory in the Czech Republic.
Other Regions<br />
■ Brazil<br />
Brazil has seen its influence on the global stage increase rapidly<br />
in recent years. The nation has the largest economy in Latin<br />
America, and often speaks on behalf of Third World countries at<br />
international organizations like the WTO and United Nations.<br />
<strong>Marubeni</strong> Brasil S.A., which now has offices in Sao Paolo,<br />
Rio de Janeiro and Salvador, has been operating for almost 50<br />
years. Activities include the export of soybeans, broilers, iron<br />
ore, non-ferrous metals and other goods to Asia. The<br />
company also imports coal and non-ferrous metal products.<br />
Another core activity is serving as a conduit for importing<br />
advanced technology from Japan. For PETROBRAS, the<br />
national petroleum company, <strong>Marubeni</strong> Brasil arranged Japan<br />
Bank of International Cooperation (JBIC) financing for an oil<br />
drilling platform project; supplied continuous casting equipment<br />
to steelmaker Companhia Siderurgica de Tubarao (CST);<br />
and sold an automated sorting system to the Postal Administration<br />
of Brazil.<br />
<strong>Marubeni</strong> Brasil plans to expand its participation in environmental<br />
projects involving Joint Implementation/Clean Development<br />
Mechanism emission credits and increase exports to<br />
Japan, such as the sale of aircraft made by Embraer.<br />
<strong>Marubeni</strong> Brasil owns four operating companies that are<br />
contributing to the growth of Brazil’s economy. Among the four<br />
companies are Cia. Iguacu de Café Soluvel, which exports<br />
instant coffee to Japan, the U.S. and Europe, and SILBASA-<br />
SILICIO, which exports high-purity ferrosilicon to Japan.<br />
■ Russia<br />
In Russia, <strong>Marubeni</strong> is concentrating on three fields: energy,<br />
machinery and industrial plants, and consumer goods. The goal<br />
is to raise the volume of business in each of these areas. In the<br />
natural resource development sector, we have been participating<br />
for many years in the Sakhalin Island oil and gas development<br />
project, where full-scale production is about to begin. In<br />
the machinery and industrial plant sector, operations target the<br />
Brazil: Iguacu coffee products Russia: FUJIFILM<br />
India: PPN power plant<br />
<strong>Marubeni</strong> Corporation 2005<br />
supply of machinery and materials, as well as the planning of<br />
entire projects. These activities cover energy, mining, steelmaking,<br />
urban infrastructures and many other industries. Regarding<br />
consumer goods, <strong>Marubeni</strong> has established a wholly owned<br />
photographic film sales company in Moscow to set up a film<br />
sales network. This and other consumer goods businesses are<br />
operated to closely reflect local market needs.<br />
■ India<br />
<strong>Marubeni</strong> is one of the first foreign companies to participate in a<br />
power generation project in India, the PPN power plant near<br />
Chennai that began operations in 2001. The plant has consistently<br />
performed as planned. Negotiations concerning other<br />
power generation projects are under way, including contracts<br />
for the supply of generation and distribution equipment, a traditional<br />
field of strength at <strong>Marubeni</strong>. India has surpassed China<br />
to become the largest recipient of ODA from Japan, pointing to<br />
more growth in infrastructure projects. We plan to continue<br />
targeting the opportunities to help build essential infrastructure<br />
components in India.<br />
India is an important exporter of natural resources. For<br />
example, <strong>Marubeni</strong> is engaged in exporting iron ore and<br />
ferrochrome to Japan, South Korea and China. Against a backdrop<br />
of booming global demand for metal resources, these export<br />
businesses are all performing well. In the energy sector, <strong>Marubeni</strong><br />
has acquired rights in the RAVVA offshore oil and gas field near<br />
Chennai. The field’s daily output is currently 50,000 barrels/day of<br />
crude oil and 2 million cubic meters/day of gas. We are also<br />
involved in the supply of many types of chemical products, a business<br />
that is performing well due to very strong domestic demand.<br />
India is estimated to have twice the amount of arable land as<br />
China. Long an exporter of tea, India thus has the potential to<br />
become an exporter of other agricultural products. We are<br />
examining the feasibility of starting exports of grain, broilers and<br />
other products to Japan and other Asian markets, as well as to<br />
the Middle East.<br />
52 / 53
Financial Section<br />
56 Eleven-Year Summary<br />
<strong>Marubeni</strong> Corporation 2005 54<br />
58 Management’s Discussion and Analysis of<br />
Financial Position and Business Results<br />
70 Consolidated Balance Sheets<br />
72 Consolidated Statements of Income<br />
73 Consolidated Statements of Changes<br />
in Shareholders’ Equity<br />
74 Consolidated Statements of Cash Flows<br />
75 Notes to Consolidated Financial Statements<br />
99 Report of Independent Auditors<br />
54 / 55
Eleven-Year Summary<br />
<strong>Marubeni</strong> Corporation<br />
Years ended March 31<br />
Millions of Yen<br />
Thousands of<br />
U.S. Dollars*<br />
2005 2005 2004 2003<br />
For the year:<br />
Revenues:<br />
Revenues from trading and other activities ..................... ¥2,877,544 $26,892,935 ¥2,624,011 ¥2,520,531<br />
Commissions on services and trading margins ................ 161,108 1,505,682 150,158 160,636<br />
Total ................................................................................. 3,038,652 28,398,617 2,774,169 2,681,167<br />
Total volume of trading transactions .................................... 7,939,437 74,200,346 7,905,640 8,793,303<br />
Gross trading profit ............................................................... 436,055 4,075,280 409,461 424,643<br />
Net income (loss) ................................................................ 41,247 385,486 34,565 30,312<br />
At year-end:<br />
Total assets ......................................................................... 4,208,037 39,327,449 4,254,194 4,321,482<br />
Net interest-bearing debt ..................................................... 1,823,909 17,045,879 1,969,323 2,264,117<br />
Total shareholders’ equity ................................................... 443,152 4,141,607 392,982 260,051<br />
Amounts per 100 shares (¥/US$):<br />
Basic earnings (loss) ............................................................ 2,661 24.87 2,285 2,030<br />
Diluted earnings (loss) .......................................................... 2,231 20.85 2,016 1,896<br />
Cash dividends .................................................................... 400 3.74 300 300<br />
Cash flows (for the year):<br />
Net cash provided by (used in) operating activities .............. 173,824 1,624,523 201,560 194,788<br />
Net cash provided by (used in) investing activities ............... 46,043 430,308 57,983 113,241<br />
Net cash (used in) provided by financing activities ............... (238,057) (2,224,832) (233,938) (294,001)<br />
Cash and cash equivalents at end of year ............................ 459,194 4,291,533 478,731 466,511<br />
Ratios:<br />
Return on assets (%) ............................................................ 1.0 0.8 0.7<br />
Return on equity (%) ............................................................ 9.9 10.6 11.6<br />
Shareholders’ equity to total assets (%) .............................. 10.5 9.2 6.0<br />
Net D/E ratio (times) ............................................................ 4.1 5.0 8.7<br />
Consolidation:<br />
Consolidated subsidiaries ..................................................... 369 348 327<br />
Equity-method affiliates ........................................................ 156 154 157<br />
Total ...................................................................................... 525 502 484<br />
Number of employees:<br />
Consolidated ......................................................................... 24,106 24,417 24,829<br />
Non-consolidated .................................................................. 3,586 3,717 3,914<br />
Stock price (Tokyo Stock Exchange) (¥):<br />
High ...................................................................................... 362 295 151<br />
Low ...................................................................................... 223 106 86<br />
Notes: 1. The presentation of earnings is pursuant to Issue 99-19, “Reporting Revenue Gross as a Principal versus Net as an Agent,” published by the<br />
Financial Accounting Standards Board’s Emerging Issues Task Force. Earnings have also been disclosed in accordance with US GAAP since 2003.<br />
2. For the convenience of investors in Japan, the presentation of net sales is consistent with customary accounting practices in Japan. Furthermore,<br />
while net sales were disclosed by trading transaction category in prior fiscal years, net sales alone will be presented from the fiscal year ended<br />
March 31, 2005.<br />
3. U.S. dollar amounts above and elsewhere in this report are converted from yen, for convenience only, at the prevailing rate of ¥107 to US$1 as<br />
of March 31, 2005.
Millions of Yen<br />
<strong>Marubeni</strong> Corporation 2005<br />
2002 2001 2000 1999 1998 1997 1996 1995<br />
¥ – ¥ – ¥ – ¥ – ¥ – ¥ – ¥ – ¥ –<br />
– – – – – – – –<br />
– – – – – – – –<br />
8,972,245 9,436,863 10,222,442 11,960,157 13,640,517 ¥13,969,977 13,540,560 12,868,962<br />
436,804 479,754 453,496 522,356 534,485 496,550 475,221 460,167<br />
(116,418) 15,036 2,060 (117,729) 17,230 20,113 15,117 10,368<br />
4,805,669 5,320,604 5,584,353 6,511,841 7,388,101 7,550,347 7,644,002 6,844,022<br />
2,712,906 3,089,839 3,328,437 3,966,471 4,432,159 4,555,208 4,403,714 4,079,368<br />
263,895 342,297 324,301 354,017 475,253 512,929 560,589 480,451<br />
(7,792) 1,006 138 (7,880) 1,153 1,346 1,012 694<br />
(7,792) 940 138 (7,880) 1,054 1,289 1,010 694<br />
– – – 300 600 600 600 600<br />
198,456 179,305 184,701 232,414 254,221 24,308 107,547 (99,929)<br />
74,504 187,993 257,006 99,101 (58,769) 66,036 (252,345) (158,296)<br />
(150,104) (456,125) (594,878) (213,321) (91,879) (209,412) 267,217 (4,188)<br />
466,642 329,811 405,308 579,366 480,825 373,015 485,844 359,436<br />
– 0.3 0.0 – 0.2 0.3 0.2 0.2<br />
– 4.5 0.6 – 3.5 3.8 2.9 2.3<br />
5.5 6.4 5.8 5.4 6.4 6.8 7.3 7.0<br />
10.3 9.0 10.3 11.2 9.3 8.9 7.9 8.5<br />
354 412 456 488 479 459 436 410<br />
161 186 190 201 214 203 188 164<br />
515 598 646 689 693 662 624 574<br />
28,140 30,956 31,342 – – – – –<br />
4,234 4,855 5,344 5,844 6,041 6,386 6,702 7,064<br />
262 401 486 345 525 638 602 580<br />
58 200 205 155 177 421 404 415<br />
56 / 57
Management’s Discussion and Analysis of Financial Position<br />
and Business Results<br />
All statements herein regarding future events reflect the judgment of <strong>Marubeni</strong> and its consolidated subsidiaries as of March 31, 2005.<br />
1 Financial Review<br />
(1) Operating Environment<br />
During the fiscal year ended March 31, 2005, the global<br />
economy continued to stage a strong recovery, spearheaded by<br />
strong economic growth in the United States and China. Fueled<br />
by these conditions, demand for energy boomed, causing crude<br />
oil prices to jump sharply beginning in the second half of 2004. In<br />
the U.S., the economy grew steadily, supported by strong capital<br />
investment resulting from higher corporate earnings, as well as<br />
by healthy consumer spending. Product prices, meanwhile,<br />
remained stable as the Federal Reserve Board cautiously raised<br />
interest rates. In contrast, the U.S. current account deficit and<br />
fiscal deficit both rose to record-high levels, putting increased<br />
downward pressure on the dollar. Europe’s modest economic<br />
recovery continued, although the gap became more pronounced<br />
between nations where consumer spending was robust, like the<br />
U.K. and France, and those dependent on exports, such as<br />
Germany and Italy. In Asia, economic growth centered on China<br />
remained on track. Despite a slowdown in investments in capital<br />
goods due to more restrictive government policies, increased<br />
exports and consumer spending lifted the annual growth rate for<br />
the Chinese economy to 9.5% in 2004, surpassing the previousyear<br />
figure. As of December 31, 2004, China’s foreign exchange<br />
reserves topped $600 billion, sparking renewed calls from<br />
around the globe for the country to reform its currency exchange<br />
policies. ASEAN nations, Taiwan and Hong Kong all continued to<br />
post growth, helped along by a favorable balance of exports and<br />
domestic demand, while South Korea’s modest export-led<br />
recovery also stayed on course. In India, healthy consumer<br />
spending was the leading factor behind economic growth. In<br />
Russia, as well as Brazil and other South American nations,<br />
economic growth was strong atop sharply higher exports,<br />
benefiting from rising global demand and soaring prices for<br />
primary commodities, as well as growing domestic demand.<br />
Net Income (Loss)<br />
(Years ended March 31)<br />
(Billions of yen)<br />
2.1<br />
15.0<br />
(116.4)<br />
30.3<br />
34.6<br />
41.2<br />
’00 ’01 ’02 ’03 ’04 ’05<br />
In Japan, the economy held to a recovery track during the first<br />
half of the fiscal year, supported by higher exports, capital<br />
investment and consumer spending. Higher exports reflected<br />
economic growth in Asia, and capital investment rose in line with<br />
improved corporate cash flows and increased demand for<br />
upgrades for plants and equipment, while consumer spending was<br />
supported by an upturn in consumer sentiment. Deflationary<br />
conditions still lingered, however, as the latter half of the year saw<br />
exports and capital investment weaken, impacted by industrywide<br />
cutbacks in electronic component and device production and<br />
slower capital goods investments in China, triggering a slowdown<br />
in the pace of Japan’s economic growth. On the plus side, farreaching<br />
restructuring measures have largely eliminated excess<br />
employment, debt, facilities and equipment in the corporate<br />
sector, enabling companies to post steady earnings growth in the<br />
face of lackluster sales. The positive effects of these trends can<br />
be seen in the overall stability of stock prices in Japan.<br />
(2) Operating Results<br />
For the fiscal year ended March 31, 2005, <strong>Marubeni</strong> and its<br />
consolidated subsidiaries posted record consolidated net<br />
income of ¥41.2 billion, up ¥6.7 billion from the previous record<br />
of ¥34.6 billion posted the prior fiscal year. <strong>Marubeni</strong>’s seven<br />
commodity-related segments (i.e. Agri-Marine Products, Textile,<br />
Forest Products & General Merchandise, Chemicals, Energy,<br />
Metals & Mineral Resources, and Transportation & Industrial<br />
Machinery) accounted for a total of ¥41.5 billion in income,<br />
before the inclusion of loss items.<br />
Gross trading profit was ¥436.1 billion, up ¥26.6 billion. By<br />
operating segment, 12 segments posted higher earnings, while<br />
two segments saw a decrease in earnings.<br />
Selling, general and administrative (SG&A) expenses rose ¥12.9<br />
billion to ¥342.9 billion. By item, the largest component of this<br />
increase was personnel expenses, which climbed ¥4.7 billion to<br />
Gross Trading Profit<br />
(Years ended March 31)<br />
(Billions of yen)<br />
453.5<br />
479.8<br />
436.8<br />
424.6<br />
409.5<br />
436.1<br />
’00 ’01 ’02 ’03 ’04 ’05
¥162.5 billion, followed by operational outsourcing costs. The<br />
latter increased by ¥6.0 billion to ¥20.7 billion, primarily due to the<br />
consolidation of equity-method affiliates.<br />
The provision for doubtful accounts rose ¥5.5 billion to ¥6.3 billion,<br />
largely due to an increase in allowances for overseas receivables.<br />
Interest income rose ¥3.0 billion to ¥23.4 billion, mainly as<br />
the result of income from overdue interest. Interest expense,<br />
meanwhile, improved ¥0.2 billion to ¥43.6 billion, primarily due<br />
to lower interest-bearing debt. This improvement came despite<br />
additional debt resulting from the consolidation of equitymethod<br />
affiliates.<br />
Dividend income rose ¥1.8 billion from the previous year to ¥9.0<br />
billion. Of this figure, ¥3.9 billion (¥2.8 billion in Japan, ¥1.1 billion<br />
from overseas) was received by the parent company. Domestic<br />
consolidated subsidiaries received dividends of ¥0.6 billion, with<br />
overseas subsidiaries receiving dividends of ¥4.5 billion.<br />
Impairment loss on investment securities was ¥7.4 billion, an<br />
improvement of ¥3.0 billion. This was due mostly to the ¥6.0<br />
billion charge in the previous fiscal year related to the devaluation<br />
of shareholdings in Sithe Energies, Inc.<br />
Gain on sales of investment securities was ¥36.1 billion, a yearon-year<br />
improvement of ¥9.6 billion. This was mainly attributable<br />
to gains on the sale of listed stocks of ¥27.6 billion, an increase of<br />
¥13.5 billion compared to the previous fiscal year.<br />
The loss on property, plant and equipment increased ¥9.0 billion<br />
compared with the previous fiscal year to ¥10.5 billion, as gains<br />
from the sale of property, plant and equipment at overseas<br />
subsidiaries were offset by devaluation losses on factories and<br />
facilities, as well as on real estate holdings by the parent company.<br />
Other—net increased by ¥18.5 billion during the year to ¥36.5<br />
billion, and consisted largely of an allowance of ¥21.3 billion for<br />
losses accompanying the withdrawal from petrochemical<br />
operations in Indonesia.<br />
Selling, General and Administrative Expenses<br />
(Years ended March 31)<br />
(Billions of yen)<br />
411.5<br />
400.4<br />
392.1<br />
345.6<br />
330.0<br />
342.9<br />
’00 ’01 ’02 ’03 ’04 ’05<br />
<strong>Marubeni</strong> Corporation 2005<br />
Equity in earnings of affiliated companies—net was ¥20.7<br />
billion, up ¥6.4 billion, mainly due to a strong performance by<br />
<strong>Marubeni</strong>-Itochu Steel Inc.<br />
(3) Business Results by Operating Segment<br />
Agri-Marine Products transactions increased ¥123.0 billion, or<br />
14.4%, to ¥979.9 billion. The bulk of transactions were related to<br />
food distribution and livestock feed. Tracking the increase in food<br />
distribution-related transactions, gross trading profit rose ¥9.9<br />
billion, or 16.1%, to ¥71.3 billion. Following <strong>Marubeni</strong>’s selection<br />
as a corporate rehabilitation sponsor for Japanese retailer The<br />
Daiei, Inc. in March 2005, <strong>Marubeni</strong>, in May, subscribed in part to<br />
a private placement of shares by Daiei valued at ¥18.6 billion.<br />
Textile transactions edged ¥2.4 billion, or 0.7%, higher to ¥355.3<br />
billion, mostly due to an increase in product-driven transactions.<br />
Accordingly, gross trading profit rose ¥1.3 billion, or 5.3%, to<br />
¥25.2 billion.<br />
Forest Products & General Merchandise transactions were up<br />
¥20.9 billion, or 2.7%, to ¥792.4 billion. This was due to higher<br />
transaction volume for plywood, pulp and wood chips, among<br />
other materials. Gross trading profit rose ¥4.6 billion, or 11.0%, to<br />
¥46.6 billion. Alongside increased transactions, gross trading profit<br />
benefited from higher profits from a paper-related consolidated<br />
operating company and improved wood chip profitability.<br />
Chemicals transactions climbed ¥102.9 billion, or 18.2%, to<br />
¥667.5 billion, reflecting sharply higher transactions for basic<br />
chemicals and improved plastic transactions against a backdrop of<br />
escalating market prices. Benefiting from these increases and<br />
higher profits largely from agrochemical-related businesses, gross<br />
trading profit rose ¥1.9 billion, or 7.7%, to ¥26.9 billion.<br />
Energy transactions were ¥1,774.0 billion, a decline of ¥221.1<br />
billion, or 11.1% year on year, attributable to a decrease in<br />
petroleum-related transactions. Gross trading profit rose ¥11.3<br />
58 / 59
Management’s Discussion and Analysis of Financial Position and Business Results<br />
billion, or 36.7%, to ¥42.1 billion, mostly the result of higher<br />
earnings from projects in which <strong>Marubeni</strong> holds an equity interest.<br />
Metals & Mineral Resources transactions, buoyed by higher<br />
prices for coal, raw materials for steel making, and non-ferrous<br />
metals, climbed ¥116.1 billion, or 23.5%, to ¥609.3 billion.<br />
Reflecting this growth, gross trading profit climbed ¥3.5 billion, or<br />
29.2%, to ¥15.7 billion.<br />
Transportation & Industrial Machinery transactions edged ¥5.0<br />
billion, or 0.6%, lower to ¥777.6 billion. This decrease stemmed<br />
from a decline in aircraft and defense-related transactions, which<br />
offset increased transactions related to automobiles and construction<br />
machinery. Gross trading profit, however, rose ¥0.3 billion, or<br />
0.6%, to ¥56.1 billion, primarily due to higher profits from<br />
industrial machinery-related transactions.<br />
Operating Segment Information<br />
Millions of Yen Thousands of U.S. Dollars Millions of Yen<br />
Trading Transactions 2005 2005 2004 2003<br />
Agri-Marine Products ..................................... ¥ 979,855 $ 9,157,523 ¥ 856,810 ¥1,023,513<br />
Textile ............................................................ 355,311 3,320,664 352,864 370,277<br />
Forest Products & General Merchandise ....... 792,377 7,405,393 771,508 745,776<br />
Chemicals ...................................................... 667,473 6,238,065 564,526 569,928<br />
Energy ............................................................ 1,773,951 16,578,981 1,995,014 2,309,753<br />
Metals & Mineral Resources ......................... 609,2744 5,694,150 493,206 442,344<br />
Transportation & Industrial Machinery ........... 777,592 7,267,215 782,603 776,578<br />
Utility & Infrastructure .................................... 379,343 3,545,262 361,018 421,850<br />
Plant & Ship ................................................... 489,437 4,574,178 613,097 736,476<br />
Development & Construction ........................ 196,844 1,839,664 178,748 185,840<br />
Finance & Logistics Business ........................ 21,313 199,187 17,891 37,834<br />
Telecom & Information (IT Business) ............. 175,848 1,643,439 167,762 386,162<br />
Domestic Branches and Offices .................... 141,992 1,327,028 159,246 172,935<br />
Overseas Corporate Subsidiaries and Branches ... 1,070,212 10,001,981 1,035,614 1,065,367<br />
Corporate and Elimination .............................. (491,385) (4,592,384) (444,267) (451,330)<br />
Consolidated .................................................. ¥7,939,437 $74,200,346 ¥7,905,640 ¥8,793,303<br />
Millions of Yen Thousands of U.S. Dollars Millions of Yen<br />
Gross Trading Profit 2005 2005 2004 2003<br />
Agri-Marine Products ..................................... ¥ 71,312 $ 666,467 ¥ 61,436 ¥ 58,559<br />
Textile ............................................................ 25,174 235,271 23,914 24,494<br />
Forest Products & General Merchandise ....... 46,612 435,626 42,009 41,242<br />
Chemicals ...................................................... 26,857 251,000 24,945 29,279<br />
Energy ............................................................ 42,132 393,757 30,817 29,615<br />
Metals & Mineral Resources ......................... 15,709 146,813 12,163 13,984<br />
Transportation & Industrial Machinery ........... 56,098 524,280 55,769 54,371<br />
Utility & Infrastructure .................................... 22,646 211,645 20,567 11,832<br />
Plant & Ship ................................................... 13,332 124,598 8,836 13,866<br />
Development & Construction ........................ 27,530 257,290 27,909 34,027<br />
Finance & Logistics Business ........................ 5,785 54,065 4,900 6,523<br />
Telecom & Information (IT Business) ............. 24,483 228,813 19,952 32,559<br />
Domestic Branches and Offices .................... 4,898 45,776 5,427 6,081<br />
Overseas Corporate Subsidiaries and Branches ... 76,517 715,112 73,458 72,827<br />
Corporate and Elimination .............................. (23,030) (215,233) (2,641) (4,616)<br />
Consolidated .................................................. ¥436,055 $4,075,280 ¥409,461 ¥424,643<br />
Note: Trading transactions have been prepared according to accounting principles generally accepted in Japan.<br />
Utility & Infrastructure transactions were up ¥18.3 billion, or<br />
5.1%, to ¥379.3 billion due largely to an increase in overseas IPP<br />
business operating companies. Gross trading profit rose ¥2.1<br />
billion, or 10.1%, to ¥22.6 billion due to the growth in transactions.<br />
Plant & Ship transactions declined ¥123.7 billion, or 20.2%, to<br />
¥489.4 billion mainly because of fewer energy and chemical plant<br />
transactions. Despite an initial drop reflecting this decline, gross<br />
trading profit soared ¥4.5 billion, or 50.9%, to ¥13.3 billion, largely<br />
from the consolidation of shipping-related operating companies.<br />
In April 2005, <strong>Marubeni</strong> subsidiary Japan Indonesia Petrochemical<br />
Investment Corporation sold financial assets related to its<br />
Chandra Asri petrochemical operations to Commerzbank<br />
International <strong>Trust</strong> (Singapore) Ltd. In exchange, a basic
agreement was reached for the acquisition of shares in P.T. Mushi<br />
Pulp and its related operations and assets.<br />
Development & Construction transactions were up ¥18.1 billion,<br />
or 10.1%, to ¥196.8 billion, lifted by an increase in domestic real<br />
estate fund brokerage and agency transactions. Gross trading<br />
profit dipped ¥0.4 billion, or 1.4%, to ¥27.5 billion, as lower<br />
transactions from declining condominium sales and the transfer of<br />
domestic construction operations overshadowed higher profits<br />
from overseas residential housing operations.<br />
Finance & Logistics Business transactions increased ¥3.4 billion,<br />
or 19.1%, to ¥21.3 billion, due to higher fund and logistics-related<br />
transactions. Benefiting from higher fund-related transactions,<br />
gross trading profit climbed ¥0.9 billion, or 18.1%, to ¥5.8 billion.<br />
Telecom & Information transactions were up ¥8.1 billion from<br />
the previous year, or 4.8%, to ¥175.8 billion, the result of higher<br />
transactions from communications-related operations. Due to<br />
this growth, gross trading profit rose ¥4.5 billion, or 22.7%, to<br />
¥24.5 billion.<br />
Domestic Branches and Offices transactions, impacted by lower<br />
transactions related to machinery and the transfer of commercial<br />
rights, decreased ¥17.3 billion, or 10.8%, to ¥142.0 billion. Gross<br />
trading profit was ¥4.9 billion, a decline of ¥0.5 billion, or 9.7%,<br />
compared to the previous year.<br />
Overseas Corporate Subsidiaries and Branches transactions<br />
increased ¥34.6 billion, or 3.3% year on year, to ¥1,070.2 billion,<br />
mostly due to higher automobile, construction machinery and<br />
agrochemical-related transactions in the U.S. Gross trading profit<br />
was up ¥3.1 billion, or 4.2%, to ¥76.5 billion, mainly due to higher<br />
earnings from agrochemical-related operations in the U.S.<br />
Total Volume of Trading Transactions<br />
by Region<br />
(Years ended March 31)<br />
Billions of Yen<br />
2005 2004<br />
Japan ........................................ ¥6,977.5 ¥6,925.4<br />
North America .......................... 1,025.1 1,430.8<br />
Europe ...................................... 407.0 368.3<br />
Asia & Oceania ......................... 645.9 564.8<br />
Other Regions .......................... 980.5 825.4<br />
Note: Trading transactions have been prepared according to accounting<br />
principles generally accepted in Japan.<br />
(4) Business Results by Geographic Region<br />
Japan<br />
<strong>Marubeni</strong> Corporation 2005<br />
Trading transactions increased ¥52.1 billion, or 0.8%, to ¥6,977.5<br />
billion, mostly from growth in transactions related to Agri-Marine<br />
Products. Operating profit fell ¥16.3 billion, or 32.9%, to ¥33.3<br />
billion, mainly due to a decline in earnings from Utility & Infrastructure<br />
and Plant & Ship-related business.<br />
North America<br />
Trading transactions were down ¥405.7 billion, or 28.4%, to<br />
¥1,025.1 billion, hampered mainly by lower Energy-related<br />
transactions. Operating profit, however, was buoyed by higher<br />
earnings from the same transactions, surging ¥8.2 billion, or<br />
147.2%, to ¥13.8 billion.<br />
Europe<br />
Trading transactions increased ¥38.8 billion, or 10.5%, to ¥407.0<br />
billion, positively influenced primarily by higher transactions from<br />
Utility & Infrastructure-related business. Operating profit, meanwhile,<br />
increased ¥5.2 billion, or 75.9%, to ¥12.1 billion, largely<br />
atop higher earnings from Energy-related transactions.<br />
Asia and Oceania<br />
Trading transactions rose ¥81.1 billion, or 14.4%, to ¥645.9 billion,<br />
primarily due to a higher volume of Chemicals and Utility &<br />
Infrastructure-related business. This higher transaction volume in<br />
Utility & Infrastructure-related business lifted operating profit ¥4.7<br />
billion, or 37.4%, to ¥17.1 billion.<br />
Profitability Comparison of Consolidated<br />
Companies<br />
(Years ended March 31)<br />
(Companies)<br />
480<br />
80.3%<br />
’01 ’02 ’03 ’04 ’05<br />
Profitable companies Unprofitable companies<br />
Percentage of profitable companies<br />
391<br />
(118)<br />
75.9%<br />
375<br />
(124)<br />
77.5%<br />
390<br />
(109)<br />
77.7%<br />
422<br />
(112)<br />
80.4%<br />
(103)<br />
60 / 61
Management’s Discussion and Analysis of Financial Position and Business Results<br />
Other Regions<br />
Trading transactions climbed ¥155.1 billion, or 18.8%, to ¥980.5<br />
billion, boosted mainly by higher Energy and Plant & Ship-related<br />
transactions. Operating profit soared ¥5.1 billion, or 103.2%, to<br />
¥10.0 billion, mainly because of higher earnings from Plant &<br />
Ship transactions.<br />
Please note that figures for trading transactions and operating<br />
profit have been prepared according to accounting principles<br />
generally accepted in Japan.<br />
(5) Business Results from Principal Consolidated<br />
Subsidiaries and Affiliates<br />
In terms of the operating results of consolidated subsidiaries in<br />
the fiscal year ended March 31, 2005, out of 369 consolidated<br />
subsidiaries (131 domestic, 238 overseas) and 156 affiliates (47<br />
domestic, 109 overseas), 422 companies were profitable. The<br />
percentage of companies achieving profitability was 80.4%, an<br />
improvement of 2.7 percentage points compared to 77.7% in the<br />
previous fiscal year, and exceeded 80% for the first time in four<br />
fiscal years.<br />
The 422 profitable companies generated a total profit of ¥92.7<br />
billion, ¥28.9 billion more than the ¥63.8 billion in profit posted a<br />
year earlier. In contrast, the 103 unprofitable companies generated<br />
a total loss of ¥51.0 billion, up ¥7.6 billion from the loss of ¥43.4<br />
billion recorded a year ago. The end-result was a net profit of<br />
¥41.7 billion, more than double the ¥20.4 billion in net profit<br />
posted in the previous fiscal year.<br />
Total Assets<br />
(At March 31)<br />
5,584.4<br />
5,320.6<br />
4,805.7<br />
4,321.5<br />
4,254.2<br />
4,208.0<br />
2 Liquidity and Funding Sources<br />
(1) Financial Position<br />
Consolidated total assets declined ¥46.2 billion to ¥4,208.0<br />
billion. <strong>Marubeni</strong> enacted a review of underperforming transactions<br />
and sold assets, resulting in fewer notes and accounts<br />
receivable—trade. These sales offset an increase primarily in<br />
property, plant and equipment from investment mainly in new<br />
energy projects overseas.<br />
Total shareholders’ equity rose ¥50.2 billion to ¥443.2 billion. In<br />
addition to an increase in net income to ¥41.2 billion, there was an<br />
¥11.7 billion improvement in net unrealized gain on investment<br />
securities due mostly to a recovery in the stock market.<br />
Consolidated interest-bearing debt declined ¥168.4 billion to<br />
¥2,286.4 billion. Net interest-bearing debt, after deduction of cash<br />
and cash equivalents, fell ¥145.4 billion to ¥1,823.9 billion. As a<br />
result, the net D/E ratio improved 0.89 of a point to 4.12 times,<br />
from 5.01 times at the previous fiscal year-end. With this performance,<br />
the Company effectively achieved ahead of schedule the<br />
“V” PLAN objectives targeted for completion by the close of the<br />
current fiscal year, namely net interest-bearing debt of ¥2 trillion or<br />
less, and a net D/E ratio of between 4 to 5 times.<br />
* Net interest-bearing debt is calculated as the sum of interestbearing<br />
debt (including short-term loans, long-term debt and<br />
commercial paper) and corporate bonds (including convertible<br />
bonds), minus cash deposits.<br />
Shareholders’ Equity<br />
(At March 31)<br />
(Billions of yen) ’00 ’01 ’02 ’03 ’04 ’05<br />
(Billions of yen) ’00 ’01 ’02 ’03 ’04 ’05<br />
324.3<br />
342.3<br />
263.9<br />
260.1<br />
393.0<br />
443.2
(2) Liquidity<br />
<strong>Marubeni</strong> and its consolidated subsidiaries maintain a sufficient<br />
level of liquidity mainly through cash and deposits and the<br />
establishment of credit facilities.<br />
As of March 31, 2005, cash and deposits totaled ¥462.5 billion.<br />
Details regarding credit facilities are as follows:<br />
• Parent company<br />
— ¥415.0 billion from a syndicate of major and regional<br />
Japanese banks (short term: ¥215.0 billion, long term:<br />
¥200.0 billion)<br />
• Overseas finance subsidiary<br />
—US$35 million from a major Japanese bank (short term)<br />
• <strong>Marubeni</strong> Corporation, <strong>Marubeni</strong> America Corporation,<br />
<strong>Marubeni</strong> Europe plc, and <strong>Marubeni</strong> Finance Holland B.V.<br />
— These four companies have available credit facilities (short<br />
term) totaling US$380 million, secured mainly through major<br />
European and U.S. banks.<br />
In addition to these credit facilities, the Company holds highly<br />
liquid marketable securities. In all, these assets provide sufficient<br />
liquidity to cover short-term loans and the current portion of longterm<br />
debt, which totaled ¥659.1 billion as of March 31, 2005.<br />
Net Interest-Bearing Debt<br />
(At March 31)<br />
3,328.4<br />
3,089.8<br />
2,712.9<br />
2,264.1<br />
1,969.3<br />
1,823.9<br />
(Billions of yen) ’00 ’01 ’02 ’03 ’04 ’05<br />
Net D/E Ratio<br />
(At March 31)<br />
10.3<br />
9.0<br />
(Times) ’00 ’01 ’02 ’03 ’04 ’05<br />
10.3<br />
8.7<br />
<strong>Marubeni</strong> Corporation 2005<br />
(3) Fund Procurement<br />
The fundamental policy of <strong>Marubeni</strong> and its consolidated subsidiaries<br />
is to maintain an optimal mix of funding in line with the<br />
requirements of its asset portfolio. The goal is to sustain a stable<br />
level of liquidity while trimming financing costs. Funding sources<br />
included indirect procurement from banks, life insurers and other<br />
financial institutions, and direct procurement through the issuance<br />
of bonds, commercial paper and other means.<br />
<strong>Marubeni</strong> has established the following programs to procure<br />
funds directly from capital markets.<br />
• Shelf registration for the public sale of ordinary bonds in Japan:<br />
¥500.0 billion<br />
• Commercial paper program<br />
—<strong>Marubeni</strong> Europe plc (U.K.): US$300 million; <strong>Marubeni</strong><br />
International Finance p.l.c. (U.K.): US$900 million<br />
• Euro Medium-term Note Program<br />
—Parent company: US$2 billion<br />
— Four-company joint program (<strong>Marubeni</strong> America Corporation,<br />
<strong>Marubeni</strong> Europe plc; <strong>Marubeni</strong> International Finance p.l.c.,<br />
<strong>Marubeni</strong> Finance Holland B.V.): US$5.0 billion<br />
5.0<br />
4.1<br />
62 / 63
Management’s Discussion and Analysis of Financial Position and Business Results<br />
To aid in procuring funds from capital markets, <strong>Marubeni</strong> has<br />
acquired credit ratings from Moody’s Investors Service (Moody’s),<br />
Standard & Poor’s (S&P), Rating and Investment Information, Inc.<br />
(R&I), and Japan Credit Rating Agency, Ltd. (JCR).<br />
In December 2004, R&I upgraded <strong>Marubeni</strong>’s long-term rating<br />
from BB+ to BBB-, and upgraded its short-term rating from a-3 to<br />
a-2. In January 2005, JCR upgraded <strong>Marubeni</strong>’s long-term rating<br />
from BBB+ to A-, and its short-term rating from J-2 to J-1.<br />
Similarly, in March 2005, S&P upgraded the Company’s long-term<br />
rating from BB- to BB. In May, Moody’s upgraded <strong>Marubeni</strong>’s longterm<br />
rating from Ba2 to Baa3, and its short-term rating from Not-<br />
Prime to Prime-3.<br />
<strong>Marubeni</strong> remains committed to conducting portfolio management,<br />
enhancing risk management and taking other actions<br />
needed to raise its profitability and credit ratings even higher.<br />
(4) Cash Flows<br />
Net cash provided by operating activities was ¥173.8 billion, or<br />
¥27.7 billion less than a year earlier. Net cash provided by<br />
investing activities was ¥46.0 billion, owing to the sales and<br />
redemptions of marketable and investment securities, and the<br />
collection of loans receivable. The result was free cash inflow for<br />
the year of ¥219.9 billion. Net cash used in financing activities was<br />
¥238.1 billion, as free cash inflow was used for the repayment of<br />
short-term loans and long-term debt. Cash and cash equivalents at<br />
the fiscal year-end amounted to ¥459.2 billion, or ¥19.5 billion<br />
lower than at the previous fiscal year-end.<br />
3 Risk Information<br />
(1) Risks Regarding Overall <strong>Marubeni</strong> Operations<br />
a. Impact of the Japanese and global economies on <strong>Marubeni</strong><br />
and its consolidated subsidiaries<br />
<strong>Marubeni</strong> and its consolidated subsidiaries are active in Japan and<br />
over 70 other countries as a general trading company, and conduct<br />
an array of commercial and investment activities over a wide<br />
range of industries and fields. Examples include the production<br />
and procurement of natural resources and other primary commodities,<br />
as well as the manufacture and sale of finished goods. As a<br />
result, the <strong>Marubeni</strong> Group is impacted by the economic conditions<br />
prevailing in Japan and other countries where it has<br />
operations, as well as by the state of the global economy as a<br />
whole. Worsening economic conditions on either of these fronts<br />
could adversely affect the operating activities, performance and<br />
financial position of <strong>Marubeni</strong> and its consolidated subsidiaries.<br />
b. Credit risks regarding business partners<br />
<strong>Marubeni</strong> and its consolidated subsidiaries extend credit to<br />
business partners in the form of accounts receivables, advances,<br />
loans, guarantees and other means. The incurrence of credit risk<br />
due to the inability of business partners to fulfill their credit<br />
obligations could negatively impact the Company’s business<br />
results and financial position.<br />
To ward off credit risks, <strong>Marubeni</strong> and its consolidated<br />
subsidiaries conduct extensive risk management at the credit<br />
screening stage. Nevertheless, <strong>Marubeni</strong> can offer no guarantee<br />
that these measures will be sufficient to avoid credit risks. In<br />
preparation for the incurrence of possible losses when credit risk<br />
becomes apparent, <strong>Marubeni</strong> and its consolidated subsidiaries<br />
establish allowances for doubtful accounts based on the estimated<br />
amount of the loss, the business partner’s creditworthiness,<br />
collateral value and other set factors. In the event of such<br />
losses, however, the Company cannot guarantee that actual<br />
losses will not exceed these established allowances.<br />
c. Risk of breach of contract by business partners<br />
As part of sales activities, <strong>Marubeni</strong> and its consolidated subsidiaries<br />
conclude merchandise supply, subcontracting, operational<br />
outsourcing, and other types of contracts with business partners.<br />
A breach of contract by these business partners could adversely<br />
affect the Company’s business results and financial condition.<br />
d. Investment risk<br />
<strong>Marubeni</strong> and its consolidated subsidiaries, both independently<br />
and in collaboration with other companies, establish new<br />
companies and purchase existing enterprises in the course of<br />
their business operations. Most of these business investments<br />
are of minimal liquidity and require sizeable amounts of capital.<br />
<strong>Marubeni</strong> or its consolidated subsidiaries may be unable to<br />
withdraw from such businesses in an optimal manner or<br />
timeframe, which could inevitably require the commitment of an<br />
additional expenditure of capital.<br />
A decline in the value of these investments or the necessity of<br />
additional expenditures of capital could adversely affect the<br />
Company’s business results and financial condition. In an effort to<br />
prevent the occurrence of risks associated with investments and<br />
other activities, <strong>Marubeni</strong> and its consolidated subsidiaries<br />
conduct extensive risk management, including checking new<br />
investments to determine whether expected returns are commensurate<br />
with the risks involved. Nevertheless, the <strong>Marubeni</strong> Group<br />
can offer no guarantee that these measures will be sufficient to<br />
avoid these risks.
e. Concentrated risk exposure<br />
As part of commercial and investment activities, <strong>Marubeni</strong> and its<br />
consolidated subsidiaries are concentrated in specific investment<br />
targets, markets and regions, such as plant-related business, realestate<br />
business in Japan, and sales activities in Indonesia and the<br />
Philippines. As a result, lackluster performance by these investment<br />
targets, or a deteriorating operating environment in these markets<br />
or regions, could adversely affect the business results and financial<br />
condition of <strong>Marubeni</strong> and its consolidated subsidiaries.<br />
f. Ability to procure funds and procurement cost<br />
<strong>Marubeni</strong> and its consolidated subsidiaries engage in fund<br />
procurement with an emphasis on maintaining an optimal mix of<br />
funding in line with the requirements of their respective asset<br />
portfolios and ensuring liquidity. However, significant disruptions in<br />
major global capital markets, or a sharp downgrade in the credit<br />
ratings of <strong>Marubeni</strong> and its consolidated subsidiaries by ratings<br />
agencies, could constrain fund procurement or lead to an increase<br />
in fund procurement cost, which may adversely affect the<br />
business results and financial condition of <strong>Marubeni</strong> and its<br />
consolidated subsidiaries.<br />
g. Fluctuations in the price of goods and merchandise<br />
Because <strong>Marubeni</strong> and its consolidated subsidiaries handle a<br />
variety of merchandise, changes in their respective market<br />
conditions can adversely affect business performance. To mitigate<br />
the risk of fluctuations in market conditions for certain merchandise,<br />
contracts and scheduled contracts, <strong>Marubeni</strong> and its<br />
consolidated subsidiaries enter into commodity futures and<br />
forward contracts. However, the Company cannot guarantee that<br />
these hedge transactions will completely cover its exposure in<br />
these areas.<br />
h. Impairment of real estate, machinery and equipment, and<br />
other property, plant and equipment<br />
<strong>Marubeni</strong> and its consolidated subsidiaries hold real estate,<br />
machinery and equipment, and other property, plant and equipment<br />
for sale and lease to other parties as well as for their own<br />
use. A decline in the intrinsic value of these assets could force the<br />
<strong>Marubeni</strong> Group to book impairment losses. <strong>Marubeni</strong> and its<br />
consolidated subsidiaries apply accounting principles generally<br />
accepted in the United States (US GAAP) in an effort to enact<br />
suitable impairment measures for property, plant and equipment.<br />
A dramatic decline in asset value could nonetheless have a<br />
negative impact on the <strong>Marubeni</strong> Group’s business results and<br />
financial position.<br />
<strong>Marubeni</strong> Corporation 2005<br />
i. Fluctuations in foreign currency exchange rates<br />
<strong>Marubeni</strong> and its consolidated subsidiaries conduct transactions<br />
under a variety of currencies and terms, which exposes<br />
<strong>Marubeni</strong>’s business results to fluctuations in currency exchange<br />
rates. To mitigate the risk of exchange rate fluctuations associated<br />
with transactions, receivables and liabilities denominated in<br />
foreign currencies, <strong>Marubeni</strong> and its consolidated subsidiaries<br />
enter into forward-exchange contracts and other derivative<br />
transactions. However, the Company cannot guarantee that<br />
these hedge transactions will completely cover its exposure in<br />
these areas.<br />
j. Fluctuations in interest rates<br />
<strong>Marubeni</strong> and its consolidated subsidiaries procure necessary<br />
funds from financial institutions, the issuance of bonds and other<br />
means from capital markets. Further, net interest-bearing debt is<br />
procured at fixed interest rates and variable interest rates. While<br />
the interest risk of the majority of the operating assets held by<br />
<strong>Marubeni</strong> and its consolidated subsidiaries offset the interest rate<br />
risk associated with debt, changes in market interest rates could<br />
adversely affect the Company’s earnings. Through asset-liability<br />
management, <strong>Marubeni</strong> and its consolidated subsidiaries utilize<br />
interest rate swaps and other agreements to mitigate the risk of<br />
interest rate fluctuations. However, the Company cannot guarantee<br />
that these hedge transactions will completely cover its<br />
exposure in this area.<br />
k. Gains and losses from marketable debt and equity securities<br />
To strengthen business relationships and for other purposes,<br />
<strong>Marubeni</strong> and its consolidated subsidiaries invest in marketable<br />
debt securities, marketable equity securities and other types of<br />
securities. At the time of purchase, these securities are classified<br />
as trading, held-to-maturity, or available-for-sale securities, in<br />
accordance with Statement of Financial Accounting Standards No.<br />
115, Accounting for Certain Investments in Debt and Equity<br />
Securities, published by the Financial Accounting Standards Board<br />
(FASB) of the United States.<br />
Trading and available-for-sale securities held by <strong>Marubeni</strong> and<br />
its consolidated subsidiaries carry the risk of fluctuations in original<br />
value due to changes in fair value. The posting of losses on the<br />
devaluation of these securities at low points in fair value may<br />
adversely affect the business results and financial condition of<br />
<strong>Marubeni</strong> and its consolidated subsidiaries.<br />
64 / 65
Management’s Discussion and Analysis of Financial Position and Business Results<br />
l. Laws and regulations<br />
In the course of operations, <strong>Marubeni</strong> and its consolidated<br />
subsidiaries are subject to a broad range of laws and regulations<br />
both in Japan and other applicable countries. Changes in or<br />
unanticipated interpretations of these laws and regulations could<br />
increase the obligations pertaining to legal and regulatory<br />
compliance placed on <strong>Marubeni</strong> and its consolidated subsidiaries.<br />
Accordingly, changes or altered interpretations of laws and<br />
regulations may result in punitive measures, including the<br />
interruption of <strong>Marubeni</strong>’s operating activities, lower the<br />
Company’s credibility or cause the occurrence of other circumstances<br />
that could adversely impact the Company’s business<br />
results or financial conditions.<br />
m. Significant litigation<br />
In the course of business activities in Japan and overseas,<br />
<strong>Marubeni</strong> and its consolidated subsidiaries may be party to<br />
litigation, disputes and other legal proceedings. When party to<br />
such litigation, predicting the outcome is impossible given the<br />
inherent uncertainty of these matters. The Company cannot<br />
guarantee that such litigation will not adversely affect the<br />
business results and financial condition of <strong>Marubeni</strong> and its<br />
consolidated subsidiaries.<br />
n. Other risks inherent and related to overall <strong>Marubeni</strong><br />
operations<br />
Negligence on the part of employees charged with executing<br />
business operations, and malfunctions pertaining to computer<br />
systems supporting business activities are among the other risks<br />
that may adversely affect the business results and financial<br />
condition of <strong>Marubeni</strong> and its consolidated subsidiaries.<br />
(2) Risk Management<br />
<strong>Marubeni</strong> and its consolidated subsidiaries operate an integrated<br />
decision-making process, which is deployed when assessing the<br />
provision of credit facilities, investments and other key matters<br />
on a case-by-case basis. When investigating new business<br />
opportunities and other important projects, the <strong>Marubeni</strong> Group<br />
is obligated to report regularly to the Corporate Management<br />
Committee and similar management bodies, and this duty is<br />
reflected in related decision-making. In this way, the <strong>Marubeni</strong><br />
Group seeks to circumvent risks by enhancing risk management<br />
on a case-by-case basis.<br />
With a view to mitigating risk company-wide, the <strong>Marubeni</strong><br />
Group has an integrated risk management system in place to<br />
ascertain a range of quantifiable or measurable risks. Examples<br />
include market, credit and investment risks associated with<br />
specific countries, business formats, and customers. In this<br />
integrated system, fundamental risk management policies and<br />
internal regulations are formulated to ensure proper decisionmaking<br />
and monitoring of these risks. Likewise, organizations,<br />
management systems, management options and systems<br />
infrastructure are also kept in place for executing these policies<br />
and regulations.<br />
For compliance risk and other difficult to quantify or immeasurable<br />
risks, the <strong>Marubeni</strong> Group strives to prevent these risks<br />
systemically by enhancing corporate governance, putting internal<br />
control systems in place and bolstering its compliance structure.<br />
Nevertheless, numerous risks can arise during the course of<br />
the wide-ranging operations of <strong>Marubeni</strong> and its consolidated<br />
subsidiaries. Moreover, the risk management framework operated<br />
by the <strong>Marubeni</strong> Group may be unable to prevent the occurrence<br />
of a variety of risks that carry the possibility of future occurrence.<br />
As a result, the <strong>Marubeni</strong> Group cannot guarantee its ability to<br />
completely manage such risks.<br />
(3) The New Medium-term Management Plan<br />
<strong>Marubeni</strong> and its consolidated subsidiaries embarked on a threeyear<br />
medium-term management plan, the “V” PLAN, from April<br />
2003. With the goal of improving <strong>Marubeni</strong>’s financial position and<br />
strengthening its earnings base, the plan aims to achieve<br />
consolidated net income of ¥50.0 billion, consolidated net interestbearing<br />
debt of ¥2 trillion or less, and a net D/E ratio of 5 times or<br />
less by the fiscal year ending March 31, 2006. However, these<br />
objectives were prepared based on certain assumptions, hypotheses<br />
and projections regarding the persistence of certain economic<br />
conditions, industry trends, and other concerns. A number<br />
of unknown and uncontrollable factors could prevent the Company<br />
from achieving these objectives.<br />
(4) Uncertainty Regarding Financial Condition and<br />
Changes in Operating Results<br />
Factors that have caused the performance and financial condition<br />
of <strong>Marubeni</strong> and its consolidated subsidiaries to fluctuate in the<br />
past include the following items: gains and losses on the sale of<br />
real estate and devaluation losses pertaining to real estate;
ealized gains and losses and devaluation losses associated with<br />
marketable and investment securities; allowances for bad debt,<br />
and losses stemming from the realignment of <strong>Marubeni</strong> Group<br />
companies. To improve their financial position, <strong>Marubeni</strong> and its<br />
consolidated subsidiaries have taken steps to reduce total assets<br />
and net interest-bearing debt, reduce or establish allowances for<br />
underperforming and unprofitable assets, pare down expenses,<br />
shift resources to high-growth fields, and minimize exposure to<br />
high-risk assets. While <strong>Marubeni</strong> and its consolidated subsidiaries<br />
are confident that substantial progress has been made in enhancing<br />
their financial positions, there is no guarantee that greater<br />
losses will not be posted in the future.<br />
4 Significant Estimates<br />
<strong>Marubeni</strong> prepares its consolidated financial statements in<br />
accordance with accounting principles generally accepted and<br />
recognized in the United States. In preparing important accounting<br />
policies and these statements, certain accounting estimates and<br />
assumptions are utilized as needed when calculating assets and<br />
liabilities as of the fiscal year-end, the disclosure of contingent<br />
assets and liabilities, and earnings and expenses incurred during<br />
the year. In determining accounting estimates and assumptions,<br />
management makes what it believes to be a reasonable inference<br />
of these amounts based on past experience and on a case-by-case<br />
basis. Estimates and assumptions made in this way have an<br />
inherent degree of uncertainty, and actual results could differ from<br />
those estimates. Management considers the following estimates<br />
and assumptions will have a material impact on the Company’s<br />
consolidated financial statements.<br />
Allowances for doubtful accounts<br />
When evaluating credit risk associated with accounts receivable,<br />
notes receivable, loans receivable, and other receivables,<br />
<strong>Marubeni</strong> and its consolidated subsidiaries classify such according<br />
to latent risk carried by the obligor or geographical region concerned.<br />
Based on this classification, an allowance is established<br />
for a given receivable considered as a loss, posted at an amount<br />
equal to the current value of the receivables (projected cash flow<br />
minus the initial effective interest rate), or the fair value of the<br />
asset as collateral. Projected cash flow and fair value as collateral<br />
<strong>Marubeni</strong> Corporation 2005<br />
are estimated based on the most accurate credit information<br />
available from specialists regarding the past payment history of<br />
each applicable obligor or region. For general receivables not<br />
covered above, allowances are calculated based on the historical<br />
rate of default for each risk category. The historical rate of default<br />
is determined by specialists, based on past experience in each<br />
applicable risk area.<br />
While <strong>Marubeni</strong> believes these estimates to be reasonable,<br />
unexpected changes and other factors could significantly impact<br />
the Company’s consolidated financial statements.<br />
Valuation of marketable securities<br />
In accordance with Statement of Financial Accounting Standards<br />
No. 115, Accounting for Certain Investments in Debt and Equity<br />
Securities, published by the FASB, <strong>Marubeni</strong> and its consolidated<br />
subsidiaries classify securities as trading, held-to-maturity, or<br />
available-for-sale.<br />
Held-to-maturity securities are stated at amortized cost,<br />
adjusted for amortization of premiums and accretion of<br />
discounts to maturity. Available-for-sale securities are carried at<br />
fair value with the unrealized gains and losses, net of taxes,<br />
reported in accumulated other comprehensive loss in shareholders’<br />
equity. For held-to-maturity and available-for-sale<br />
securities, declines in value judged other than temporary are<br />
posted as devaluation losses.<br />
Declines in the value of marketable securities judged other than<br />
temporary are determined by examining the length of time that<br />
market value remains below book value and the percent decline in<br />
value. For securities without market quotations, a comprehensive<br />
examination of the possibility of recovery—based on projected<br />
business results—net assets and other measures of the percent<br />
decline in actual value, are used to make this determination.<br />
While <strong>Marubeni</strong> believes these estimates to be reasonable,<br />
unforeseeable changes to the assumptions used could result in a<br />
higher-than-expected loss, which could significantly impact the<br />
Company’s consolidated financial statements.<br />
Loss on long-lived assets<br />
Projected cash flows are utilized when determining devaluation<br />
losses for long-lived assets held by <strong>Marubeni</strong> and its consolidated<br />
subsidiaries. Projected cash flows are estimated based on a preestablished<br />
set of criteria.<br />
66 / 67
Management’s Discussion and Analysis of Financial Position and Business Results<br />
While <strong>Marubeni</strong> believes these estimates to be reasonable,<br />
unforeseeable changes to the terms and criteria used could result<br />
in a reassessment of projected cash flows, which could significantly<br />
impact the Company’s consolidated financial statements.<br />
Deferred tax assets<br />
In their financial statements and for tax purposes, <strong>Marubeni</strong> and<br />
its consolidated subsidiaries post transitional differences and<br />
losses carried forward as deferred tax assets. Regarding transitional<br />
differences and losses carried forward lowered due to future<br />
tax changes, a valuation allowance is posted for the portion for<br />
which realization is deemed unlikely, with deferred tax assets<br />
reduced accordingly. The projected amount of future tax to be<br />
collected is estimated based on future applicable income taxes<br />
and tax strategies.<br />
While <strong>Marubeni</strong> believes these estimates to be reasonable,<br />
unforeseeable changes to the terms and criteria used could result<br />
in a reassessment of the projected amount of tax to be collected,<br />
which could significantly impact the Company’s consolidated<br />
financial statements.<br />
Retirement benefit expenses<br />
<strong>Marubeni</strong> and its consolidated subsidiaries utilize actuarial pension<br />
accounting based on pre-established criteria to calculate severance<br />
pay and pension obligations for regular employees. These<br />
pre-established criteria include the discount rate, the retirement<br />
rate, the mortality rate, the rate of salary increase, and the rate of<br />
expected return on pension assets.<br />
While <strong>Marubeni</strong> believes these estimates to be reasonable,<br />
unforeseeable changes to the criteria used could significantly<br />
impact the Company’s consolidated financial statements.<br />
New accounting standards<br />
In March 2004, the Financial Accounting Standards Board issued<br />
FASB Emerging Issue Task Force Issue 04-2, “Whether Mineral<br />
Rights Are Tangible or Intangible Assets” (EITF 04-2). In this<br />
regard, the FASB also issued FASB Staff Position (FSP) No. 141-1<br />
and No. 142-1, which amend SFAS 141 and 142.<br />
Pursuant to EITF 04-2 and FSP 141-1 and 142-1, all mining<br />
rights, which were previously classified as intangible assets, have<br />
been reclassified under “Mining rights” and “Accumulated<br />
depreciation” under “Property, plant and equipment, at cost” in<br />
the consolidated balance sheets.<br />
5 Off-balance sheet arrangements and<br />
contractual obligations<br />
<strong>Marubeni</strong> guarantees debt of affiliated companies and third parties<br />
in the ordinary course of business. Should the guaranteed parties<br />
fail to make payments, the Company would be required to make<br />
such payments under these guarantees. The term of the guarantees<br />
is basically one year. The related guarantee fees are primarily<br />
received quarterly or semi-annually. Certain of these guarantees<br />
were secured by guarantees issued to the Company by other<br />
parties. The outstanding balance of guarantees, which approximated<br />
the maximum potential payment under these guarantees,<br />
was ¥96,806 million, including ¥42,183 million to affiliated companies,<br />
as of March 31, 2005, net of the amount secured by guarantees<br />
issued to the Company by other parties of ¥17,246 million. In<br />
the year ended March 31, 2004, these figures were ¥180,230<br />
million, ¥110,557 million and ¥19,507 million, respectively.<br />
6 Significant Policies<br />
<strong>Marubeni</strong> launched a three-year medium-term management plan,<br />
the “V” PLAN, in April 2003. The management policies formulated<br />
in the “V” PLAN aim to forge the Company into a resilient group<br />
possessing the top operational units and business portfolio in the<br />
industry. The ultimate goal is to strengthen the Company’s<br />
earnings base and improve its financial position primarily through<br />
stronger portfolio management and by placing renewed emphasis<br />
on risk-return profiles. Currently, <strong>Marubeni</strong> is redoubling efforts to<br />
achieve the objectives of the “V” PLAN in the run-up to its<br />
scheduled conclusion in the fiscal year ending March 31, 2006.<br />
From an economic, environmental and social perspective, the<br />
<strong>Marubeni</strong> Group recognizes that the support of its diverse<br />
stakeholders is crucial to conducting its business activities.<br />
Accordingly, the Group pursues activities in a manner that will<br />
mutually benefit and satisfy its customers, business partners,<br />
shareholders, employees and the local communities where it<br />
operates. At the same time, the Group implements sound<br />
management that gives due concern to protecting the natural<br />
environment, with the goal of developing a stable and sustainable<br />
base for Group operations. From a qualitative standpoint as well,<br />
the Group continues to promote stronger corporate governance
and CSR activities, in parallel with renewed efforts to ensure wellequipped<br />
internal control systems and bolster the Group’s<br />
compliance structure. Through these actions, the <strong>Marubeni</strong> Group<br />
is moving ahead with initiatives designed to maintain management<br />
transparency and maximize corporate value.<br />
By the fiscal year ending March 31, 2006, the “V” PLAN<br />
targets consolidated net income of ¥50.0 billion, consolidated net<br />
interest-bearing debt of ¥2 trillion or less, and a net debt-to-equity<br />
ratio of 5 times or less.<br />
7 Outlook<br />
Looking at the economic environment facing the <strong>Marubeni</strong><br />
Group, the United States and China are expected to continue to<br />
enact more stringent economic policies amid rising prices for<br />
primary commodities. The impact of policies centered on these<br />
two countries will likely cause a slowdown in economies<br />
worldwide, leading to a more stable, if subdued, pace of global<br />
economic growth.<br />
In the U.S., interest rates are expected to continue to climb as<br />
rising raw materials prices trigger stronger inflationary pressures.<br />
In response, growth in consumer spending and capital investment<br />
is projected to weaken, as the economy turns the corner toward a<br />
more stable growth pace. In Europe, the modest economic<br />
recovery under way is expected to remain on course. In Asia,<br />
while China’s high rate of growth is forecast to continue, growth in<br />
capital goods investments will most likely be restrained by the<br />
impact of more restrictive government policies. The result will<br />
likely be a decline in the overall pace of growth in the region. In<br />
Japan, meanwhile, forecasts call for brisk exports and capital<br />
investment in light of stable global economic growth, as well as<br />
the anticipated end of production cutbacks in electronic components<br />
and devices by mid-2005. However, with no major improvements<br />
in Japan’s employment and personal income picture in<br />
sight, no full-scale recovery in consumer spending appears<br />
forthcoming. As a result, economic growth is expected to remain<br />
modest for the foreseeable future.<br />
In this context, <strong>Marubeni</strong> is managing its progress on the<br />
qualitative and quantitative targets laid out in the “V” PLAN, the<br />
three-year medium-term management plan launched in April 2003,<br />
in the run-up to the plan’s scheduled completion at the end of the<br />
<strong>Marubeni</strong> Corporation 2005<br />
current fiscal year. Focused on ensuring the successful achievement<br />
of plan objectives, all <strong>Marubeni</strong> directors and regular<br />
employees are united in an effort to cement the foundations that<br />
will give <strong>Marubeni</strong> the resilient structure required to attain<br />
sustainable growth in the future, as well as realize a broader<br />
earnings base. Regarding the outlook for consolidated net income<br />
for the fiscal year ending March 31, 2006, the “V” PLAN target of<br />
¥50.0 billion has been raised to ¥60.0 billion, since completion of<br />
the “V” PLAN is expected to yield steady improvements in<br />
profitability not only in natural resource-related fields, which are<br />
currently benefiting from favorable market conditions, but also in<br />
food, pulp and paper, overseas IPP business and other areas.<br />
<strong>Marubeni</strong>’s earnings base will also be boosted further by a total of<br />
around ¥100.0 billion in new investments and financing scheduled<br />
to be implemented during the current fiscal year.<br />
The <strong>Marubeni</strong> Group is concentrating resources in fields where<br />
it has clear advantages, as well as in fields that hold promise for<br />
future growth. In doing so, strong, decisive management is<br />
essential. With food distribution, pulp and paper, electronic<br />
materials, natural resource development, overseas IPP business<br />
and new applied technology fields all positioned as priority<br />
business areas, the <strong>Marubeni</strong> Group will continue to act decisively<br />
to bolster its presence in each of these key domains.<br />
68 / 69
Consolidated Balance Sheets<br />
<strong>Marubeni</strong> Corporation<br />
At March 31, 2005 and 2004<br />
Millions of Yen<br />
Thousands of<br />
U.S. Dollars<br />
(Note 1)<br />
ASSETS 2005 2004 2005<br />
Current assets:<br />
Cash and cash equivalents (Notes 2 and 16) ................................................ ¥ 459,194 ¥ 478,731 $ 4,291,533<br />
Time deposits (Notes 7 and 16) ...................................................................<br />
Investment securities (Notes 2, 3, 7 and 16):<br />
3,256 6,753 30,430<br />
Marketable equity securities..................................................................... 3,997 3,387 37,355<br />
Other.........................................................................................................<br />
Notes and accounts receivable – trade (Notes 5 and 7):<br />
28,949 6,058 270,551<br />
Notes receivable ....................................................................................... 101,298 98,227 946,710<br />
Accounts receivable ................................................................................. 783,001 764,545 7,317,766<br />
Due from affiliated companies.................................................................. 94,453 106,391 882,738<br />
Allowance for doubtful accounts .............................................................. (24,620) (26,949) (230,093)<br />
Inventories (Notes 2 and 7) .......................................................................... 376,480 398,617 3,518,505<br />
Advance payments to suppliers ................................................................... 83,529 85,490 780,645<br />
Deferred income taxes (Note 10) ................................................................. 43,483 32,862 406,383<br />
Prepaid expenses and other current assets ................................................. 140,332 125,852 1,311,515<br />
Total current assets ........................................................................... 2,093,352 2,079,964 19,564,038<br />
Investments and long-term receivables:<br />
Affiliated companies (Notes 2, 4 and 7) .......................................................<br />
Securities and other investments (Notes 2, 3, 7 and 16):<br />
325,380 337,451 3,040,935<br />
Marketable equity securities..................................................................... 207,610 178,290 1,940,280<br />
Other.........................................................................................................<br />
Notes, loans and accounts receivable – trade, net of unearned interest,<br />
less allowance for doubtful accounts of ¥84,696 million<br />
($791,551 thousand) in 2005 and ¥93,865 million in 2004<br />
276,318 307,575 2,582,411<br />
(Notes 2, 5, 7 and 16) .................................................................................<br />
Property leased to others, at cost, less accumulated depreciation of<br />
¥69,835 million ($652,664 thousand) in 2005 and ¥55,628 million<br />
186,096 206,184 1,739,215<br />
in 2004 (Notes 2 and 7) .............................................................................. 248,338 256,370 2,320,916<br />
Total investments and long-term receivables.................................... 1,243,742 1,285,870 11,623,757<br />
Property, plant and equipment, at cost (Notes 2 and 7):<br />
Land and land improvements ....................................................................... 178,348 179,450 1,666,804<br />
Buildings ....................................................................................................... 284,105 288,668 2,655,187<br />
Equipment .................................................................................................... 360,024 322,240 3,364,710<br />
Mining rights ................................................................................................ 20,611 18,100 192,626<br />
843,088 808,458 7,879,327<br />
Accumulated depreciation ............................................................................ (310,782) (308,944) (2,904,505)<br />
Net property, plant and equipment ........................................................... 532,306 499,514 4,974,822<br />
Prepaid pension cost (Note 9) ....................................................................... 84,709 105,797 791,673<br />
Deferred income taxes (Note 10) ................................................................... 89,284 118,274 834,430<br />
Intangible assets (Notes 2, 6 and 9) ............................................................... 35,548 35,477 332,224<br />
Goodwill (Notes 2 and 6) ................................................................................ 27,509 28,793 257,093<br />
Other assets ................................................................................................... 101,587 100,505 949,412<br />
Total assets ...................................................................................... ¥4,208,037 ¥4,254,194 $39,327,449
<strong>Marubeni</strong> Corporation 2005 70 / 71<br />
Millions of Yen<br />
Thousands of<br />
U.S. Dollars<br />
(Note 1)<br />
LIABILITIES AND SHAREHOLDERS’ EQUITY 2005 2004 2005<br />
Current liabilities:<br />
Short-term loans (Notes 7, 8 and 16) ........................................................... ¥ 344,597 ¥ 474,735 $ 3,220,533<br />
Current portion of long-term debt (Notes 7, 8 and 16) .................................<br />
Notes and accounts payable – trade:<br />
314,501 328,816 2,939,262<br />
Notes and acceptances payable (Note 7) ................................................. 207,663 204,574 1,940,776<br />
Accounts payable ..................................................................................... 650,387 629,279 6,078,383<br />
Due to affiliated companies ...................................................................... 44,817 44,228 418,850<br />
Advance payments received from customers .............................................. 80,502 76,684 752,355<br />
Income taxes (Note 10) ................................................................................ 13,541 13,262 126,551<br />
Deferred income taxes (Note 10) ................................................................. 3,849 2,535 35,972<br />
Accrued expenses and other current liabilities (Note 7) ............................... 222,721 190,705 2,081,505<br />
Total current liabilities ........................................................................ 1,882,578 1,964,818 17,594,187<br />
Long-term debt, less current portion (Notes 7, 8 and 16) ........................... 1,813,722 1,822,473 16,950,673<br />
Employees’ retirement benefits (Note 9) ..................................................... 9,319 8,786 87,093<br />
Deferred income taxes (Note 10) ................................................................... 18,851 23,536 176,178<br />
Minority interests in consolidated subsidiaries .......................................... 40,415 41,599 377,711<br />
Commitments and contingent liabilities (Note 18)<br />
Shareholders’ equity (Note 11):<br />
Preferred stock (Note 12):<br />
Class I with no stated value:<br />
Authorized shares – 100,000,000<br />
Issued and outstanding shares – 75,500,000 in 2005 and 2004 ...........<br />
(aggregate liquidation preference of ¥75,500 million)<br />
Class II with no stated value:<br />
Authorized shares – 100,000,000<br />
37,750 37,750 352,804<br />
No shares issued and outstanding ........................................................<br />
Common stock:<br />
Authorized shares – 4,300,000,000<br />
– – –<br />
Issued and outstanding shares – 1,494,021,081 in 2005 and 2004 ......... 194,039 194,039 1,813,448<br />
Capital surplus .............................................................................................. 125,436 125,430 1,172,299<br />
Retained earnings ......................................................................................... 131,195 94,870 1,226,121<br />
Accumulated other comprehensive loss (Notes 3, 9, 10 and 13) .................<br />
Cost of common stock in treasury – 854,465 shares<br />
(45,126) (59,025) (421,738)<br />
in 2005 and 714,433 shares in 2004 ........................................................... (142) (82) (1,327)<br />
Total shareholders’ equity ................................................................. 443,152 392,982 4,141,607<br />
Total liabilities and shareholders’ equity ...................................... ¥4,208,037 ¥4,254,194 $39,327,449<br />
See accompanying notes.
Consolidated Statements of Income<br />
<strong>Marubeni</strong> Corporation<br />
Year ended March 31, 2005, 2004 and 2003<br />
Millions of Yen<br />
Thousands of<br />
U.S. Dollars<br />
(Note 1)<br />
2005 2004 2003 2005<br />
Revenues (Note 2):<br />
Revenues from trading and other activities ......................... ¥2,877,544 ¥2,624,011 ¥2,520,531 $26,892,935<br />
Commissions on services and trading margins ................... 161,108 150,158 160,636 1,505,682<br />
Total .................................................................................<br />
(Total volume of trading transactions:<br />
2005, ¥7,939,437 million ($74,200,346 thousand)<br />
2004, ¥7,905,640 million<br />
2003, ¥8,793,303 million) (Notes 2, 4 and 14)<br />
3,038,652 2,774,169 2,681,167 28,398,617<br />
Cost of revenues from trading and other activities ................. 2,602,597 2,364,708 2,256,524 24,323,337<br />
Gross trading profit .................................................................<br />
Expenses and other:<br />
436,055 409,461 424,643 4,075,280<br />
Selling, general and administrative expenses .....................<br />
Loss on the transfer of the substitutional portion of the<br />
employee pension fund liabilities, net of subsidy received<br />
342,929 330,032 345,612 3,204,944<br />
of ¥13,405 million ($125,280 thousand) (Note 9) .............. 1,453 – – 13,579<br />
Provision for doubtful accounts (Note 5) ............................. 6,298 805 5,660 58,860<br />
Interest income ................................................................... (23,408) (20,361) (26,605) (218,766)<br />
Interest expense ................................................................. 43,598 43,835 50,118 407,458<br />
Dividend income .................................................................. (8,989) (7,198) (6,797) (84,009)<br />
Impairment loss on investment securities (Note 3) ............ 7,438 10,451 27,083 69,514<br />
Gain on sales of investment securities (Note 3) .................. (36,147) (26,528) (14,351) (337,822)<br />
Loss (gain) on property, plant and equipment (Note 6) ....... 10,549 1,555 (8,530) 98,589<br />
Other – net (Notes 2 and 15) ............................................... 36,482 17,970 16,107 340,952<br />
Total ..........................................................................<br />
Income before income taxes, minority interests and<br />
380,203 350,561 388,297 3,553,299<br />
equity in earnings of affiliated companies .......................<br />
Provision (benefit) for income taxes (Note 10):<br />
55,852 58,900 36,346 521,981<br />
Current ................................................................................ 27,230 20,705 16,931 254,486<br />
Deferred .............................................................................. 6,607 14,913 (657) 61,748<br />
Income before minority interests and equity<br />
33,837 35,618 16,274 316,234<br />
in earnings of affiliated companies ................................... 22,015 23,282 20,072 205,747<br />
Minority interests .................................................................<br />
Equity in earnings of affiliated companies – net<br />
(1,440) (2,988) (3,180) (13,458)<br />
(after income tax effects) (Notes 4 and 10) ........................ 20,672 14,271 13,420 193,197<br />
Net income ............................................................................ ¥ 41,247 ¥ 34,565 ¥ 30,312 $ 385,486<br />
Income available to preferred shareholders (Note 19) ....... ¥ 1,510 ¥ 442 ¥ – $ 14,112<br />
Net income available to common shareholders ................ ¥ 39,737 ¥ 34,123 ¥ 30,312 $ 371,374<br />
U.S. Dollars<br />
Yen (Note 1)<br />
Basic earnings per 100 common shares (Note 2) ............... ¥2,661 ¥2,285 ¥2,030 $24.87<br />
Diluted earnings per 100 common shares (Note 2) ............ ¥2,231 ¥2,016 ¥1,896 $20.85<br />
See accompanying notes.
Consolidated Statements of Changes in Shareholders’ Equity<br />
<strong>Marubeni</strong> Corporation<br />
At March 31, 2005, 2004 and 2003<br />
<strong>Marubeni</strong> Corporation 2005 72 / 73<br />
Millions of Yen<br />
Thousands of U.S. Dollars<br />
(Note 1)<br />
2005 2004 2003 2005<br />
Class I preferred stock (Note 12):<br />
Balance at beginning of year .............. ¥ 37,750 ¥ – ¥ – $ 352,804<br />
Stock issued ....................................... – 37,750 – –<br />
Balance at end of year .......................<br />
Common stock:<br />
¥ 37,750 ¥ 37,750 ¥ – $ 352,804<br />
Balance at beginning of year .............. ¥194,039 ¥194,039 ¥ 194,039 $1,813,448<br />
Balance at end of year .......................<br />
Capital surplus:<br />
¥194,039 ¥194,039 ¥ 194,039 $1,813,448<br />
Balance at beginning of year ..............<br />
Transfer to retained earnings<br />
¥125,430 ¥ 87,765 ¥ 216,993 $1,172,243<br />
(Note 11) ..........................................<br />
Excess of proceeds from issuance<br />
of preferred stock over the amount<br />
assigned to the preferred<br />
– – (129,228) –<br />
stock account (Note 12) ................... – 37,665 – –<br />
Gain on sales of treasury stock .......... 6 – – 56<br />
Balance at end of year .......................<br />
Retained earnings<br />
(accumulated deficit):<br />
¥125,436 ¥125,430 ¥ 87,765 $1,172,299<br />
Balance at beginning of year .............. ¥ 94,870 ¥ 64,786 ¥ (94,754) $ 886,635<br />
Net income ........................................<br />
Cash dividends – common and<br />
41,247 ¥41,247 34,565 ¥34,565 30,312 ¥ 30,312 385,486 $385,486<br />
preferred stocks ............................... (4,922) (4,481) – (46,000)<br />
Transfer from capital surplus (Note 11) – – 129,228 –<br />
Balance at end of year .......................<br />
Accumulated other<br />
comprehensive loss (Note 13):<br />
¥131,195 ¥ 94,870 ¥ 64,786 $1,226,121<br />
Balance at beginning of year ..............<br />
Unrealized gains (losses) on<br />
investment securities, net of<br />
¥(59,025) ¥(86,441) ¥ (52,375) $ (551,635)<br />
reclassification (Note 3) ....................<br />
Currency translation adjustments,<br />
11,734 43,290 (8,749) 109,664<br />
net of reclassification .......................<br />
Unrealized gains (losses) on<br />
(1,659) (15,247) (20,854) (15,505)<br />
derivatives, net of reclassification ....<br />
Minimum pension liability<br />
3,859 (597) (4,101) 36,065<br />
adjustment (Note 9) .........................<br />
Other comprehensive income (loss),<br />
(35) (30) (362) (327)<br />
net of tax .......................................... 13,899 13,899 27,416 27,416 (34,066) (34,066) 129,897 129,897<br />
Comprehensive income (loss) ............ ¥55,146 ¥61,981 ¥ (3,754) $515,383<br />
Balance at end of year .......................<br />
Cost of common stock in treasury:<br />
¥(45,126) ¥(59,025) ¥ (86,441) $ (421,738)<br />
Balance at beginning of year .............. ¥ (82) ¥ (98) ¥ (8) $ (766)<br />
Treasury stock (repurchased) sold ..... (60) 16 (90) (561)<br />
Balance at end of year .......................<br />
Disclosure of reclassification<br />
amount for the year ended:<br />
Unrealized gains (losses) on<br />
investment securities arising<br />
¥ (142) ¥ (82) ¥ (98) $ (1,327)<br />
during the period ..............................<br />
Less: reclassification adjustments<br />
for (gains) losses included in<br />
¥ 28,315 ¥ 51,762 ¥ (19,036) $ 264,626<br />
net income ....................................... (16,581) (8,472) 10,287 (154,962)<br />
Net unrealized gains (losses) .............<br />
Currency translation adjustments<br />
¥ 11,734 ¥ 43,290 ¥ (8,749) $ 109,664<br />
arising during period .........................<br />
Less: reclassification adjustments<br />
¥ (4,295) ¥(17,803) ¥ (27,252) $ (40,140)<br />
for losses included in net income .... 2,636 2,556 6,398 24,635<br />
Net currency translation adjustments ...<br />
Unrealized gains (losses) on derivatives<br />
¥ (1,659) ¥(15,247) ¥ (20,854) $ (15,505)<br />
arising during the period ...................<br />
Less: reclassification adjustments<br />
for (gains) losses included in<br />
¥ 6,431 ¥ (5) ¥ (4,618) $ 60,102<br />
net income .......................................<br />
Net unrealized gains (losses)<br />
(2,572) (592) 517 (24,037)<br />
on derivatives ................................... ¥ 3,859 ¥ (597) ¥ (4,101) $ 36,065<br />
See accompanying notes.
Consolidated Statements of Cash Flows<br />
<strong>Marubeni</strong> Corporation<br />
Year ended March 31, 2005, 2004 and 2003<br />
Millions of Yen<br />
Thousands of<br />
U.S. Dollars<br />
(Note 1)<br />
2005 2004 2003 2005<br />
Operating activities<br />
Net income .......................................................................... ¥ 41,247 ¥ 34,565 ¥ 30,312 $ 385,486<br />
Adjustments to reconcile net income to net cash provided<br />
by operating activities:<br />
Depreciation and amortization ......................................... 65,703 54,261 63,665 614,047<br />
Provision for doubtful accounts ....................................... 6,298 805 5,660 58,860<br />
Equity in earnings of affiliated companies,<br />
less dividends received .................................................. (13,049) (598) (5,555) (121,953)<br />
(Gain) loss on investment securities ................................ (28,709) (16,077) 12,732 (268,308)<br />
Loss (gain) on property, plant and equipment ................. 10,549 1,555 (8,530) 98,589<br />
Deferred income taxes .................................................... 6,607 14,913 (657) 61,748<br />
Changes in operating assets and liabilities:<br />
Notes and accounts receivable .................................... (4,080) 57,711 76,603 (38,131)<br />
Inventories ................................................................... 17,561 (1,102) 15,637 164,121<br />
Advance payments to suppliers and<br />
prepaid expenses and other assets ........................... (4,045) 15,138 (1,062) (37,804)<br />
Prepaid pension cost .................................................... 21,088 7,208 (8,819) 197,084<br />
Notes, acceptances and accounts payable .................. 33,201 18,839 (13,898) 310,290<br />
Advance payments received from customers and<br />
accrued expenses and other liabilities ....................... 38,199 (2,704) 19,155 357,000<br />
Income taxes ............................................................... 1,283 (637) 3,996 11,991<br />
Other................................................................................ (18,029) 17,683 5,549 (168,497)<br />
Net cash provided by operating activities ............................ 173,824 201,560 194,788 1,624,523<br />
Investing activities<br />
Proceeds from sales and redemptions of securities and<br />
other investments ............................................................. 95,459 106,326 108,092 892,140<br />
Purchases of securities and other investments .................. (66,356) (52,346) (82,796) (620,150)<br />
Proceeds from sales of property, plant and equipment<br />
and property leased to others ............................................ 20,849 15,195 47,783 194,850<br />
Purchases of property, plant and equipment and<br />
property leased to others .................................................. (65,324) (66,478) (59,663) (610,505)<br />
Collection of loans receivable .............................................. 98,813 131,470 165,363 923,486<br />
Loans made to customers ................................................... (35,545) (59,127) (61,523) (332,196)<br />
Other ................................................................................. (1,853) (17,057) (4,015) (17,317)<br />
Net cash provided by investing activities ............................ 46,043 57,983 113,241 430,308<br />
Financing activities<br />
Net decrease in short-term loans ........................................ (119,698) (173,240) (53,423) (1,118,673)<br />
Proceeds from long-term debt ............................................ 387,677 458,836 368,218 3,623,150<br />
Payments of long-term debt ................................................ (497,929) (589,521) (609,920) (4,653,542)<br />
Cash dividends paid – common and preferred stocks ......... (4,922) (4,481) – (46,000)<br />
(Purchase) sale of treasury stock ........................................ (54) 16 (90) (505)<br />
Proceeds from issuance of preferred stock ........................ – 75,415 – –<br />
Other ................................................................................. (3,131) (963) 1,214 (29,262)<br />
Net cash used in financing activities ................................... (238,057) (233,938) (294,001) (2,224,832)<br />
Effect of exchange rate changes on cash and<br />
cash equivalents .................................................................. (1,347) (13,385) (14,159) (12,588)<br />
Net (decrease) increase in cash and<br />
cash equivalents .................................................................. (19,537) 12,220 (131) (182,589)<br />
Cash and cash equivalents at beginning of year ............... 478,731 466,511 466,642 4,474,122<br />
Cash and cash equivalents at end of year .......................... ¥ 459,194 ¥ 478,731 ¥ 466,511 $ 4,291,533<br />
Supplemental cash flow information:<br />
Cash paid during the year for:<br />
Interest ............................................................................ ¥ 45,045 ¥ 45,071 ¥ 52,864 $ 420,981<br />
Income taxes ................................................................... 27,072 21,149 12,935 253,009<br />
Non-cash investing activities:<br />
Exchange of assets:<br />
Fair value of assets received ........................................ 66 18,397 30,270 617<br />
Carrying value of assets surrendered .......................... 14 16,665 24,239 131<br />
Contribution of securities to employee<br />
retirement benefit trusts ............................................ – – 8,746 –<br />
See accompanying notes.
Notes to Consolidated Financial Statements<br />
<strong>Marubeni</strong> Corporation<br />
Years ended March 31, 2005 and 2004<br />
1 Basis of Financial Statements<br />
<strong>Marubeni</strong> Corporation (the “Company”), a Japanese corporation,<br />
maintains its books and records and prepares its financial statements<br />
in Japanese yen. The accompanying consolidated financial statements<br />
differ from the non-consolidated financial statements issued<br />
for domestic purposes in Japan. In addition to consolidation, they<br />
reflect certain adjustments not recorded in the Company’s books,<br />
which in the opinion of management are appropriate to present the<br />
Company’s financial position, results of operations, and cash flows in<br />
accordance with accounting principles generally accepted in the<br />
United States. The principal adjustments are: (1) recognition of<br />
installment sales on the accrual basis, (2) recognition of the value<br />
ascribed to warrants, (3) accounting for pension costs, (4) accounting<br />
for certain investments in debt and marketable equity securities,<br />
2 Significant Accounting Policies<br />
Consolidation<br />
The consolidated financial statements of the Company include the<br />
accounts of all majority owned domestic and foreign subsidiaries<br />
(together, the “Companies”). Significant intercompany transactions<br />
and accounts have been eliminated. When a subsidiary sells stock to<br />
unrelated third parties, the Company’s shareholdings in the subsidiary<br />
decreases while the price per share changes, depending on the price<br />
of the new stock issued. The Company recognizes such a change in<br />
the price per share in earnings at the time of the sale of stock.<br />
In January 2003, the Financial Accounting Standards Board (FASB)<br />
issued FASB Interpretation 46, Consolidation of Variable Interest<br />
Entities, an interpretation of ARB No. 51 (FIN 46). In December 2003,<br />
the FASB modified FIN 46 to make certain technical corrections and<br />
address certain implementation issues that had arisen. FIN 46<br />
provides a new framework for identifying variable interest entities<br />
(VIEs) and determining when a company should include the assets,<br />
liabilities, noncontrolling interests and results of activities of a VIE in<br />
its consolidated financial statements. FIN 46 requires a VIE to be<br />
consolidated if a party with an ownership, contractual or other<br />
financial interest in the VIE (a variable interest holder) is obligated to<br />
absorb a majority of the risk of loss from the VIE’s activities, is<br />
entitled to receive a majority of the VIE’s residual returns (if no party<br />
absorbs a majority of the VIE’s losses), or both. A variable interest<br />
holder that consolidates the VIE is called the primary beneficiary. FIN<br />
46 also requires disclosures about VIEs that the variable interest<br />
holder is not required to consolidate but in which it has a significant<br />
variable interest.<br />
The Companies applied FIN46 immediately for the Companies’<br />
interests in VIEs created after January 31, 2003, and for<br />
the Companies’ interests in special purpose entities created<br />
before February 1, 2003 on October 1, 2003. The provisions of<br />
FIN 46, as revised, were adopted as of January 1 2004, for the<br />
Companies’ interests in all VIEs. The adoption of FIN46 did not<br />
have a material impact on the Company’s financial positions and<br />
results of operations.<br />
Certain subsidiaries have been included on the basis of a fiscal<br />
year-end on or after December 31, but prior to the parent company’s<br />
fiscal year-end of March 31. There have been no significant transactions<br />
with such subsidiaries during the intervening periods.<br />
<strong>Marubeni</strong> Corporation 2005 74 / 75<br />
(5) deferred gain on sales of property for tax purposes, (6) accounting<br />
for goodwill and other intangible assets, (7) accounting for derivative<br />
instruments and hedging activities, (8) accounting for sale-leaseback<br />
of real estate and other, and (9) accounting for debt issuance costs.<br />
Certain reclassifications have been made in the 2004 and 2003<br />
financial statements to conform to the presentation for 2005.<br />
The translation of Japanese yen amounts into U.S. dollar<br />
amounts for the year ended March 31, 2005 is included solely for<br />
the convenience of readers outside of Japan and has been made at<br />
¥107 to $1, the exchange rate prevailing on March 31, 2005. The<br />
translation should not be construed as a representation that the<br />
Japanese yen amounts could be converted into U.S. dollars at this<br />
or any other rate.<br />
Use of estimates<br />
The preparation of financial statements in conformity with accounting<br />
principles generally accepted in the United States requires management<br />
to make estimates and assumptions that affect the amounts<br />
reported in the financial statements and accompanying notes.<br />
Although the actual results could differ from those estimates,<br />
management does not believe that any differences would materially<br />
affect the consolidated financial statements of the Company.<br />
Foreign currency translation<br />
Assets and liabilities included in financial statements of foreign<br />
subsidiaries and affiliated companies are translated into Japanese<br />
yen at the respective year end rates. All income and expenses<br />
accounts are translated at the average rates prevailing during the<br />
year. The resulting translation adjustments are included in accumulated<br />
other comprehensive loss.<br />
Foreign currency-denominated receivables and payables are<br />
translated into Japanese yen at the year end rates with the resulting<br />
gains and losses recognized in earnings of the year.<br />
Cash equivalents<br />
The Companies consider deposits in banks and securities purchased<br />
under resale agreements with an original maturity of three months or<br />
less to be cash equivalents.<br />
Investment securities<br />
Management determines the appropriate classification of investment<br />
securities as either trading, held-to-maturity or available-for-sale<br />
securities at the date of purchase.<br />
Trading securities<br />
Trading securities are held for resale in anticipation of short-term<br />
market movements. Trading securities, consisting primarily of<br />
marketable equity securities, are stated at fair value. Gains and<br />
losses are included in gain/loss on sales of investment securities.<br />
Held-to-maturity securities<br />
Debt securities are classified as held-to-maturity when the Companies<br />
have the positive intent and ability to hold the securities to<br />
maturity. Held-to-maturity securities are stated at amortized cost,<br />
adjusted for amortization of premiums and accretion of discounts to
Notes to Consolidated Financial Statements<br />
maturity. Such amortization and accretion are included in interest<br />
income. Interest on securities classified as held-to-maturity is<br />
included in interest income. Declines in fair value judged to be other<br />
than temporary on held-to-maturity securities are included in<br />
impairment loss on investment securities.<br />
Available-for-sale securities<br />
Marketable equity securities not classified as trading and debt<br />
securities not classified as trading or held-to-maturity are classified as<br />
available-for-sale securities and are carried at fair value, with the<br />
unrealized gains and losses, net of taxes, reported in accumulated<br />
other comprehensive loss in shareholders’ equity. The amortized<br />
cost of debt securities in this category is adjusted for the amortization<br />
of premiums and accretion of discounts to maturity. Such<br />
amortization and accretion are included in interest income. Realized<br />
gains and losses and declines in fair value judged to be other than<br />
temporary on available-for-sale securities are included in gain/loss on<br />
sales of investment securities and impairment loss on investment<br />
securities, respectively. The average cost of securities sold is used in<br />
the determination of realized gains or losses. Interest and dividends<br />
on investment securities classified as available-for-sale are included<br />
in interest income and dividend income, respectively.<br />
Inventories<br />
Inventories, which primarily consist of commodities, merchandise<br />
and real estate held for sale, are stated at the lower of cost (primarily<br />
specific or moving average cost) or market (generally replacement<br />
cost). Inventories included real estate for sale of ¥93,338 million<br />
($872,318 thousand) and ¥106,947 million at March 31, 2005 and<br />
2004, respectively.<br />
Investments<br />
The Companies’ investments in affiliated companies (investees over<br />
which the Companies have the ability to exercise significant<br />
influence) are stated at cost, adjusted for equity in their undistributed<br />
earnings or accumulated losses since acquisition. Other investments<br />
are primarily non-marketable equity securities and are stated at cost,<br />
adjusted for any declines in value judged to be other than temporary.<br />
Loans and allowance for doubtful accounts<br />
Loans including accounts receivable are stated at cost.<br />
In evaluating the credit risk relating to loans, the Companies<br />
categorize them based on the potential exposures for credit ratings<br />
of debtors, geographical and other considerations. When a loan is<br />
impaired, the allowance for credit losses is determined based on<br />
discounted cash flows using the loans’ initial effective interest rate or<br />
the fair value of the collateral for certain collateral dependent loans.<br />
For other loans, the allowance for credit losses is determined based<br />
on a historical bad debt ratio by the credit risk category. When loans<br />
are legally or contractually determined to be uncollectible, the loans<br />
are offset against their respective allowances.<br />
Cash received on impaired loans is either applied against the<br />
principal of such loans or reported as interest income, based on<br />
management’s judgment with regard to the collectibility of the<br />
principal. The Companies discontinue the accrual of interest when<br />
loans are past due for a period of 180 days or more. The accrual of<br />
interest is resumed when agreements for rescheduling of payment is<br />
made and receipt of interest is probable.<br />
Loans ninety days past due are noted as delinquent and monitored<br />
for collectibility. The recorded investments in loans ninety days<br />
past due and still accruing interest were not significant at March 31,<br />
2005 and 2004.<br />
Leases<br />
The Company and certain of its subsidiaries lease fixed assets under<br />
direct financing leases and operating leases as lessors. Income from<br />
direct financing leases is recognized by amortization of unearned<br />
income over the lease term at a constant periodic rate of return on<br />
the net investment. Operating lease income is recognized over the<br />
lease term on a straight-line basis.<br />
The Company and certain of its subsidiaries lease fixed assets<br />
under operating leases and capital leases as lessees. For capital<br />
lease obligations, interest expense is recognized over the lease term<br />
at a constant periodic rate on the lease obligation. Accumulated<br />
depreciation of the leased assets is recognized over the lease term<br />
on a straight-line basis. Rental expense on operating leases is<br />
recognized over the lease term on a straight-line basis.<br />
Depreciation<br />
Depreciation of property, plant and equipment (including property<br />
leased to others) is determined by the declining-balance or the<br />
straight-line method (primarily for buildings) at rates based on the<br />
estimated useful lives of the respective assets, which are from 2 to<br />
50 years.<br />
Mining rights<br />
The FASB issued FASB Emerging Issue Task Force Issue 04-2,<br />
Whether Mineral Rights are Tangible or Intangible Assets (EITF 04-2).<br />
In this regard, the FASB also issued FASB Staff Position (FSP) No.<br />
141-1 and 142-1, which amend SFAS 141 and SFAS142. In accordance<br />
with EITF 04-2 and FSP No. 141-1 and 142-1, all mining rights,<br />
which were previously classified as intangible assets, have been<br />
reclassified in Property, plant and equipment in the consolidated<br />
balance sheets.<br />
Mining rights are primarily amortized by the unit-of-production<br />
method or straight-line method.<br />
Long-lived assets other than goodwill and other intangible assets<br />
Long-lived assets held and used are evaluated for impairment and<br />
written down to their fair value if the sum of their expected future<br />
cash flows is less than the carrying amount of the assets. Long-lived<br />
assets to be disposed of are reported at the lower of the carrying<br />
amount or fair value less cost to sell.<br />
Business combinations<br />
In accordance with Statement of Financial Accounting Standards No.<br />
141, Business Combinations, the purchase method of accounting is<br />
used for all business combinations. The Company separately<br />
recognizes and presents acquired intangible assets as goodwill or<br />
other intangible assets.<br />
Goodwill and other intangible assets<br />
Effective April 1, 2002, the Companies adopted Statement of<br />
Financial Accounting Standards No. 142, Goodwill and Other<br />
Intangible Assets (SFAS 142). SFAS 142 prohibits the amortization of<br />
goodwill and intangible assets with indefinite useful lives. SFAS 142<br />
requires that these assets be reviewed for impairment at least<br />
annually. Intangible assets with finite lives will continue to be<br />
amortized over their estimated useful lives. Additionally, SFAS 142<br />
requires that goodwill included in the carrying value of equity method<br />
investments no longer be amortized. The Companies annually test<br />
goodwill for impairment using the two-step process prescribed in<br />
SFAS 142. The first step is a screen for potential impairment, while<br />
the second step measures the amount of the impairment, if any.
Asset retirement obligations<br />
Effective for the year ended March 31, 2004, the Companies<br />
adopted Statement of Financial Accounting Standards No. 143,<br />
Accounting for Asset Retirement Obligations (SFAS 143). SFAS 143<br />
requires legal obligations associated with the retirement of long-lived<br />
assets to be recognized at their fair value at the time that the<br />
obligations are incurred. Upon initial recognition of a liability, that cost<br />
should be capitalized as part of the related long-lived asset and<br />
allocated to expense over the useful life of the asset. The adoption of<br />
SFAS 143 did not have a material impact on the Company’s financial<br />
positions and results of operations.<br />
Financial instruments with characteristics of both liabilities and<br />
equity<br />
Effective for the year ended March 31, 2004, the Companies<br />
adopted Statement of Financial Accounting Standards No. 150,<br />
Accounting for Certain Financial Instruments with Characteristics of<br />
both Liabilities and Equity (SFAS 150). SFAS 150 established<br />
standards for how an issuer classifies and measures certain financial<br />
instruments with characteristics of both liabilities and equity. The<br />
adoption of SFAS 150 did not have a material impact on the<br />
Company’s financial positions and results of operations.<br />
Revenue recognition and total volume of trading transactions<br />
The trading transactions undertaken by the Companies take many<br />
forms and consist of those in which the Companies act as principal<br />
and those in which the Companies act as agent. In agency transactions,<br />
payment for goods is made directly by the purchaser to the<br />
supplier. The Companies derive revenues from sales of goods,<br />
performance of services and commissions on trading transactions.<br />
Although the Companies legally act as a principal, certain<br />
transactions are reported net, as commissions, when the margins<br />
thereon are in substance considered commissions in accordance<br />
with FASB Emerging Issue Task Force Issue 99-19 Reporting<br />
Revenue Gross as a Principal versus Net as an Agent (EITF 99-19).<br />
When the Company is not the primary obligor and do not have<br />
general inventory risk, it generally presents the transaction net. The<br />
presentation may change according to changes in form or substance<br />
of transactions.<br />
The total volume of trading transactions, which is voluntarily<br />
disclosed in the statements of income, includes the sales value of all<br />
transactions in which the Companies participate, regardless of the<br />
form of such transaction, based on the practice of the Japanese<br />
trading companies.<br />
The Companies’ revenues and commissions are recognized when<br />
they are realized or realizable and earned. Revenues and commissions<br />
are realized or realizable and earned when the Companies have<br />
persuasive evidence of an arrangement, the goods have been<br />
delivered or the services have been rendered to the customer, the<br />
sales price is fixed or determinable and collection is reasonably<br />
assured.<br />
Sale of goods: In acting as a principal, revenue from the sale of<br />
goods is recognized when the delivery conditions are met. These<br />
conditions are considered to have been met when the goods are<br />
received by the customer or title to securities such as bills of lading<br />
are transferred to the customer. In addition, if required the implementation<br />
testing needs to be fully completed and any future<br />
obligations need to be perfunctory and not affect the customer’s final<br />
acceptance of the arrangement of revenue to be recognized.<br />
Performance of services: Commissions are recognized when the<br />
contracted services to the third-party customers are completed. In<br />
acting as agent, the Companies recognize commissions when<br />
contracted services are fully rendered to the customers.<br />
<strong>Marubeni</strong> Corporation 2005 76 / 77<br />
Long-term and large scale construction arrangements: Revenue<br />
is recognized by the completed-contract method unless reasonably<br />
dependable estimates of costs and extent of progress can be<br />
made, in which case revenue is recognized by the percentage-ofcompletion<br />
method.<br />
Shipping and handling costs are included in cost of revenues.<br />
Other expenses – net<br />
Other expenses – net includes losses incurred in liquidating<br />
subsidiaries and affiliated companies of ¥412 million ($3,850<br />
thousand), ¥6,549 million and ¥12,542 million for the years ended<br />
March 31, 2005, 2004 and 2003, respectively.<br />
Other expenses – net for the year ended March 31, 2005 also<br />
includes a loss on investment in and receivables from P.T. Chandra<br />
Asri of ¥21,347 million ($199,505 thousand).<br />
The aggregated amounts of losses on sales of loans, included in<br />
other expenses – net were ¥1,023 million and ¥1,790 million for the<br />
years ended March 31, 2004 and 2003, respectively. Such amount<br />
was not significant for the year ended March 31, 2005.<br />
Derivative instruments and hedging activities<br />
The Companies apply Statement of Financial Accounting Standard<br />
No. 133, Accounting for Derivative Instruments and Hedging<br />
Activities, as amended by SFAS138 and SFAS149.<br />
The Companies recognize all derivative instruments on the<br />
consolidated balance sheet at fair value. Derivatives that are not<br />
hedges must be adjusted to fair value through income. If the<br />
derivative is a hedge, depending on the nature of the hedge, changes<br />
in the fair value of derivatives will either be offset against the change<br />
in value of the hedged assets, liabilities, or firm commitments<br />
through earnings or recognized in other comprehensive income until<br />
the hedged item is recognized in earnings. The ineffective portion of<br />
the change in fair value of a hedge will be immediately recognized in<br />
earnings. For derivative and non-derivative financial instruments<br />
designated as hedging the foreign currency exposure of a net<br />
investment in foreign subsidiaries and affiliates, the gain or loss is<br />
reported in other comprehensive income as part of the cumulative<br />
translation adjustment to the extent the hedges are effective. Gains<br />
and losses related to the hedge ineffective portion and related to the<br />
portion of hedging instruments excluded from the assessment of<br />
hedge effectiveness are included in other expenses – net. The<br />
Companies expect to reclassify ¥323 million ($3,019 thousand) of net<br />
gain on derivative instruments from accumulated other comprehensive<br />
income to earnings during the 12 months ending March 31,<br />
2006, due to actual export and import transactions or receipts and<br />
payments of interest. The maximum length of time over which the<br />
Companies are hedging their exposure to the variability in future cash<br />
flows for forecasted transactions excluding those forecasted<br />
transactions related to the payments of variable interest on existing<br />
financial instruments is 24 months.<br />
Earnings per 100 shares of common stock<br />
The computation of basic earnings per 100 shares of common stock<br />
is based on the weighted average number of shares of common<br />
stock outstanding during the year. The computation of diluted<br />
earnings per 100 shares is based on the weighted average number<br />
of shares of common stock outstanding plus any potentially dilutive<br />
securities. For additional disclosures regarding convertible debentures<br />
and preferred stocks, refer to Notes 8, 11 and 12.
Notes to Consolidated Financial Statements<br />
The following table sets forth the computation of basic and diluted earnings per 100 shares:<br />
Thousands of<br />
Millions of yen U.S. dollars<br />
2005 2004 2003 2005<br />
Numerator:<br />
Net income .................................................................................... ¥ 41,247 ¥ 34,565 ¥ 30,312 $385,486<br />
Less: Preferred stock dividends .....................................................<br />
Net income available to common shareholders (numerator for<br />
(1,510) (442) – (14,112)<br />
basic earnings per 100 shares) .....................................................<br />
Effect of dilutive securities:<br />
39,737 34,123 30,312 371,374<br />
Convertible debentures ............................................................. 323 323 333 3,019<br />
Preferred stock .......................................................................... 1,510 442 – 14,112<br />
Numerator for diluted earnings per 100 shares .............................<br />
Denominator:<br />
Denominator for basic earnings per 100 shares –<br />
¥ 41,570 ¥ 34,888 ¥ 30,645 $388,505<br />
weighted average shares .............................................................<br />
Effect of dilutive securities:<br />
1,493,231,438 1,493,219,051 1,493,495,279<br />
Convertible debentures ............................................................. 119,666,048 119,666,048 123,151,564<br />
Preferred stock ..........................................................................<br />
Denominator for diluted earnings per 100 shares –<br />
250,000,000 117,406,406 –<br />
adjusted weighted average shares and assumed conversions .... 1,862,897,486 1,730,291,505 1,616,646,843<br />
Earnings per 100 shares of common stock:<br />
Yen U.S. dollars<br />
Basic .............................................................................................. ¥2,661 ¥2,285 ¥2,030 $24.87<br />
Diluted ............................................................................................ ¥2,231 ¥2,016 ¥1,896 $20.85<br />
Dividends of Class I preferred stocks are deducted from net income for net income available to common shareholders.<br />
The convertible debentures issued in 1996 with a rate of 0.85% were dilutive for the years ended March 31, 2005, 2004 and 2003. The class<br />
I preferred stock issued in 2003 was dilutive for the years ended March 31, 2005 and 2004.<br />
3 Marketable Equity Securities and Debt Securities<br />
The following is a summary of available-for-sale securities and held-to-maturity securities at March 31, 2005 and 2004:<br />
Available-for-sale securities<br />
Millions of yen<br />
2005 2004<br />
Gross Gross Gross Gross<br />
Unrealized Unrealized Unrealized Unrealized<br />
Cost Gains Losses Fair Value Cost Gains Losses Fair Value<br />
Current:<br />
Debt securities ...........................<br />
Non-current:<br />
¥ 701 ¥ 183 ¥ (2) ¥ 882 ¥ 5,509 ¥ 80 ¥ (104) ¥ 5,485<br />
Debt securities ........................... ¥ 22,720 ¥ 501 ¥ (9) ¥ 23,212 ¥ 7,309 ¥ 325 ¥ – ¥ 7,634<br />
Marketable equity securities ...... 140,249 74,516 (7,155) 207,610 121,454 62,829 (5,993) 178,290<br />
Total ....................................... ¥162,969 ¥75,017 ¥(7,164) ¥230,822 ¥128,763 ¥63,154 ¥(5,993) ¥185,924<br />
Thousands of U.S. dollars<br />
2005<br />
Gross Gross<br />
Unrealized Unrealized<br />
Cost Gains Losses Fair Value<br />
Current:<br />
Debt securities ........................... $<br />
Non-current:<br />
6,551 $ 1,710 $ (18) $ 8,243<br />
Debt securities ........................... $ 212,337 $ 4,682 $ (84) $ 216,935<br />
Marketable equity securities ...... 1,310,738 696,411 (66,869) 1,940,280<br />
Total ....................................... $1,523,075 $701,093 $(66,953) $2,157,215
Held-to-maturity securities<br />
Millions of yen<br />
2005 2004<br />
<strong>Marubeni</strong> Corporation 2005 78 / 79<br />
Gross Gross Gross Gross<br />
Unrealized Unrealized Unrealized Unrealized<br />
Cost Gains Losses Fair Value Cost Gains Losses Fair Value<br />
Current:<br />
Debt securities ...........................<br />
Non-current:<br />
¥28,067 ¥191 ¥(120) ¥28,138 ¥ 573 ¥ 10 ¥ – ¥ 583<br />
Debt securities ........................... ¥14,300 ¥816 ¥ – ¥15,116 ¥42,784 ¥1,488 ¥(150) ¥44,122<br />
Thousands of U.S. dollars<br />
2005<br />
Gross Gross<br />
Unrealized Unrealized<br />
Cost Gains Losses Fair Value<br />
Current:<br />
Debt securities ...........................<br />
Non-current:<br />
$262,308 $1,785 $(1,121) $262,972<br />
Debt securities ........................... $133,645 $7,626 $ – $141,271<br />
Debt securities which the Company held at March 31, 2005 and 2004 were mainly corporate bonds.<br />
Management of the Company believes that the unrealized losses<br />
above are not other than temporary declines as either the market<br />
value has substantially recovered subsequent to the balance sheet<br />
date or the duration of decline is less than 9 months.<br />
In addition to the securities listed above, the Companies held<br />
trading securities of ¥3,997 million ($37,355 thousand) and ¥3,387<br />
million, at fair value, as of March 31, 2005 and 2004, respectively.<br />
The net unrealized holding losses on trading securities included in<br />
earnings for the years ended March 31, 2005, 2004 and 2003<br />
amounted to ¥8 million, nil and ¥5 million, respectively.<br />
The proceeds from sales of available-for-sale securities amounted<br />
to ¥50,728 million ($474,093 thousand), ¥33,717 million and ¥23,984<br />
million for the years ended March 31, 2005, 2004 and 2003,<br />
respectively. Gross realized gains on sales of available-for-sale<br />
securities totaled ¥28,611 million ($267,393 thousand), ¥13,945<br />
million and ¥9,356 million, and gross realized losses totaled ¥144<br />
million ($1,346 thousand), ¥179 million and ¥846 million for the years<br />
ended March 31, 2005, 2004 and 2003, respectively.<br />
The Company contributed certain available-for-sale securities to an<br />
employee retirement benefit trust at fair value of ¥8,746 million and<br />
recognized a loss of ¥1,611 million, which is included in gain on sales<br />
of investment securities for the year ended March 31, 2003.<br />
The Company wrote down certain marketable investment<br />
securities whose decline in value was considered to be other than<br />
temporary to their fair value. These write-downs amounted to ¥385<br />
million ($3,598 thousand), ¥197 million and ¥23,699 million for the<br />
years ended March 31, 2005, 2004 and 2003.<br />
The amortized cost and estimated fair value of debt and marketable<br />
equity securities at March 31, 2005 are summarized by<br />
contractual maturity below. Expected maturities may differ from<br />
contractual maturities because the issuers of certain securities have<br />
the right to prepay obligations without prepayment penalties.<br />
Available-for-sale securities<br />
Millions of yen Thousands of U.S. dollars<br />
Cost Fair Value Cost Fair Value<br />
Due in one year or less ...................................................................... ¥ 701 ¥ 882 $ 6,551 $ 8,243<br />
Due after one year through five years ............................................... 20,921 21,233 195,523 198,439<br />
Due after five years ............................................................................ 1,799 1,979 16,814 18,496<br />
Total debt securities ....................................................................... 23,421 24,094 218,888 225,178<br />
Marketable equity securities .............................................................. 140,249 207,610 1,310,738 1,940,280<br />
Total ............................................................................................... ¥163,670 ¥231,704 $1,529,626 $2,165,458<br />
Held-to-maturity securities<br />
Millions of yen Thousands of U.S. dollars<br />
Cost Fair Value Cost Fair Value<br />
Due in one year or less ...................................................................... ¥28,067 ¥28,138 $262,308 $262,972<br />
Due after one year through five years ............................................... 14,300 15,116 133,645 141,271<br />
Total ............................................................................................... ¥42,367 ¥43,254 $395,953 $404,243
Notes to Consolidated Financial Statements<br />
4 Affiliated Companies<br />
Investments in and amounts due from affiliated companies at March 31, 2005 and 2004 consisted of the following:<br />
Thousands of<br />
Millions of yen U.S. dollars<br />
2005 2004 2005<br />
Investments in equity securities ................................................................................... ¥262,407 ¥256,404 $2,452,402<br />
Long-term receivables .................................................................................................. 62,973 81,047 588,533<br />
¥325,380 ¥337,451 $3,040,935<br />
The financial information of affiliated companies at March 31, 2005 and 2004 and for the years ended March 31, 2005, 2004 and 2003, is<br />
summarized as follows:<br />
Thousands of<br />
Millions of yen U.S. dollars<br />
2005 2004 2005<br />
Total assets ................................................................................................................... ¥3,096,975 ¥3,166,112 $28,943,691<br />
Total liabilities ................................................................................................................ 2,458,736 2,525,835 22,978,841<br />
Net assets ..................................................................................................................... ¥ 638,239 ¥ 640,277 $ 5,964,850<br />
Thousands of<br />
Millions of yen U.S. dollars<br />
2005 2004 2003 2005<br />
Total volume of trading transactions .................................................. ¥5,353,268 ¥5,680,914 ¥5,840,322 $50,030,542<br />
Net income ........................................................................................ 79,998 32,753 58,711 747,645<br />
The Company’s transactions with affiliated companies for the years ended March 31, 2005, 2004 and 2003 were as follows:<br />
Millions of yen<br />
Thousands of<br />
U.S. dollars<br />
2005 2004 2003 2005<br />
Sale transactions ................................................................................ ¥360,027 ¥319,276 ¥458,504 $3,364,738<br />
Purchase transactions ........................................................................ 199,210 158,592 442,467 1,861,776<br />
The unamortized balance of the difference between the cost of<br />
investment in affiliated companies and the Company’s equity in the net<br />
assets at the dates of acquisition amounted to ¥9,326 million ($87,159<br />
thousand) and ¥7,221 million at March 31, 2005 and 2004, respectively.<br />
Certain investments in the common stock of affiliated companies<br />
5 Loans and Allowance for Doubtful Accounts<br />
The changes in the allowance for doubtful accounts are summarized as follows:<br />
are marketable equity securities, which have carrying values of<br />
¥37,325 million ($348,832 thousand) and ¥46,271 million at March<br />
31, 2005 and 2004, respectively, with corresponding aggregate<br />
quoted market values of ¥55,908 million ($522,505 thousand) and<br />
¥48,449 million.<br />
Millions of yen<br />
Thousands of<br />
U.S. dollars<br />
2005 2004 2003 2005<br />
Balance at beginning of year .............................................................. ¥120,814 ¥142,530 ¥149,554 $1,129,103<br />
Provision ........................................................................................ 6,298 805 5,660 58,860<br />
Charge-offs .................................................................................... (18,572) (21,096) (7,999) (173,570)<br />
Other .............................................................................................. 776 (1,425) (4,685) 7,252<br />
Balance at end of year ....................................................................... ¥109,316 ¥120,814 ¥142,530 $1,021,645<br />
At March 31, 2005 and 2004, the recorded investments in loans<br />
that are considered to be impaired under SFAS 114 were ¥185,934<br />
million ($1,737,701 thousand) and ¥264,500 million, respectively, and<br />
the allowance for credit losses related to those loans were ¥99,476<br />
million ($929,682 thousand) and ¥111,804 million, respectively. The<br />
recorded investment in the impaired loans, net of the valuation<br />
allowance, is either secured by collateral or considered collectible<br />
based upon various analyses. The average recorded investments in<br />
impaired loans were ¥230,778 million ($2,156,804 thousand),<br />
¥283,259 million and ¥300,570 million for the years ended March 31,<br />
2005, 2004 and 2003, respectively. The Companies generally do not<br />
accrue for interest on those loans and recognize interest income on a<br />
cash basis, which was ¥2,901 million ($27,112 thousand) for the year<br />
ended March 31, 2005. Such amounts were not significant for the<br />
years ended March 31, 2004 and 2003.
6 Long-Lived Assets<br />
The gross carrying amounts and accumulated amortization of intangible assets as of March 31, 2005 and 2004 were as follows:<br />
Millions of yen<br />
<strong>Marubeni</strong> Corporation 2005 80 / 81<br />
2005 2004<br />
Gross Gross<br />
carrying Accumulated carrying Accumulated<br />
amount amortization amount amortization<br />
Amortized intangible assets:<br />
Licenses and operating rights ........................................................ ¥22,124 ¥ (2,541) ¥21,605 ¥ (3,792)<br />
Software ........................................................................................ 11,053 (5,243) 9,002 (2,432)<br />
Additional minimum pension liability .............................................. 2,337 (725) 4,675 (2,694)<br />
Other ..............................................................................................<br />
Intangible assets not subject to amortization:<br />
11,979 (7,069) 12,919 (7,814)<br />
Land rent rights .............................................................................. 2,841 – 2,868 –<br />
Other .............................................................................................. 792 – 1,140 –<br />
¥51,126 ¥(15,578) ¥52,209 ¥(16,732)<br />
Thousands of U.S. dollars<br />
2005<br />
Gross<br />
carrying Accumulated<br />
amount amortization<br />
Amortized intangible assets:<br />
Licenses and operating rights ........................................................ $206,766 $ (23,748)<br />
Software ........................................................................................ 103,299 (49,000)<br />
Additional minimum pension liability .............................................. 21,841 (6,776)<br />
Other ..............................................................................................<br />
Intangible assets not subject to amortization:<br />
111,953 (66,065)<br />
Land rent rights .............................................................................. 26,552 –<br />
Other .............................................................................................. 7,402 –<br />
The amortized intangible assets acquired during the year ended<br />
March 31, 2005 totaled to ¥5,337 million ($49,879 thousand) and<br />
consisted primarily of operating rights of ¥2,346 million ($21,925<br />
thousand) and software of ¥2,335 million ($21,822 thousand). The<br />
weighted-average amortization periods of operating rights and<br />
software acquired for the year ended March 31, 2005 are 23 years<br />
(straight-line method) and 5 years (straight-line method), respectively.<br />
$477,813 $(145,589)<br />
The amount of the residual value of the amortized intangible assets<br />
is not significant.<br />
The amortization expense for intangible assets was ¥5,899 million<br />
($55,131 thousand) and ¥7,021 million for the years ended March 31,<br />
2005 and 2004. The estimated amortization expense for the next five<br />
years is as follows:<br />
Thousands of<br />
For the year ending March 31 Millions of yen U.S. dollars<br />
2006 ..................................................................................................................................................... ¥4,137 $38,664<br />
2007 ..................................................................................................................................................... 3,608 33,720<br />
2008 ..................................................................................................................................................... 2,702 25,252<br />
2009 ..................................................................................................................................................... 2,223 20,776<br />
2010 ..................................................................................................................................................... 1,631 15,243
Notes to Consolidated Financial Statements<br />
The changes in the carrying amount of goodwill by operating segment for the years ended March 31, 2005 and 2004, are as follows:<br />
Millions of yen<br />
Transportation Telecom Overseas<br />
Agri-marine and industrial and corporate<br />
products Chemicals Energy machinery information subsidiaries Total<br />
Balance at March 31, 2003 ............. ¥ – ¥1,819 ¥ – ¥5,332 ¥8,103 ¥ 8,299 ¥23,553<br />
Goodwill acquired during the year .. 7,371 – 993 – – – 8,364<br />
Impairment losses .......................... – (774) – (681) – – (1,455)<br />
Effect of exchange rate and other .. – 46 – (594) (7) (1,114) (1,669)<br />
Balance at March 31, 2004 ............. 7,371 1,091 993 4,057 8,096 7,185 28,793<br />
Goodwill acquired during the year .. – – – – – – –<br />
Impairment losses .......................... – – – – – – –<br />
Effect of exchange rate and other .. (78) 56 (993) (15) – (254) (1,284)<br />
Balance at March 31, 2005 ............. ¥7,293 ¥1,147 ¥ – ¥4,042 ¥8,096 ¥ 6,931 ¥27,509<br />
Thousands of U.S. dollars<br />
Transportation Telecom Overseas<br />
Agri-marine and industrial and corporate<br />
products Chemicals Energy machinery information subsidiaries Total<br />
Balance at March 31, 2004 ............. $68,888 $10,196 $ 9,280 $37,916 $75,663 $67,150 $269,093<br />
Goodwill acquired during the year .. – – – – – – –<br />
Impairment losses .......................... – – – – – – –<br />
Effect of exchange rate and other .. (729) 524 (9,280) (140) – (2,375) (12,000)<br />
Balance at March 31, 2005 ............. $68,159 $10,720 $ – $37,776 $75,663 $64,775 $257,093<br />
As a result of decreases in the estimated future cash flows due to<br />
the worsened business circumstance and conditions and changes in<br />
the management strategies, the Companies recognized impairment<br />
losses on goodwill of ¥1,455 million for the year ended March 31,<br />
2004. There was no impairment loss on goodwill recognized for the<br />
year ended March 31, 2005. The fair value of the reporting unit was<br />
estimated using the expected present value of future cash flows.<br />
Due to decreases in expected future cash flows below their<br />
carrying amounts, the Company and certain of its subsidiaries<br />
recognized impairment losses primarily on their facility, real estate<br />
and plant in the total amount of ¥13,558 million ($126,710 thousand),<br />
7 Pledged Assets<br />
which are included in loss on property, plant and equipment on the<br />
consolidated statement of income, for the year ended March 31,<br />
2005, based on their fair value. The fair value was primarily estimated<br />
using the discounted cashflow method and third-party appraisals.<br />
The segments affected by the impairment losses were primarily<br />
Forest product and general merchandise of ¥4,251 million ($39,729<br />
thousand), Development and construction of ¥3,664 million ($34,243<br />
thousand), Agri-marine products of ¥2,548 million ($23,813 thousand)<br />
and Telecom and information of ¥1,813 million ($16,944 thousand).<br />
The amounts of impairment losses for the years ended March 31,<br />
2004 and 2003 were immaterial.<br />
The following table summarizes assets pledged as collateral for the Company’s obligations at March 31, 2005 and 2004:<br />
Millions of yen<br />
Thousands of<br />
U.S. dollars<br />
2005 2004 2005<br />
Time deposits ...............................................................................................................<br />
Investment securities, securities and other investments and investments in<br />
¥ 7,967 ¥ 430 $ 74,458<br />
affiliated companies .................................................................................................... 134,882 159,523 1,260,579<br />
Notes, loans and accounts receivable – trade (current and non-current) ...................... 40,977 35,342 382,963<br />
Inventories ....................................................................................................................<br />
Property, plant and equipment, and property leased to others,<br />
12,543 23,732 117,224<br />
net of accumulated depreciation ................................................................................. 256,407 228,481 2,396,327<br />
Other assets ................................................................................................................. 10,836 4,877 101,271<br />
¥463,612 ¥452,385 $4,332,822
The obligations secured by such collateral were as follows:<br />
<strong>Marubeni</strong> Corporation 2005 82 / 83<br />
Thousands of<br />
Millions of yen U.S. dollars<br />
2005 2004 2005<br />
Short-term loans ........................................................................................................... ¥ 36,157 ¥ 19,566 $ 337,916<br />
Other current liabilities .................................................................................................. 12,930 11,906 120,841<br />
Long-term debt ............................................................................................................. 201,470 184,444 1,882,897<br />
Guarantees of contracts, etc. ........................................................................................ 10,533 11,552 98,439<br />
In addition, acceptances payable at March 31, 2005 and 2004<br />
were secured by trust receipts on inventories, the standard terms of<br />
which provide that the proceeds from the sales of any such collateral<br />
be delivered to the respective bank to be applied against outstanding<br />
acceptances. However, the Companies have, in general, followed<br />
the practice of paying acceptances on their maturity dates. Given the<br />
substantial volume of the Company’s transactions, it would not be<br />
practicable to determine the total amount of inventories and/or<br />
8 Short-Term Loans and Long-Term Debt<br />
Short-term loans at March 31, 2005 and 2004 consisted of:<br />
¥261,090 ¥227,468 $2,440,093<br />
proceeds from the sales of such inventories covered by outstanding<br />
trust receipts.<br />
As is customary in Japan, security, if requested by a lending bank,<br />
must be given and the bank has the right to offset cash deposited<br />
with it against any debt or obligations that become due and, in the<br />
case of default or certain other specified events, against all debt<br />
payable to the bank. To date, no such request has been made to the<br />
Companies and no such rights have been exercised.<br />
Millions of yen<br />
Thousands of<br />
U.S. dollars<br />
2005 2004 2005<br />
Short-term loans from banks and others ...................................................................... ¥344,597 ¥467,735 $3,220,533<br />
Commercial paper ......................................................................................................... – 7,000 –<br />
Long-term debt at March 31, 2005 and 2004 consisted of:<br />
¥344,597 ¥474,735 $3,220,533<br />
Millions of yen<br />
Thousands of<br />
U.S. dollars<br />
2005 2004 2005<br />
4.0% reverse dual currency notes due 2005 ................................................................ ¥ 11,898 ¥ 11,898 $ 111,196<br />
2.12% notes due 2004 ................................................................................................. – 4,600 –<br />
2.5% notes due 2004 ................................................................................................... – 8,700 –<br />
2.3% notes due 2004 ................................................................................................... – 7,600 –<br />
2.37% notes due 2004 ................................................................................................. – 3,400 –<br />
2.13% notes due 2005 ................................................................................................. 5,800 5,800 54,206<br />
1.52% notes due 2004 ................................................................................................. – 10,600 –<br />
1.75% notes due 2008 with prepayment options ........................................................ – 4,400 –<br />
1.2% notes due 2004 ................................................................................................... – 8,300 –<br />
1.48% notes due 2006 ................................................................................................. 3,800 3,800 35,514<br />
1.15% notes due 2005 ................................................................................................. 36,637 36,637 342,402<br />
1.27% notes due 2006 ................................................................................................. 7,700 7,700 71,963<br />
1.13% notes due 2006 ................................................................................................. 28,100 28,100 262,617<br />
0.81% notes due 2004 ................................................................................................. – 27,163 –<br />
Libor + 0.73% notes due 2007 ..................................................................................... 15,578 15,578 145,589<br />
2.0% notes due 2006 ................................................................................................... 15,000 15,000 140,187<br />
1.91% notes due 2006 ................................................................................................. 10,000 10,000 93,458<br />
1.27% notes due 2007 ................................................................................................. 10,000 10,000 93,458<br />
1.11% notes due 2007 ................................................................................................. 10,000 10,000 93,458<br />
1.43% notes due 2009 ................................................................................................. 10,000 – 93,458<br />
1.38% notes due 2009 ................................................................................................. 15,000 – 140,187<br />
0.86% notes due 2007 ................................................................................................. 10,000 – 93,458<br />
1.28% notes due 2009 ................................................................................................. 10,000 – 93,458<br />
0.98% notes due 2009 ................................................................................................. 10,000 – 93,458<br />
0.87% notes due 2010 ................................................................................................. 20,000 – 186,916
Notes to Consolidated Financial Statements<br />
Thousands of<br />
Millions of yen U.S. dollars<br />
2005 2004 2005<br />
1.32% notes due 2012 ................................................................................................. ¥ 10,000 ¥ – $ 93,458<br />
1.38% notes due 2012 ................................................................................................. 10,000 – 93,458<br />
1.37% notes due 2015 with prepayment options ........................................................ 5,000 – 46,729<br />
0.85% convertible debentures due 2006 ......................................................................<br />
Medium-term notes due from 2004 to 2007 principally at rates from<br />
64,500 64,500 602,804<br />
0.5% to 4.6% or at floating rates ................................................................................<br />
Loans from government-owned banks and government agencies:<br />
13,572 21,828 126,841<br />
Secured, due serially through 2016 principally at rates from 0.2% to 6.7% ............. 12,922 60,049 120,766<br />
Unsecured, due serially through 2016 principally at rates from 0.9% to 5.6% ........<br />
Loans principally from banks and insurance companies:<br />
95,524 54,511 892,748<br />
Secured, due serially through 2018 principally at rates from 0.5% to 12.6% ........... 186,027 119,875 1,738,570<br />
Unsecured, due serially through 2014 principally at rates from 0.2% to 8.0% ........ 1,313,785 1,427,061 12,278,364<br />
Other ............................................................................................................................. 187,380 174,189 1,751,214<br />
.......................................................................................................................... 2,128,223 2,151,289 19,889,935<br />
Less current portion .................................................................................................. 314,501 328,816 2,939,262<br />
To hedge against exposure related to the payment of interest and<br />
the repayment of the principal of certain short-term loans and longterm<br />
debt denominated in foreign currencies, the Company and<br />
certain of its subsidiaries enter into foreign exchange contracts.<br />
To strengthen the asset liability management and to hedge against<br />
exposure to changes in foreign currency exchange rates, the Company<br />
and certain of its subsidiaries entered into several interest rate swap<br />
agreements, including interest rate and currency swap agreements.<br />
The floating interest rates are, in general, based upon the six-month or<br />
three-month LIBOR (London Interbank Offered Rate). The interest rate<br />
swap agreements are to remain in effect through the maturity dates of<br />
the short-term loans and long-term debt.<br />
The indentures covering the 0.85% convertible debentures due<br />
2006 issued in November 1996 provide that (1) the holders may<br />
convert the debentures into shares of common stock at the<br />
conversion price of ¥539 ($5.0), and (2) the debentures are redeemable<br />
at the option of the Company at price of 100% of the principal<br />
amounts after March 31, 2005.<br />
¥1,813,722 ¥1,822,473 $16,950,673<br />
The Company had an unused long-term line of credit arrangement<br />
of ¥200,000 million ($1,869,159 thousand) with a syndicate of<br />
financial institutions and unused long-term refinance arrangements of<br />
¥100,786 million ($941,925 thousand) with certain financial institutions<br />
at March 31, 2005. Of such arrangements, ¥259,591 million<br />
($2,426,084 thousand) was utilized to reclassify short-term loans and<br />
long-term debt due within one year to long-term debt on the<br />
consolidated balance sheet at March 31, 2005, as the Company had<br />
an intention and ability to refinance them when due. The Company<br />
had an unused long-term line of credit of ¥152,000 million and<br />
reclassified short-term loans and long-term debt due within one year<br />
to long-term debt of ¥119,679 million on the consolidated balance<br />
sheet at March 31, 2004.<br />
In addition to the above, the Company and certain of its subsidiaries<br />
have unused short-term lines of credit of ¥215,000 million<br />
($2,009,346 thousand) and $415 million at March 31, 2005.<br />
Long-term debt subsequent to March 31, 2005 matures as follows:<br />
Thousands of<br />
Year ending March 31 Millions of yen U.S. dollars<br />
2006 ..................................................................................................................................................... ¥314,501 $2,939,262<br />
2007 ..................................................................................................................................................... 404,878 3,783,907<br />
2008 ..................................................................................................................................................... 479,744 4,483,589<br />
2009 ..................................................................................................................................................... 173,220 1,618,879<br />
2010 ..................................................................................................................................................... 212,095 1,982,196<br />
Thereafter ............................................................................................................................................ 543,785 5,082,102<br />
Certain agreements principally with Government-owned financial<br />
institutions provide that earlier repayment may be required if, in the<br />
judgment of the lenders, the Company or certain of its subsidiaries<br />
have achieved higher than expected earnings or received sufficient<br />
proceeds from the issuance of common stock or debentures to repay<br />
its loans. To date, none of the lenders has made such a request.<br />
Certain of the long-term debt agreements stipulate, among other<br />
things, that the Companies, upon request, submit for the lenders’<br />
approval the proposed appropriations of income, including dividends,<br />
before such appropriations can be submitted to the shareholders.<br />
The Companies have never received such a request.
9 Employees’ Retirement Benefits<br />
The Company and certain of its subsidiaries have unfunded lumpsum<br />
retirement plans which, in general, cover all employees other<br />
than directors. In addition, the Company and certain of its subsidiaries<br />
have contributory and non-contributory funded pension plans with<br />
independent trustees covering eligible employees. Under the terms<br />
of the lump-sum retirement plans, eligible employees are entitled<br />
under most circumstances, upon mandatory retirement or earlier<br />
voluntary severance, to indemnities based on their compensation as<br />
of the date of severance and years of service.<br />
Effective April 1, 2003, the Company amended its welfare<br />
pension plan to introduce a cash balance plan and to reduce benefits<br />
of certain eligible people, and received approval from the Japanese<br />
government on June 5, 2003.<br />
On April 15, 2003 and May 1, 2004, the <strong>Marubeni</strong> Welfare<br />
Pension Fund received approval from the Japanese government to<br />
transfer the future and past benefit obligations related to the<br />
substitutional portion for the government-defined benefit prescribed<br />
by the Welfare Pension Insurance Law of Japan, respectively. On<br />
August 25, 2005 the Company transferred them to the government.<br />
According to the consensus reached by the Emerging Issue Task<br />
Force on Issue No. 03-2, Accounting for the Transfer to the Japanese<br />
<strong>Marubeni</strong> Corporation 2005 84 / 85<br />
Government of the Substitutional Portion of Employee Pension Fund<br />
Liabilities, and Statement of Financial Accounting Standards No. 88,<br />
Employers’ Accounting for Settlements and Curtailments of Defined<br />
Benefit Pension Plans and for Termination Benefits, the Company<br />
accounted for the entire process as a settlement upon completion of<br />
the transfer to the Japanese government of the substitutional portion<br />
of the future and past benefit obligations and the related plan asset.<br />
During the year ended March 31, 2003, the Company contributed<br />
¥22,246 million to a trust which was established to provide pension<br />
benefits and to maintain sound funding status, and is legally<br />
segregated from the Company. During the years ended March 31,<br />
2005 and 2004, the Company withdrew cash of ¥15,000 million<br />
($140,187 thousand) and ¥5,000 million from the trust, respectively,<br />
since the plan assets exceeded the benefit obligations due to an<br />
increase in fair value of plan assets and the transfer of the above<br />
benefit obligations.<br />
The measurement date used to determine pension benefit<br />
obligations and plan assets was mainly March 31.<br />
The reconciliation of beginning and ending balances of the<br />
projected benefit obligation and plan assets, and the funded status of<br />
the Company’s and certain subsidiaries’ plans are as follows:<br />
Millions of yen<br />
Thousands of<br />
U.S. dollars<br />
2005 2004 2005<br />
Change in projected benefit obligation<br />
Projected benefit obligation at beginning of year .......................................................... ¥245,034 ¥244,268 $2,290,037<br />
Service cost .............................................................................................................. 6,040 6,051 56,449<br />
Interest cost .............................................................................................................. 5,838 6,245 54,561<br />
Actuarial (gains) losses .............................................................................................. (97) 2,987 (907)<br />
Foreign currency exchange rate changes ................................................................. (491) (1,595) (4,589)<br />
Benefits paid ............................................................................................................. (10,843) (12,522) (101,336)<br />
Plan amendment ....................................................................................................... – (400) –<br />
Transfer of the substitutional portion of the employee pension fund and other ....... (35,990) – (336,355)<br />
Projected benefit obligation at end of year ...................................................................<br />
Change in plan assets<br />
209,491 245,034 1,957,860<br />
Fair value of plan assets at beginning of year ............................................................... 251,310 232,943 2,348,692<br />
Actual return on plan assets ..................................................................................... 8,653 29,795 80,869<br />
Foreign currency exchange rate changes ................................................................. (409) (1,374) (3,822)<br />
Employees’ contributions ......................................................................................... 257 253 2,402<br />
Employer’s contribution ............................................................................................ 2,327 3,537 21,748<br />
Benefits paid ............................................................................................................. (8,809) (8,844) (82,327)<br />
Transfer of the substitutional portion of the employee pension fund and other ....... (36,521) (5,000) (341,319)<br />
Fair value of plan assets at end of year ......................................................................... 216,808 251,310 2,026,243<br />
Funded status ............................................................................................................... 7,317 6,276 68,383<br />
Unrecognized prior service cost .................................................................................... (17,242) (18,028) (161,140)<br />
Unrecognized net loss .................................................................................................. 90,139 113,583 842,421<br />
Net amount recognized ................................................................................................. ¥ 80,214 ¥101,831 $ 749,664<br />
Amounts recognized in the consolidated balance sheet consist of:<br />
Prepaid benefit cost – current ................................................................................... ¥ 2,106 ¥ 1,784 $ 19,683<br />
Prepaid benefit cost – noncurrent ............................................................................. 84,709 105,797 791,673<br />
Accrued benefit liability ............................................................................................. (9,319) (8,786) (87,093)<br />
Intangible assets ....................................................................................................... 1,612 1,981 15,065<br />
Accumulated other comprehensive income, before tax ........................................... 1,106 1,055 10,336<br />
Net amount recognized ................................................................................................. ¥ 80,214 ¥101,831 $ 749,664
Notes to Consolidated Financial Statements<br />
The accumulated benefit obligation for all defined benefit pension<br />
plans was ¥201,629 million ($1,884,383 thousand) and ¥235,303<br />
million at March 31, 2005 and 2004, respectively.<br />
The changes in minimum liability included in other comprehensive<br />
income, excluding tax effect, were ¥55 million ($514 thousand) and<br />
¥43 million of losses for the years ended March 31, 2005 and 2004,<br />
respectively.<br />
The components of net pension expense of the Company’s and<br />
certain subsidiaries’ plans for the years ended March 31, 2005, 2004<br />
and 2003 were as follows:<br />
Millions of yen<br />
Thousands of<br />
U.S. dollars<br />
2005 2004 2003 2005<br />
Service cost – benefits earned during the year .................................. ¥ 6,040 ¥ 6,051 ¥ 8,417 $ 56,449<br />
Interest cost on projected benefit obligation ..................................... 5,838 6,245 7,371 54,561<br />
Expected return on plan assets ......................................................... (6,763) (8,214) (7,782) (63,206)<br />
Net amortization and deferrals ........................................................... 4,724 5,799 4,580 44,150<br />
Employees’ contributions ..................................................................<br />
Net loss on transfer of the substitutional portion of the<br />
(257) (253) (706) (2,402)<br />
employee pension fund liabilities ..................................................... 1,453 – – 13,579<br />
Net pension expense ......................................................................... ¥11,035 ¥ 9,628 ¥11,880 $103,131<br />
Details of the net loss on the transfer of the substitutional portion of the employee pension fund liabilities is as follows:<br />
Thousands of<br />
Millions of yen U.S. dollars<br />
Subsidy from government .......................................................................................................................<br />
Settlement loss:<br />
¥(13,405) $(125,281)<br />
Derecognition of accrued salary progression ....................................................................................... (1,064) (9,944)<br />
Recognition of unrealized actuarial loss ............................................................................................... 15,922 148,804<br />
¥ 1,453 $ 13,579<br />
The aggregate projected benefit obligation and aggregate fair value of plan assets for pension plans with projected benefit obligations in<br />
excess of plan assets are as follows:<br />
Thousands of<br />
Millions of yen U.S. dollars<br />
2005 2004 2005<br />
Aggregate projected benefit obligation ......................................................................... ¥33,021 ¥30,455 $308,607<br />
Aggregate fair value of plan assets ............................................................................... 21,802 19,938 203,757<br />
The aggregate accumulated benefit obligation and aggregate fair value of plan assets for pension plans with accumulated benefit obligations in<br />
excess of plan assets are as follows:<br />
Thousands of<br />
Millions of yen U.S. dollars<br />
2005 2004 2005<br />
Aggregate accumulated benefit obligation ................................................................... ¥21,600 ¥19,834 $201,869<br />
Aggregate fair value of plan assets ............................................................................... 12,373 11,201 115,636<br />
The weighted-average assumptions used to determine benefit obligations at March 31, 2005, 2004 and 2003 were as follows:<br />
2005 2004 2003<br />
Discount rates ............................................................................................................... 2.5% 2.5% 2.5%<br />
Rates of increases in future salary levels ...................................................................... 4.7% 4.8% 3.3%<br />
The weighted-average assumptions used to determine net pension expenses for the years ended March 31, 2005, 2004 and 2003 were<br />
as follows:<br />
2005 2004 2003<br />
Discount rates ............................................................................................................... 2.5% 2.5% 3.0%<br />
Rates of increases in future salary levels ...................................................................... 4.8% 3.3% 3.3%<br />
Expected long-term rates of return on plan assets ....................................................... 2.7% 3.0% 3.0%<br />
The expected long-term rates of return are calculated based on the historical returns for certain years adjusted by the target rate of return for<br />
the components of the current asset portfolio.
The weighted-average asset allocations of the Company’s pension plans at March 31, 2005 and 2004 were as follows:<br />
<strong>Marubeni</strong> Corporation 2005 86 / 87<br />
Asset category 2005 2004<br />
Equity securities ....................................................................................................................................... 38.3% 29.9%<br />
Debt securities ......................................................................................................................................... 45.0 42.6<br />
Other ........................................................................................................................................................ 16.7 27.5<br />
Total ......................................................................................................................................................... 100.0% 100.0%<br />
Plan assets are generally invested 40%, 50% and 10% in equity<br />
securities, debt securities and other. The allocation to foreign equity<br />
and debt securities is approximately 30% of the total plan assets.<br />
In making investment decisions, the main objective is to secure<br />
the necessary return over the long term to cover pension and<br />
retirement allowance liabilities. The primary investment policy is to<br />
analyze the risk/return characteristics by asset class and to invest in a<br />
diversified portfolio taking into consideration of the correlation<br />
between asset classes. The Company sets a policy asset mix with<br />
investments in equities, bonds, and alternative investments. Based<br />
on this policy, the Company selects multiple investment managers<br />
who execute the strategy. When selecting an investment manager,<br />
the Company gives consideration to management philosophy and<br />
content, investment management policy and investment style,<br />
investment control systems including information collection<br />
mechanism and decision-making process, compliance systems,<br />
investment experience and track record of the investment manager<br />
as well as their investment professional in charge of managing<br />
pension money.<br />
As a result of the introduction of the cash-balance plan, the<br />
performance of certain plan assets is matched with the related<br />
pension benefits.<br />
The benefits expected to be paid in the next ten years are as follows:<br />
Thousands of<br />
Year ending March 31 Millions of yen U.S. dollars<br />
2006 ..................................................................................................................................................... ¥ 9,186 $ 85,850<br />
2007 ..................................................................................................................................................... 9,741 91,037<br />
2008 ..................................................................................................................................................... 10,120 94,579<br />
2009 ..................................................................................................................................................... 10,450 97,664<br />
2010 ..................................................................................................................................................... 10,760 100,561<br />
2011 – 2015 ......................................................................................................................................... 55,821 521,692<br />
¥106,078 $991,383<br />
The amount of contributions expected to be paid to the plan during the year ending March 31, 2006 is approximately ¥2,400 million<br />
($22,430 thousand).<br />
10 Income Taxes<br />
The Company files a consolidated income tax return in Japan.<br />
Total income taxes recognized for the years ended March 31, 2005, 2004 and 2003 were applicable to the following:<br />
Millions of yen<br />
Thousands of<br />
U.S. dollars<br />
2005 2004 2003 2005<br />
Income before income taxes, minority interests and equity in<br />
earnings of affiliated companies ...................................................... ¥33,837 ¥35,618 ¥16,274 $316,234<br />
Equity in earnings of affiliated companies ......................................... 5,055 3,746 6,486 47,243<br />
Other comprehensive income (loss) .................................................. 7,170 28,902 (6,403) 67,009<br />
Total income taxes ............................................................................. ¥46,062 ¥68,266 ¥16,357 $430,486<br />
Taxes on income applicable to the Company would normally<br />
result in a statutory tax rates of approximately 41%, 44% (including<br />
a temporary surtax of 2%) and 44% for the years ended March 31,<br />
2005, 2004 and 2003, respectively. A reconciliation of the statutory<br />
income tax rates to the effective income tax rates expressed as a<br />
percentage of income before income taxes, minority interests and<br />
equity in earnings of affiliated companies is as follows:<br />
2005 2004 2003<br />
Statutory income tax rates ............................................................................................ 41.0% 44.0% 44.0%<br />
Tax effect of subsidiaries’ operations ........................................................................... 11.6 16.3 28.8<br />
Tax effect of permanent differences ............................................................................ 4.8 2.6 6.5<br />
Difference in tax rates of foreign subsidiaries .............................................................. (9.4) (9.8) (15.1)<br />
Tax effect on undistributed earnings of subsidiaries and other .................................... 11.7 6.0 (23.5)<br />
Effect of tax rate change ............................................................................................... – – 12.7<br />
Other ............................................................................................................................. 0.9 1.4 (8.6)<br />
Effective income tax rates ............................................................................................ 60.6% 60.5% 44.8%
Notes to Consolidated Financial Statements<br />
During March 2003, new tax legislation was enacted in Japan<br />
which reduced the Company’s and its domestic subsidiaries’<br />
statutory income tax rate from 42% to 41% for fiscal years ending<br />
after March 31, 2004. As a result, deferred income tax balances had<br />
decreased by ¥4,201 million, which had been charged to income for<br />
the year ended March 31, 2003.<br />
The significant components of deferred tax assets and deferred<br />
tax liabilities at March 31, 2005 and 2004 were as follows:<br />
Millions of yen<br />
Thousands of<br />
U.S. dollars<br />
2005 2004 2005<br />
Deferred tax assets:<br />
Allowance for doubtful accounts .............................................................................. ¥ 78,377 ¥ 78,828 $ 732,495<br />
Inventories ................................................................................................................ 9,631 7,422 90,009<br />
Investment securities ............................................................................................... 10,616 22,145 99,215<br />
Employees’ retirement benefits ............................................................................... 212 1,635 1,981<br />
Unrealized profit on Intercompany transactions ....................................................... 8,506 9,262 79,495<br />
Investments in affiliated companies ......................................................................... 9,904 17,535 92,561<br />
Net operating loss carryforwards .............................................................................. 29,959 40,352 279,991<br />
Other ......................................................................................................................... 42,138 30,745 393,814<br />
Total deferred tax assets .............................................................................................. 189,343 207,924 1,769,561<br />
Valuation allowance ...................................................................................................... (32,725) (40,974) (305,841)<br />
Total deferred tax assets – net .....................................................................................<br />
Deferred tax liabilities:<br />
156,618 166,950 1,463,720<br />
Property, plant and equipment .................................................................................. 31,940 28,838 298,505<br />
Undistributed earnings .............................................................................................. 4,557 4,151 42,589<br />
Other ......................................................................................................................... 10,054 8,896 93,962<br />
Total deferred tax liabilities ........................................................................................... 46,551 41,885 435,056<br />
Net deferred tax assets ................................................................................................ ¥110,067 ¥125,065 $1,028,664<br />
The net changes in the valuation allowance for deferred tax assets<br />
were ¥8,249 million ($77,093 thousand) of decrease and ¥12,690<br />
million of increase for the years ended March 31, 2005 and 2004,<br />
respectively.<br />
At March 31, 2005, certain subsidiaries had net operating loss<br />
carryforwards amounting to ¥79,549 million ($743,449 thousand) of<br />
which ¥35,273 million ($329,654 thousand) relates to domestic<br />
subsidiaries and will expire through 2012. The reminder of ¥44,276<br />
million ($413,795 thousand) relates to foreign subsidiaries, of which<br />
¥38,259 million ($357,561 thousand) will expire through 2024 and<br />
¥6,017 million ($56,234 thousand) has no expiration date.<br />
No provision has been made for Japanese income taxes on the<br />
11 Shareholders’ Equity<br />
The amount of retained earnings available for dividends under the<br />
Japanese Commercial Code (the “JCC”) is based on the amount<br />
recorded on the Company’s books maintained in accordance with<br />
Japanese accounting practices. The adjustments included in the<br />
accompanying consolidated financial statements but not recorded on<br />
the books, as explained in Note 1, have no effect on the determination<br />
of retained earnings available for dividends under the JCC. Under<br />
the JCC, the unrealized gains of ¥36,903 million ($344,888 thousand)<br />
at March 31, 2005 are deducted from the net assets used in<br />
determining retained earnings available for dividends. The retained<br />
earnings available for dividends amounted to ¥25,080 million<br />
($234,393 thousand) at March 31, 2005.<br />
At March 31, 2005, 119,666,048 shares and 219,476,744 shares<br />
of common stock were reserved for conversion of the 0.85%<br />
convertible debentures issued in 1996 and for conversion of Class I<br />
preferred stock issued in 2003, respectively.<br />
Effective October 1, 2001, the par value of the Company’s shares<br />
was eliminated, as prescribed by an amendment of the JCC.<br />
undistributed earnings of the Company’s domestic subsidiaries<br />
earned prior to March 31, 1993 or on the undistributed earnings of<br />
the Company’s foreign subsidiaries which amounted to ¥134,116<br />
million ($1,253,421 thousand) and ¥123,004 million at March 31,<br />
2005 and 2004, respectively. The Company considers such earnings<br />
to be permanently invested. Determination of the amount of the<br />
related unrecognized deferred income tax liability is not practicable.<br />
Realization of the Company’s net deferred tax assets is dependent<br />
on the Company generating sufficient taxable income or the<br />
Company executing certain available tax strategies. Although<br />
realization is not assured, management believes it is more likely than<br />
not that the net deferred tax assets will be realized.<br />
The JCC requires that an amount equal to at least 10% of cash<br />
dividends and other distributions from retained earnings paid by the<br />
Company be appropriated as a legal reserve to the extent that the<br />
total amount of additional paid-in capital and the legal reserve equals<br />
25% of the common stock. The amounts of additional paid-in capital<br />
and the legal reserve were ¥95,229 million ($889,991 thousand) and<br />
nil at March 31, 2005, respectively.<br />
At the June 26, 2002 shareholders’ meeting of the Company, the<br />
shareholders approved a proposal to eliminate the Company’s<br />
accumulated deficit of ¥148,072 million by an adjustment to the<br />
additional paid-in capital of ¥129,228 million and legal reserve<br />
¥18,844 million, as permitted by the JCC. Since there are no such<br />
laws or rules in the United States, the accompanying consolidated<br />
financial statements reflect the transaction in such a way as<br />
permitted under the JCC and recorded in its statutory books. At<br />
March 31, 2005, the amount of the retained earnings would have<br />
been ¥1,967 million ($18,383 thousand) had the Company not<br />
consummated the aforementioned transaction.
12 Preferred Stock<br />
The Company is authorized to issue 100 million shares of Class I<br />
Preferred Stock and 100 million shares of Class II Preferred Stock.<br />
Both classes of preferred stock are non-voting and have equal<br />
preference with the Company’s common stock for the payment of<br />
dividends and the distribution of assets in the event of a liquidation<br />
or dissolution of the Company. However, during a period that no<br />
preferred dividends are paid preferred shareholders have a voting<br />
right per share until preferred dividends are declared. Preferred<br />
dividends are non-cumulative and non-participating. Preferred<br />
shareholders are entitled to a liquidation distribution at ¥1,000 ($9.35)<br />
per share and do not have the right to participate in any further<br />
liquidation distributions. The Company may repurchase and hold any<br />
classes of preferred stocks, and retire them out of earnings available<br />
for distribution to the shareholders.<br />
Class I Preferred Stock<br />
Class I Preferred Stock is convertible into common stock at the<br />
option of preferred shareholders during a conversion period. Class I<br />
Preferred Stock will be mandatorily converted into common stock on<br />
the date immediately following the closing date of the conversion<br />
period. At the time of issuance, the Board of Directors will determine<br />
the issue price, annual dividend (not exceed ¥100 per share), and<br />
conversion terms, including a conversion period.<br />
On December 16, 2003, the Company issued 75.5 million shares<br />
of Class I Preferred Stock at ¥1,000 per share or ¥75,500 million in<br />
aggregate. The Company allocated ¥37,750 million to preferred stock<br />
with the remainder, net of issuance costs, recognized as capital<br />
13 Other Comprehensive Income (Loss)<br />
<strong>Marubeni</strong> Corporation 2005 88 / 89<br />
surplus based on the JCC and the decision of the Board of Directors<br />
of the Company. The annual dividend is ¥20 ($0.19) per share. At the<br />
option of the shareholders, Class I Preferred Stock is convertible into<br />
common stock during the period from September 1, 2006 to<br />
December 12, 2013 at the conversion price, which is initially the<br />
average market closing price of the common stock of the Company<br />
traded on the Tokyo Stock Exchange (the “TSE”) for the 30 business<br />
days starting from the 45th business day prior to the starting day of<br />
the conversion period, but not less than ¥50 ($0.47). The conversion<br />
price will then be reset annually on September 1 of each year from<br />
2007 to 2013 if there is a decline in the market price of the<br />
Company’s common stock, but not less than 70% of the initial<br />
conversion price or ¥50 ($0.47), whichever higher. Class I Preferred<br />
Stock shares which are not converted at the option of the shareholders<br />
will be mandatorily converted into common stock on December<br />
13, 2013, at the conversion price determined based on the average<br />
market closing price of the common stock traded on the TSE for the<br />
30 business days starting from the 45th business day prior to the<br />
date of mandatory conversion.<br />
Class II Preferred Stock<br />
Class II Preferred Stock is redeemable at the option of the Company.<br />
At the time of issuance, the Board of Directors will determine the<br />
issue price, annual dividend (not exceed ¥100 per share), and<br />
redemption terms, including a redemption price.<br />
No shares of the Class II Preferred Stock were issued and<br />
outstanding at March 31, 2005.<br />
The amount of income tax expense or benefit allocated to each component of other comprehensive income (loss) for the years ended March 31,<br />
2005, 2004 and 2003 was as follows:<br />
Millions of yen<br />
Before-tax Tax (expense) Net-of-tax<br />
amount or benefit amount<br />
2005<br />
Unrealized gains on investment securities arising during period .............................. ¥ 42,562 ¥(14,247) ¥ 28,315<br />
Less: reclassification adjustments for gains included in net income ........................ (28,082) 11,501 (16,581)<br />
Net unrealized gains .................................................................................................. 14,480 (2,746) 11,734<br />
Currency translation adjustments arising during period ............................................ (2,531) (1,764) (4,295)<br />
Less: reclassification adjustments for losses included in net income ...................... 2,993 (357) 2,636<br />
Net currency translation adjustments ....................................................................... 462 (2,121) (1,659)<br />
Unrealized gains on derivatives arising during the period ......................................... 10,512 (4,081) 6,431<br />
Less: reclassification adjustments for gains included in net income ........................ (4,330) 1,758 (2,572)<br />
Net unrealized gains on derivatives .......................................................................... 6,182 (2,323) 3,859<br />
Minimum pension liability adjustment ...................................................................... (55) 20 (35)<br />
Other comprehensive income .................................................................................. ¥ 21,069 ¥ (7,170) ¥ 13,899
Notes to Consolidated Financial Statements<br />
Before-tax<br />
Thousands of U.S. dollars<br />
Tax (expense) Net-of-tax<br />
amount or benefit amount<br />
2005<br />
Unrealized gains on investment securities arising during period .............................. $ 397,776 $(133,150) $ 264,626<br />
Less: reclassification adjustments for gains included in net income ........................ (262,449) 107,487 (154,962)<br />
Net unrealized gains .................................................................................................. 135,327 (25,663) 109,664<br />
Currency translation adjustments arising during period ............................................ (23,654) (16,486) (40,140)<br />
Less: reclassification adjustments for losses included in net income ...................... 27,972 (3,337) 24,635<br />
Net currency translation adjustments ....................................................................... 4,318 (19,823) (15,505)<br />
Unrealized gains on derivatives arising during the period ......................................... 98,243 (38,140) 60,103<br />
Less: reclassification adjustments for gains included in net income ........................ (40,467) 16,429 (24,038)<br />
Net unrealized gains on derivatives .......................................................................... 57,776 (21,711) 36,065<br />
Minimum pension liability adjustment ...................................................................... (514) 187 (327)<br />
Other comprehensive income .................................................................................. $ 196,907 $ (67,010) $ 129,897<br />
Before-tax<br />
Millions of yen<br />
Tax (expense) Net-of-tax<br />
amount or benefit amount<br />
2004<br />
Unrealized gains on investment securities arising during period .............................. ¥ 87,826 ¥(36,064) ¥ 51,762<br />
Less: reclassification adjustments for gains included in net income ........................ (14,350) 5,878 (8,472)<br />
Net unrealized gains .................................................................................................. 73,476 (30,186) 43,290<br />
Currency translation adjustments arising during period ............................................ (19,714) 1,911 (17,803)<br />
Less: reclassification adjustments for losses included in net income ...................... 3,238 (682) 2,556<br />
Net currency translation adjustments ....................................................................... (16,476) 1,229 (15,247)<br />
Unrealized losses on derivatives arising during the period ....................................... 361 (366) (5)<br />
Less: reclassification adjustments for gains included in net income ........................ (1,000) 408 (592)<br />
Net unrealized losses on derivatives ......................................................................... (639) 42 (597)<br />
Minimum pension liability adjustment ...................................................................... (43) 13 (30)<br />
Other comprehensive income .................................................................................. ¥ 56,318 ¥(28,902) ¥ 27,416<br />
Before-tax<br />
Millions of yen<br />
Tax (expense) Net-of-tax<br />
amount or benefit amount<br />
2003<br />
Unrealized losses on investment securities arising during period ............................ ¥(32,115) ¥13,079 ¥(19,036)<br />
Less: reclassification adjustments for losses included in net income ...................... 17,438 (7,151) 10,287<br />
Net unrealized loss .................................................................................................... (14,677) 5,928 (8,749)<br />
Currency translation adjustments arising during period ............................................ (26,053) (1,199) (27,252)<br />
Less: reclassification adjustments for losses included in net income ...................... 7,050 (652) 6,398<br />
Net currency translation adjustments ....................................................................... (19,003) (1,851) (20,854)<br />
Unrealized losses on derivatives arising during the period ....................................... (6,966) 2,348 (4,618)<br />
Less: reclassification adjustments for losses included in net income ...................... 873 (356) 517<br />
Net unrealized losses on derivatives ......................................................................... (6,093) 1,992 (4,101)<br />
Minimum pension liability adjustment ...................................................................... (696) 334 (362)<br />
Other comprehensive loss ........................................................................................ ¥(40,469) ¥ 6,403 ¥(34,066)
<strong>Marubeni</strong> Corporation 2005 90 / 91<br />
The accumulated balance of each component of accumulated other comprehensive losses at March 31, 2005, 2004 and 2003 was as follows:<br />
Millions of yen<br />
Unrealized Minimum Accumulated<br />
gains (losses) Currency Unrealized pension other<br />
on investment translation losses on liability comprehensive<br />
securities adjustments derivatives adjustment losses<br />
Balance at March 31, 2002 ......................................... ¥ 386 ¥(51,826) ¥ (715) ¥(220) ¥(52,375)<br />
Change in the period ................................................... (8,749) (20,854) (4,101) (362) (34,066)<br />
Balance at March 31, 2003 ......................................... (8,363) (72,680) (4,816) (582) (86,441)<br />
Change in the period ................................................... 43,290 (15,247) (597) (30) 27,416<br />
Balance at March 31, 2004 ......................................... 34,927 (87,927) (5,413) (612) (59,025)<br />
Change in the period ................................................... 11,734 (1,659) 3,859 (35) 13,899<br />
Balance at March 31, 2005 ......................................... ¥46,661 ¥(89,586) ¥(1,554) ¥(647) ¥(45,126)<br />
Thousands of U.S. dollars<br />
Unrealized Minimum Accumulated<br />
gains (losses) Currency Unrealized pension other<br />
on investment translation losses on liability comprehensive<br />
securities adjustments derivatives adjustment losses<br />
Balance at March 31, 2004 ......................................... $326,420 $(821,747) $(50,588) $(5,720) $(551,635)<br />
Change in the period ................................................... 109,664 (15,505) 36,065 (327) 129,897<br />
Balance at March 31, 2005 ......................................... $436,084 $(837,252) $(14,523) $(6,047) $(421,738)<br />
14 Segment Information<br />
The Company’s operating segments by which management<br />
evaluates performance and allocates resources are classified in<br />
terms of the nature of the products and services or areas. The<br />
segments, by products and services, are managed by the divisions of<br />
the Head Office. Domestic branches and offices, and overseas<br />
corporate subsidiaries and branches operate in the respective areas<br />
and are independent operating units. Each reportable segment<br />
purchases, distributes and markets a wide variety of industrial and<br />
consumer goods including raw materials and equipment relating to a<br />
multitude of industries and, in addition, provides the related<br />
financing, insurance and other services to these operations primarily<br />
on a worldwide basis. The Company has twelve segments identified<br />
by product and service, in addition to its domestic branches and<br />
offices, and overseas corporate subsidiaries and branches. These<br />
segments are outlined as follows:<br />
Agri-marine products: This group produces, and sells and distributes<br />
varieties of foods such as agricultural and sea-food products,<br />
processed food and beverages, raw materials and fodder and<br />
manure on a worldwide basis.<br />
Textile: As an organization handling various textile-related goods<br />
from raw materials through finished products, the group purchases<br />
and produces raw materials for apparel and designs and sells apparel<br />
and living products in addition to rendering distribution services on a<br />
worldwide basis.<br />
Forest products and general merchandise: Besides selling rubber<br />
products, footwear and housing materials, the group operates leisure<br />
facilities, manufactures and sells raw materials for paper production,<br />
paper and paperboard, and takes part in afforestation projects in<br />
Japan and internationally.<br />
Chemicals: This group handles a wide variety of goods ranging from<br />
basic materials to leading-edge finished products for bio technology<br />
industries for sale in Japan and internationally. Especially, this group<br />
focuses on furthering bolster efficient operations in electric materials,<br />
basic chemicals, resin industries in China.<br />
Energy: This group focuses on products related to energy such as oil<br />
and gas. It also enters into various businesses which benefit from<br />
the development of resources, such as retail gas stations.<br />
Metals and mineral resources: This group produces, processes and<br />
sells nonferrous light metals both domestically and internationally, in<br />
addition to processing and selling raw materials for production of<br />
steel and light metals internationally.<br />
Transportation and industrial machinery: This group imports and<br />
exports airplanes, defense-related equipment, aerospace-related<br />
equipment, vehicles, construction equipment, agro-industrial<br />
equipment, environmental and industrial equipment, personal<br />
computers and related products, and medical equipment both<br />
domestically and internationally.<br />
Utility and infrastructure: This group develops and promotes the<br />
privatization of electricity, water and solid waste businesses both<br />
domestically and internationally. In addition, the group provides<br />
construction, installation and supplies businesses related to railroads,<br />
airports, harbors, bridges and others.<br />
Plant and ship: This group handles projects and machinery related<br />
to steel, cement, petrochemical, fertilizer, oil refinery and gas, sells<br />
and holds new and old vessels and related materials, and operates<br />
the ship chartering business, domestically and internationally.<br />
Development and construction: This group develops and sells<br />
condominiums, rents and leases commercial buildings and invests in<br />
and manages real estate funds and trusts in Japan, and also<br />
develops housing and residence outside of Japan.<br />
Finance and logistics business: This group invests in and manages<br />
investment funds and trades financial instruments. It also operates a<br />
forwarding business, renders logistics related consultations and<br />
invests in infrastructure projects for logistics. In addition, this group<br />
acts as an agent in the insurance business.<br />
Telecom and information: This group is engaged in information<br />
technology-related businesses such as: IP network infrastructures;<br />
overseas communication facilities; citizen identification-related<br />
business; cellular phones; wholesale and cable and BS/CS broadcasting;<br />
IC tag and radio frequency identification (RFID); ASP/ISP, etc.,<br />
both domestically and internationally.<br />
Domestic branches and offices: Domestic branches and offices are<br />
located throughout Japan, including Hokkaido, Tohoku, Chubu,<br />
Chugoku-Shikoku, Kyushu, and handle various merchandise and carry<br />
out related activities.<br />
Overseas corporate subsidiaries and branches: Overseas<br />
corporate subsidiaries and branches are located throughout the<br />
world, primarily in North America and Europe, and handle various<br />
merchandise and perform related activities.
Notes to Consolidated Financial Statements<br />
The Companies’ operating segment information for the years ended March 31, 2005, 2004 and 2003, were as follows:<br />
Millions of yen<br />
Forest products Metals and Transportation<br />
Agri-marine and general mineral and industrial Utility and<br />
Year ended March 31, 2005 products Textile merchandise Chemicals Energy resources machinery infrastructure<br />
Total volume of trading transactions:<br />
Outside customers ....................... ¥961,434 ¥352,094 ¥752,093 ¥638,752 ¥1,772,710 ¥579,913 ¥730,779 ¥379,289<br />
Inter-segment ............................... 18,421 3,217 40,284 28,721 1,241 29,361 46,813 54<br />
Total ......................................... ¥979,855 ¥355,311 ¥792,377 ¥667,473 ¥1,773,951 ¥609,274 ¥777,592 ¥379,343<br />
Gross trading profit ........................... ¥ 71,312 ¥ 25,174 ¥ 46,612 ¥ 26,857 ¥ 42,132 ¥ 15,709 ¥ 56,098 ¥ 22,646<br />
Segment net income (loss) ............... ¥ 1,169 ¥ 2,612 ¥ 7,520 ¥ 4,513 ¥ 15,888 ¥ 9,813 ¥ 24 ¥ 5,140<br />
Segment assets ................................ ¥398,517 ¥119,807 ¥317,678 ¥167,157 ¥ 390,939 ¥195,110 ¥294,118 ¥392,192<br />
Depreciation and amortization .......... ¥ 6,006 ¥ 216 ¥ 4,250 ¥ 1,087 ¥ 8,716 ¥ 3,367 ¥ 2,925 ¥ 9,121<br />
Expenditures for segment assets ..... ¥ 6,428 ¥ 253 ¥ 2,514 ¥ 812 ¥ 9,281 ¥ 8,624 ¥ 1,586 ¥ 9,853<br />
Millions of yen<br />
Development Finance and Telecom Domestic Overseas corporate Corporate<br />
Plant and and logistics and branches subsidiaries and and<br />
Year ended March 31, 2005 ship construction business information and offices branches elimination Consolidated<br />
Total volume of trading transactions:<br />
Outside customers ....................... ¥488,223 ¥196,330 ¥ 16,951 ¥172,695 ¥126,492 ¥ 768,864 ¥ 2,818 ¥7,939,437<br />
Inter-segment ............................... 1,214 514 4,362 3,153 15,500 301,348 (494,203) –<br />
Total ......................................... ¥489,437 ¥196,844 ¥ 21,313 ¥175,848 ¥141,992 ¥1,070,212 ¥(491,385) ¥7,939,437<br />
Gross trading profit ........................... ¥ 13,332 ¥ 27,530 ¥ 5,785 ¥ 24,483 ¥ 4,898 ¥ 76,517 ¥ (23,030) ¥ 436,055<br />
Segment net income (loss) ............... ¥ (13,519) ¥ (11,362) ¥ 4,047 ¥ (9,314) ¥ (493) ¥ 6,187 ¥ 19,022 ¥ 41,247<br />
Segment assets ................................ ¥338,715 ¥317,692 ¥128,760 ¥137,758 ¥ 52,844 ¥ 435,506 ¥ 521,244 ¥4,208,037<br />
Depreciation and amortization .......... ¥ 1,958 ¥ 2,274 ¥ 260 ¥ 4,524 ¥ 164 ¥ 9,462 ¥ 11,373 ¥ 65,703<br />
Expenditures for segment assets ..... ¥ 2,149 ¥ 874 ¥ 28 ¥ 3,898 ¥ 20 ¥ 18,527 ¥ 477 ¥ 65,324<br />
Thousands of U.S. dollars<br />
Forest products Metals and Transportation<br />
Agri-marine and general mineral and industrial Utility and<br />
Year ended March 31, 2005 products Textile merchandise Chemicals Energy resources machinery infrastructure<br />
Total volume of trading transactions:<br />
Outside customers ....................... $8,985,364 $3,290,598 $7,028,907 $5,969,645 $16,567,383 $5,419,748 $6,829,710 $3,544,757<br />
Inter-segment ............................... 172,159 30,066 376,486 268,420 11,598 274,402 437,505 505<br />
Total ......................................... $9,157,523 $3,320,664 $7,405,393 $6,238,065 $16,578,981 $5,694,150 $7,267,215 $3,545,262<br />
Gross trading profit ........................... $ 666,467 $ 235,271 $ 435,626 $ 251,000 $ 393,757 $ 146,813 $ 524,280 $ 211,645<br />
Segment net income (loss) ............... $ 10,925 $ 24,411 $ 70,280 $ 42,178 $ 148,486 $ 91,710 $ 224 $ 48,037<br />
Segment assets ................................ $3,724,458 $1,119,692 $2,968,953 $1,562,215 $ 3,653,636 $1,823,458 $2,748,766 $3,665,346<br />
Depreciation and amortization .......... $ 56,131 $ 2,019 $ 39,720 $ 10,159 $ 81,458 $ 31,467 $ 27,336 $ 85,243<br />
Expenditures for segment assets ..... $ 60,075 $ 2,364 $ 23,495 $ 7,589 $ 86,738 $ 80,598 $ 14,822 $ 92,084<br />
Thousands of U.S. dollars<br />
Development Finance and Telecom Domestic Overseas corporate Corporate<br />
Plant and and logistics and branches subsidiaries and and<br />
Year ended March 31, 2005 ship construction business information and offices branches elimination Consolidated<br />
Total volume of trading transactions:<br />
Outside customers ....................... $4,562,832 $1,834,860 $ 158,421 $1,613,972 $1,182,168 $ 7,185,645 $ 26,336 $74,200,346<br />
Inter-segment ............................... 11,346 4,804 40,766 29,467 144,860 2,816,336 (4,618,720) –<br />
Total ......................................... $4,574,178 $1,839,664 $ 199,187 $1,643,439 $1,327,028 $10,001,981 $(4,592,384) $74,200,346<br />
Gross trading profit ........................... $ 124,598 $ 257,290 $ 54,065 $ 228,813 $ 45,776 $ 715,112 $ (215,233) $ 4,075,280<br />
Segment net income (loss) ............... $ (126,346) $ (106,187) $ 37,822 $ (87,047) $ (4,607)$ 57,822 $ 177,778 $ 385,486<br />
Segment assets ................................ $3,165,561 $2,969,084 $1,203,364 $1,287,458 $ 493,869 $ 4,070,150 $ 4,871,439 $39,327,449<br />
Depreciation and amortization .......... $ 18,299 $ 21,252 $ 2,430 $ 42,280 $ 1,533 $ 88,430 $ 106,290 $ 614,047<br />
Expenditures for segment assets ..... $ 20,084 $ 8,168 $ 262 $ 36,430 $ 187 $ 173,150 $ 4,459 $ 610,505
Millions of yen<br />
<strong>Marubeni</strong> Corporation 2005 92 / 93<br />
Forest products Metals and Transportation<br />
Agri-marine and general mineral and industrial Utility and<br />
Year ended March 31, 2004 products Textile merchandise Chemicals Energy resources machinery infrastructure<br />
Total volume of trading transactions:<br />
Outside customers ....................... ¥848,868 ¥349,413 ¥733,909 ¥538,363 ¥1,994,307 ¥471,211 ¥758,976 ¥360,977<br />
Inter-segment ............................... 7,942 3,451 37,599 26,163 707 21,995 23,627 41<br />
Total ......................................... ¥856,810 ¥352,864 ¥771,508 ¥564,526 ¥1,995,014 ¥493,206 ¥782,603 ¥361,018<br />
Gross trading profit ........................... ¥ 61,436 ¥ 23,914 ¥ 42,009 ¥ 24,945 ¥ 30,817 ¥ 12,163 ¥ 55,769 ¥ 20,567<br />
Segment net income (loss) ............... ¥ 6,957 ¥ 1,753 ¥ 6,253 ¥ 3,326 ¥ 10,113 ¥ 4,258 ¥ (448) ¥ 5,068<br />
Segment assets ................................ ¥417,735 ¥127,045 ¥315,720 ¥147,118 ¥ 319,584 ¥180,257 ¥306,718 ¥409,193<br />
Depreciation and amortization .......... ¥ 6,009 ¥ 318 ¥ 4,382 ¥ 1,209 ¥ 10,226 ¥ 2,714 ¥ 3,536 ¥ 4,047<br />
Expenditures for segment assets ..... ¥ 5,946 ¥ 141 ¥ 2,886 ¥ 724 ¥ 12,308 ¥ 2,907 ¥ 1,877 ¥ 2,333<br />
Millions of yen<br />
Development Finance and Telecom Domestic Overseas corporate Corporate<br />
Plant and and logistics and branches subsidiaries and and<br />
Year ended March 31, 2004 ship construction business information and offices branches elimination Consolidated<br />
Total volume of trading transactions:<br />
Outside customers ....................... ¥610,067 ¥178,247 ¥ 15,872 ¥164,605 ¥145,796 ¥ 729,620 ¥ 5,409 ¥7,905,640<br />
Inter-segment ............................... 3,030 501 2,019 3,157 13,450 305,994 (449,676) –<br />
Total ......................................... ¥613,097 ¥178,748 ¥ 17,891 ¥167,762 ¥159,246 ¥1,035,614 ¥(444,267) ¥7,905,640<br />
Gross trading profit ........................... ¥ 8,836 ¥ 27,909 ¥ 4,900 ¥ 19,952 ¥ 5,427 ¥ 73,458 ¥ (2,641) ¥ 409,461<br />
Segment net income (loss) ............... ¥ (4,451) ¥ (154) ¥ 2,502 ¥ (7,880) ¥ 718 ¥ 4,809 ¥ 1,741 ¥ 34,565<br />
Segment assets ................................ ¥343,070 ¥330,506 ¥144,432 ¥144,195 ¥ 60,625 ¥ 439,013 ¥ 568,983 ¥4,254,194<br />
Depreciation and amortization .......... ¥ 374 ¥ 2,712 ¥ 244 ¥ 4,900 ¥ 184 ¥ 9,658 ¥ 3,748 ¥ 54,261<br />
Expenditures for segment assets ..... ¥ 1,198 ¥ 608 ¥ 13 ¥ 2,295 ¥ 56 ¥ 31,935 ¥ 1,251 ¥ 66,478<br />
Millions of yen<br />
Forest products Metals and Transportation<br />
Agri-marine and general mineral and industrial Utility and<br />
Year ended March 31, 2003 products Textile merchandise Chemicals Energy resources machinery infrastructure<br />
Total volume of trading transactions:<br />
Outside customers ....................... ¥1,006,979 ¥366,742 ¥705,421 ¥547,563 ¥2,308,904 ¥414,473 ¥753,677 ¥421,743<br />
Inter-segment ............................... 16,534 3,535 40,355 22,365 849 27,871 22,901 107<br />
Total ......................................... ¥1,023,513 ¥370,277 ¥745,776 ¥569,928 ¥2,309,753 ¥442,344 ¥776,578 ¥421,850<br />
Gross trading profit ........................... ¥ 58,559 ¥ 24,494 ¥ 41,242 ¥ 29,279 ¥ 29,615 ¥ 13,984 ¥ 54,371 ¥ 11,832<br />
Segment net income (loss) ............... ¥ 7,066 ¥ 1,934 ¥ 4,868 ¥ 2,063 ¥ 6,556 ¥ 1,923 ¥ 3,567 ¥ 4,508<br />
Segment assets ................................ ¥ 347,483 ¥123,868 ¥299,009 ¥147,420 ¥ 348,338 ¥157,820 ¥292,581 ¥232,197<br />
Depreciation and amortization .......... ¥ 5,206 ¥ 378 ¥ 3,323 ¥ 4,320 ¥ 5,452 ¥ 2,477 ¥ 1,791 ¥ 2,977<br />
Expenditures for segment assets ..... ¥ 8,710 ¥ 199 ¥ 3,851 ¥ 2,418 ¥ 5,507 ¥ 1,153 ¥ 1,375 ¥ 2,641<br />
Development Finance and<br />
Millions of yen<br />
Domestic Overseas corporate Corporate<br />
Plant and and logistics branches subsidiaries and and<br />
Year ended March 31, 2003 ship construction business IT business and offices branches elimination Consolidated<br />
Total volume of trading transactions:<br />
Outside customers ....................... ¥732,978 ¥185,346 ¥ 32,479 ¥381,758 ¥158,639 ¥ 771,859 ¥ 4,742 ¥8,793,303<br />
Inter-segment ............................... 3,498 494 5,355 4,404 14,296 293,508 (456,072) –<br />
Total ......................................... ¥736,476 ¥185,840 ¥ 37,834 ¥386,162 ¥172,935 ¥1,065,367 ¥(451,330) ¥8,793,303<br />
Gross trading profit ........................... ¥ 13,866 ¥ 34,027 ¥ 6,523 ¥ 32,559 ¥ 6,081 ¥ 72,827 ¥ (4,616) ¥ 424,643<br />
Segment net income (loss) ............... ¥ 1,277 ¥ (205) ¥ 3,344 ¥ (7,990) ¥ 836 ¥ 4,943 ¥ (4,378) ¥ 30,312<br />
Segment assets ................................ ¥392,244 ¥376,963 ¥169,504 ¥245,103 ¥ 60,764 ¥ 491,371 ¥ 636,817 ¥4,321,482<br />
Depreciation and amortization .......... ¥ 283 ¥ 3,411 ¥ 12,000 ¥ 4,452 ¥ 197 ¥ 9,561 ¥ 7,837 ¥ 63,665<br />
Expenditures for segment assets ..... ¥ 582 ¥ 2,072 ¥ 7,475 ¥ 2,868 ¥ 117 ¥ 14,521 ¥ 6,174 ¥ 59,663
Notes to Consolidated Financial Statements<br />
Effective April 1, 2003, the name of the IT segment was changed to the Telecom and information business segment.<br />
The accounting policies of the reportable segments are the accounting principles generally accepted in Japan.<br />
Corporate and elimination includes differences in accounting principles generally accepted in Japan and those in the United States. The<br />
principal differences are described in Note 1.<br />
Intersegment transactions are generally priced in accordance with the prevailing market prices.<br />
Revenues from external customers by country for the year ended March 31, 2005, 2004 and 2003 were as follows:<br />
Thousands of<br />
Millions of yen U.S. dollars<br />
Country 2005 2004 2003 2005<br />
Japan .................................................................................................. ¥2,235,433 ¥2,074,965 ¥2,004,744 $20,891,897<br />
United States of America ................................................................... 404,195 429,211 406,922 3,777,523<br />
United Kingdom ................................................................................. 104,993 80,427 78,167 981,243<br />
Other .................................................................................................. 294,031 189,566 191,334 2,747,954<br />
Total ............................................................................................... ¥3,038,652 ¥2,774,169 ¥2,681,167 $28,398,617<br />
Revenues from external customers are attributed to countries based on the location of operations.<br />
Long-lived assets, including property leased to others, by country as of March 31, 2005 and 2004 were as follows:<br />
Millions of yen<br />
Thousands of<br />
U.S. dollars<br />
Country 2005 2004 2005<br />
Japan ............................................................................................................................. ¥481,329 ¥513,060 $4,498,402<br />
United States of America .............................................................................................. 115,689 115,985 1,081,206<br />
Philippines ..................................................................................................................... 60,604 67,817 566,393<br />
Other ............................................................................................................................. 158,570 94,499 1,481,962<br />
Total .......................................................................................................................... ¥816,192 ¥791,361 $7,627,963<br />
Revenues from external customers by product for the years ended March 31, 2005, 2004 and 2003 were as follows:<br />
Millions of yen<br />
Thousands of<br />
U.S. dollars<br />
Product 2005 2004 2003 2005<br />
Machinery .......................................................................................... ¥ 536,028 ¥ 418,960 ¥ 431,029 $ 5,009,607<br />
Energy ................................................................................................ 48,842 38,300 37,626 456,467<br />
Metals ................................................................................................ 299,195 255,300 246,809 2,796,215<br />
Chemicals .......................................................................................... 696,714 594,733 557,318 6,511,346<br />
Forest products and general merchandise ......................................... 334,475 346,164 337,823 3,125,935<br />
Agri-marine products .......................................................................... 662,389 623,150 546,776 6,190,552<br />
Textile ................................................................................................ 314,568 327,246 337,517 2,939,888<br />
Development and construction .......................................................... 146,441 170,316 186,269 1,368,607<br />
Total ............................................................................................... ¥3,038,652 ¥2,774,169 ¥2,681,167 $28,398,617<br />
There is no concentration by customer.<br />
15 Foreign Currency Transactions<br />
Net foreign currency transaction gains and losses included in other<br />
income–net amounted to ¥2,713 million ($25,355 thousand) of gains<br />
for the year ended March 31, 2005 and ¥5,087 million and ¥5,331<br />
million of losses for the years ended March 31, 2004 and 2003,<br />
respectively.<br />
Net foreign currency transaction gains and losses include<br />
translation gains and losses resulting from remeasuring the financial<br />
statements of certain subsidiaries in highly inflationary economies<br />
into Japanese yen.
16 Financial Instruments<br />
Risk management<br />
Substantially all the derivative instruments which the Company and<br />
certain of its subsidiaries hold are utilized to hedge related market<br />
risks, and gains and losses on the derivative instruments are offset<br />
against losses and gains on the hedged assets and liabilities. The<br />
Company and certain of its subsidiaries also enter into derivative<br />
transactions for trading purposes. The Company has internal<br />
regulations regarding positions and loss limits and the actual<br />
positions and gains/losses are periodically reported to management.<br />
Although the Company and certain subsidiaries are exposed to credit<br />
risks in the event of nonperformance by the counterparties, such<br />
risks are minimized by avoiding a concentration of counterparties,<br />
selecting counterparties with high credit ratings and maintaining<br />
strict credit control.<br />
The Company and certain of its subsidiaries have separate<br />
departments which confirm their financial transactions with the<br />
counterparties from the departments which execute them. In<br />
addition, the Company has as its “middle-office” a “Risk Management<br />
Division,” in its Tokyo Head Office. The Risk Management<br />
Division independently performs direct confirmation procedures with<br />
the counterparties to each transaction and the month-end outstanding<br />
balances, analyzes various risks and exposures, reports the<br />
results of the analysis, and monitors and controls financial risks.<br />
Furthermore, the Risk Management Division obtains derivative<br />
transaction data from the financial subsidiaries and foreign corporate<br />
subsidiaries, reports to management periodically in cooperation with<br />
the related departments, and strengthens the Company’s unified<br />
global control over derivative transactions.<br />
Foreign exchange contracts<br />
The Company and certain of its subsidiaries conduct business in<br />
various foreign currencies and enter into foreign exchange contracts<br />
principally to hedge foreign currency denominated transactions and<br />
receivables and payables to minimize the effect of foreign currency<br />
fluctuations. Gains and losses related to the hedge ineffective<br />
portion and related to the portion of hedging instruments excluded<br />
from assessment of hedge effectiveness were not significant for the<br />
years ended March 31, 2005, 2004 and 2003.<br />
Interest rate swap agreements, including interest rate and<br />
currency swap agreements<br />
The Company and certain of its subsidiaries enter into interest rate<br />
swap agreements primarily to change the fixed interest rates on the<br />
principal of certain debt securities, loans receivable, short-term loans<br />
and long-term debt to floating interest rates. Gains and losses related<br />
to the hedge ineffective portion and related to the portion of hedging<br />
instruments excluded from assessment of hedge effectiveness were<br />
not significant for the years ended March 31, 2005, 2004 and 2003. In<br />
addition, the Company and certain of its subsidiaries enter into interest<br />
rate swap agreements for trading purposes on a limited basis.<br />
Commodity futures and forward contracts<br />
The Company and certain of its subsidiaries enter into commodity<br />
futures and forward contracts principally as a means of hedging the<br />
risks associated with certain inventories, commitments and<br />
forecasted transactions. Gains and losses related to the hedge<br />
ineffective portion and related to the portion of hedging instruments<br />
excluded from the assessment of hedge effectiveness were not<br />
significant for the years ended March 31, 2005, 2004 and 2003.<br />
Other derivative instruments<br />
The Company and certain of its subsidiaries utilize option contracts<br />
primarily to hedge the risks associated with changes in interest rates<br />
and exchange rates. Gains and losses related to the hedge ineffective<br />
portion and related to the portion of hedging instruments<br />
excluded from assessment of hedge effectiveness were not<br />
significant for the years ended March 31, 2005, 2004 and 2003. In<br />
<strong>Marubeni</strong> Corporation 2005 94 / 95<br />
addition, the Company and certain of its subsidiaries enter into other<br />
derivative contracts for trading purposes on a limited basis.<br />
Fair value of financial instruments<br />
The estimated fair value of the financial instruments of the Companies<br />
has been determined using available market information or other<br />
appropriate valuation methodologies. However, considerable<br />
judgment is required in interpreting market data to develop estimates<br />
of fair value. Consequently, the estimates are not necessarily<br />
indicative of the amounts that could be realized or would be paid in a<br />
current market exchange.<br />
The following methodologies and assumptions were used by the<br />
Companies in estimating the fair value disclosures of the financial<br />
instruments:<br />
Cash and cash equivalents, and time deposits: the carrying<br />
amounts of the cash and cash equivalents, and time deposits reflected<br />
in the consolidated balance sheets approximate their fair value.<br />
Investment securities, securities and other investments: the fair<br />
value of marketable equity securities is based on quoted market<br />
prices. The carrying amount of the marketable equity securities<br />
reflected in the balance sheets represents their fair value. The fair<br />
value of investments in debt securities is based on quoted market<br />
prices or estimated using discounted cash flow analyses, based on<br />
the estimated current rates offered to the issuers for securities with<br />
similar terms and remaining maturities. It was not practicable to<br />
estimate the fair value of the investments other than marketable<br />
equity securities and debt securities without incurring excessive<br />
costs. The carrying amount of the portion of the portfolio for which<br />
fair value could not be estimated was ¥238,806 million ($2,231,832<br />
thousand) and ¥257,157 million at March 31, 2005 and 2004,<br />
respectively, and represents the cost of this portion of the portfolio,<br />
which management believes is not impaired.<br />
Non-marketable securities of ¥167,362 million ($1,564,131 thousand),<br />
included in the above at March 31, 2005, included those<br />
securities that were not evaluated for impairment because the<br />
Company did not identify any events or changes in circumstances that<br />
might have had a significant adverse effect on the fair value of those<br />
investments, in the amounts of ¥166,742 million ($1,558,336 thousand).<br />
Long-term notes, loans and accounts receivable – trade: the fair<br />
value of long-term notes, loans and accounts receivable – trade is<br />
estimated using discounted cash flow analyses, based on the<br />
interest rates currently being offered to borrowers for similar<br />
long-term notes, loans and accounts receivable – trade with similar<br />
credit ratings. The fair value of accounts receivable with collectibility<br />
concerns is reflected at their carrying value less the related allowance<br />
for doubtful accounts.<br />
Short-term loans: the carrying amount of the short-term loans<br />
reflected in the accompanying consolidated balance sheets approximates<br />
their fair value.<br />
Long-term debt: the fair value of long-term debt is estimated<br />
using discounted cash flow analyses, based on the current<br />
borrowing rates for borrowing arrangements with similar terms and<br />
remaining maturities.<br />
Foreign exchange contracts: the fair value of foreign exchange<br />
contracts is estimated based on the quoted market prices of<br />
comparable contracts, adjusted where necessary for maturity<br />
differences.<br />
Interest rate swap agreements: the fair value of interest rate<br />
swap agreements is estimated using discounted cash flow analyses,<br />
based on the current swap rates for interest rate swap agreements<br />
with similar terms and remaining periods.<br />
Commodity futures and forward contracts: the fair value of<br />
commodity futures contracts is estimated based on the quoted<br />
market prices of comparable contracts, adjusted where necessary for<br />
maturity differences.
Notes to Consolidated Financial Statements<br />
The carrying amounts and fair value of financial instruments and the derivative instruments at March 31, 2005 and 2004 were as follows<br />
(amounts in parentheses represent liabilities):<br />
Millions of yen Thousands of U.S. dollars<br />
2005 2004 2005<br />
Carrying amount Fair value Carrying amount Fair value Carrying amount Fair value<br />
Short-term investments in debt securities ........ ¥ 28,949 ¥ 29,020 ¥ 6,058 ¥ 6,068 $ 270,551 $ 271,215<br />
Long-term investments in debt securities ........<br />
Long-term notes, loans and accounts receivable –<br />
37,512 38,328 50,418 51,756 350,579 358,206<br />
trade (less allowance for doubtful accounts) ... 186,096 186,832 206,184 205,588 1,739,215 1,746,093<br />
Long-term debt .................................................<br />
Derivative instruments – assets:<br />
(2,128,223) (2,154,141) (2,151,289) (2,115,799) (19,889,935) (20,132,159)<br />
Interest rate swap agreements ..................... 22,095 22,095 26,627 26,627 206,495 206,495<br />
Foreign exchange contracts ..........................<br />
Commodity futures and forward contracts<br />
3,411 3,411 2,698 2,698 31,879 31,879<br />
and other .....................................................<br />
Derivative instruments – liabilities:<br />
76,810 76,810 48,527 48,527 717,850 717,850<br />
Interest rate swap agreements ..................... (6,031) (6,031) (8,096) (8,096) (56,364) (56,364)<br />
Foreign exchange contracts ..........................<br />
Commodity futures and forward contracts<br />
(2,427) (2,427) (5,807) (5,807) (22,682) (22,682)<br />
and other ..................................................... (80,748) (80,748) (52,292) (52,292) (754,654) (754,654)<br />
17 Concentration of Credit Risk<br />
Although the Company operates as a general trading business, their<br />
fields of business comprise export, import, domestic and offshore<br />
trading in a wide variety of industrial, agricultural and consumer<br />
products, and also involve all levels of the production process from<br />
planning, investment, and research and development, through<br />
production, distribution and marketing. In addition, the Company<br />
18 Commitments and Contingent Liabilities<br />
operates in substantially all geographic areas of the world, and their<br />
customers are diversified. Accordingly, management of the Company<br />
believes there is no significant concentration of credit risk among its<br />
customers or in its investments. The Company requires collateral to<br />
the extent considered necessary.<br />
Lessor:<br />
The Company and certain of its subsidiaries lease containers, vessels and certain other assets, some of which are classified as direct financing<br />
leases. Net investments included in Notes, loans and accounts receivable – trade in the accompanying consolidated balance sheets at March 31,<br />
2005 and 2004 are as follows:<br />
Thousands of<br />
Millions of yen U.S. dollars<br />
2005 2004 2005<br />
Total minimum lease payments to be received ............................................................ ¥ 30,985 ¥ 29,946 $ 289,579<br />
Less unearned income .................................................................................................. (10,878) (10,577) (101,663)<br />
Net investments in direct financing leases ............................................................... ¥ 20,107 ¥ 19,369 $ 187,916<br />
The total minimum lease payments to be received by year at March 31, 2005 are as follows:<br />
Year ending March 31 Millions of yen<br />
Thousands of<br />
U.S. dollars<br />
2006 ..................................................................................................................................................... ¥ 3,982 $ 37,215<br />
2007 ..................................................................................................................................................... 3,971 37,112<br />
2008 ..................................................................................................................................................... 3,709 34,664<br />
2009 ..................................................................................................................................................... 3,420 31,963<br />
2010 ..................................................................................................................................................... 2,873 26,850<br />
Thereafter ............................................................................................................................................ 13,030 121,775<br />
Total ..................................................................................................................................................... ¥30,985 $289,579
<strong>Marubeni</strong> Corporation 2005 96 / 97<br />
The Company and certain of its subsidiaries also lease power stations, containers, office buildings and certain other assets under operating<br />
leases. The cost and accumulated depreciation of the leased property at March 31, 2005 and 2004 are shown on the accompanying consolidated<br />
balance sheets. At March 31, 2005, the future minimum rentals to be received on non-cancelable operating leases were as follows:<br />
Thousands of<br />
Year ending March 31 Millions of yen U.S. dollars<br />
2006 ..................................................................................................................................................... ¥ 32,009 $ 299,150<br />
2007 ..................................................................................................................................................... 27,857 260,346<br />
2008 ..................................................................................................................................................... 25,120 234,766<br />
2009 ..................................................................................................................................................... 22,687 212,028<br />
2010 ..................................................................................................................................................... 19,396 181,271<br />
Thereafter ............................................................................................................................................ 125,561 1,173,467<br />
Total ..................................................................................................................................................... ¥252,630 $2,361,028<br />
Lessee:<br />
The Company and certain of its subsidiaries lease containers, office equipment and certain other assets, some of which are classified as capital<br />
leases. At March 31, 2005, the cost and accumulated depreciation of the leased property, included primarily in Property, plant and equipment in<br />
the accompanying consolidated balance sheets, are ¥36,304 million ($339,290 thousand) and ¥15,586 million ($145,664 thousand), respectively.<br />
The total future minimum lease payments under capital leases by year together with the capital lease obligations at March 31, 2005 are<br />
as follows:<br />
Thousands of<br />
Year ending March 31 Millions of yen U.S. dollars<br />
2006 ..................................................................................................................................................... ¥ 7,966 $ 74,449<br />
2007 ..................................................................................................................................................... 6,838 63,907<br />
2008 ..................................................................................................................................................... 2,683 25,075<br />
2009 ..................................................................................................................................................... 1,698 15,869<br />
2010 ..................................................................................................................................................... 621 5,804<br />
Thereafter ............................................................................................................................................ 360 3,363<br />
Total minimum lease payments ....................................................................................................... 20,166 188,467<br />
Less amount representing interest ...................................................................................................... (1,523) (14,233)<br />
Capital lease obligation ........................................................................................................................ ¥18,643 $174,234<br />
The Company and certain of its subsidiaries also lease containers, communication facility, vessels and certain other assets under operating<br />
leases. Rental expense amounted to ¥17,855 million ($166,869 thousand), ¥19,448 million and ¥17,269 million for the years ended March 31,<br />
2005, 2004 and 2003, respectively.<br />
At March 31, 2005, the future minimum rental payments under non-cancelable operating leases were as follows:<br />
Thousands of<br />
Year ending March 31 Millions of yen U.S. dollars<br />
2006 ..................................................................................................................................................... ¥12,044 $112,561<br />
2007 ..................................................................................................................................................... 9,478 88,579<br />
2008 ..................................................................................................................................................... 8,966 83,794<br />
2009 ..................................................................................................................................................... 7,924 74,056<br />
2010 ..................................................................................................................................................... 5,588 52,224<br />
Thereafter ............................................................................................................................................ 21,465 200,608<br />
Total ..................................................................................................................................................... ¥65,465 $611,822
Notes to Consolidated Financial Statements<br />
The future minimum rentals to be received under noncancelable<br />
subleases corresponding to the above future minimum rental<br />
payments were not significant at March 31, 2005.<br />
For the year ended March 31, 2003, the Company sold to a third<br />
party the buildings and property of Osaka headquarters and Nagoya<br />
branch for ¥12,500 million and ¥2,900 million, respectively, and<br />
leased back these facilities. The lease terms are 10 years and 2<br />
years, respectively. The Company does not have continuing<br />
involvement under the sale-leaseback transactions.<br />
The Company had commitments to make additional investments<br />
or loans in aggregate amounts of approximately ¥53,000 million<br />
($495,327 thousand) and ¥4,000 million at March 31, 2005 and 2004,<br />
respectively.<br />
The Company guarantees debt of affiliated companies and third<br />
parties in the ordinary course of business. Should the guaranteed<br />
parties fail to make payments, the Company would be required to<br />
make such payments under these guarantees. The term of the<br />
guarantees is basically one year. The related guarantee fees are<br />
primarily received quarterly or semi-annually. Certain of these<br />
19 Subsequent Events<br />
guarantees were secured by secondary guarantees issued to the<br />
Company by other parties. The outstanding balance of guarantees,<br />
which approximated the maximum potential payment under these<br />
guarantees, was ¥96,806 million ($904,729 thousand), including<br />
¥42,183 million ($394,234 thousand) to affiliated companies, at<br />
March 31, 2005, net of the amount secured by secondary guarantees<br />
issued to the Company by other parties of ¥17,246 million ($161,178<br />
thousand). The comparable amounts at March 31, 2004 were<br />
¥180,230 million, ¥110,557 million and ¥19,507 million, respectively.<br />
The Company, its subsidiaries and affiliated companies conduct<br />
business activities on a global scale and are involved in transactions<br />
which are subject to review and jurisdiction by a wide range of<br />
authorities, both in Japan and abroad. Such business activities are<br />
not without risk and, from time to time, may involve legal actions,<br />
claims or other disputes. Although there are various matters pending<br />
at any one time, management is of the opinion that settlement of all<br />
such matters pending at March 31, 2005 would not have a material<br />
effect on the consolidated financial position or results of operations<br />
of the Companies.<br />
At the June 24, 2005 annual meeting, the shareholders approved the payments of cash dividends of ¥4 ($0.04) per share of common stock or<br />
¥5,973 million ($55,822 thousand) in aggregate and of ¥20 ($0.19) per share of Class I preferred stock issued in 2003 or ¥1,510 million ($14,112<br />
thousand) in aggregate.
Report of Independent Auditors<br />
<strong>Marubeni</strong> Corporation 2005 98 / 99
Africa<br />
Abidjan<br />
Addis Ababa<br />
Algiers<br />
Harare<br />
Johannesburg<br />
Lagos<br />
Lusaka<br />
Nairobi<br />
Tripoli<br />
Europe<br />
Athens<br />
Berlin<br />
Bucharest<br />
Budapest<br />
Dublin<br />
Düsseldorf<br />
Hamburg<br />
London<br />
Madrid<br />
Milan<br />
Oslo<br />
Paris<br />
Prague<br />
Risley<br />
Stockholm<br />
Warsaw<br />
Middle East<br />
Abu Dhabi<br />
Amman<br />
Ankara<br />
Baghdad<br />
Cairo<br />
Doha<br />
Dubai<br />
Istanbul<br />
Kabul<br />
Muscat<br />
Riyadh<br />
Sana’a<br />
Tehran<br />
CIS<br />
Almaty<br />
Khabarovsk<br />
Kiev<br />
Moscow<br />
Tashkent<br />
Yuzhno-<br />
Sakhalinsk<br />
Oceania<br />
Auckland<br />
Melbourne<br />
Perth<br />
Sydney<br />
China<br />
Beijing<br />
Chang Chun<br />
Chengdu<br />
Dalian<br />
Guangzhou<br />
Hong Kong<br />
Kunming<br />
Nanjing<br />
Ningbo<br />
Qingdao<br />
Shanghai<br />
Shenzhen<br />
Tianjin<br />
Xiamen<br />
Overseas Network
Asia<br />
Bangkok<br />
Calcutta<br />
Chittagong<br />
Colombo<br />
Dhaka<br />
Goa<br />
Hanoi<br />
Ho Chi Minh City<br />
Islamabad<br />
Jakarta<br />
Kaohsiung<br />
Karachi<br />
Kota Kinabalu<br />
Kuala Lumpur<br />
Kuching<br />
Lahore<br />
Manila<br />
Mumbai (Bombay)<br />
New Delhi<br />
Phnom Penh<br />
Seoul<br />
Sibu<br />
Singapore<br />
Taipei<br />
Ulan Bator<br />
Vientiane<br />
Yangon<br />
North<br />
America<br />
Calgary<br />
Detroit<br />
Houston<br />
Los Angeles<br />
Mexico City<br />
New York<br />
Omaha<br />
Portland<br />
Silicon Valley<br />
Toronto<br />
Vancouver<br />
Washington D.C.<br />
Central and<br />
South America<br />
Bogotá<br />
Buenos Aires<br />
Caracas<br />
Lima<br />
Rio de Janeiro<br />
Salvador<br />
San José<br />
Santiago<br />
São Paulo<br />
<strong>Marubeni</strong> Corporation 2005 100 / 101<br />
Overseas Corporate<br />
Subsidiaries<br />
<strong>Marubeni</strong> America Corporation<br />
(New York)<br />
<strong>Marubeni</strong> Canada Ltd.<br />
(Vancouver)<br />
<strong>Marubeni</strong> Mexico S.A. de C.V.<br />
(Mexico City)<br />
<strong>Marubeni</strong> Venezuela C.A.<br />
(Caracas)<br />
<strong>Marubeni</strong> Brasil S.A.<br />
(São Paulo)<br />
<strong>Marubeni</strong> Argentina S.A.<br />
(Buenos Aires)<br />
<strong>Marubeni</strong> Chile LTDA.<br />
(Santiago)<br />
<strong>Marubeni</strong> Europe P.L.C.<br />
(London)<br />
<strong>Marubeni</strong> Nigeria Ltd.<br />
(Lagos)<br />
<strong>Marubeni</strong> Saudi Arabia Co., Ltd.<br />
(Riyadh)<br />
<strong>Marubeni</strong> Iran Co., Ltd.<br />
(Tehran)<br />
<strong>Marubeni</strong> India Private Ltd.<br />
(New Delhi)<br />
<strong>Marubeni</strong> Singapore Pte. Ltd.<br />
(Singapore)<br />
Dagangterus Sdn. Bhd.<br />
(Kuala Lumpur)<br />
<strong>Marubeni</strong> Thailand Co., Ltd.<br />
(Bangkok)<br />
P.T. <strong>Marubeni</strong> Indonesia<br />
(Jakarta)<br />
<strong>Marubeni</strong> Philippines Corporation<br />
(Manila)<br />
<strong>Marubeni</strong> China Co., Ltd.<br />
(Shanghai)<br />
<strong>Marubeni</strong> Hong Kong &<br />
South China Ltd.<br />
(Hong Kong)<br />
<strong>Marubeni</strong> Taiwan Co., Ltd.<br />
(Taipei)<br />
<strong>Marubeni</strong> Korea Corporation<br />
(Seoul)<br />
<strong>Marubeni</strong> Australia Ltd.<br />
(Sydney)<br />
<strong>Marubeni</strong> New Zealand Ltd.<br />
(Auckland)<br />
(As of April 1, 2005)
Major Subsidiaries and Affiliates<br />
Agri-Marine Products<br />
company name main business nationality ownership<br />
• Beni Frozen Corporation Wholesale of frozen foods Japan 85.0%<br />
• Benirei Corporation Refrigerated warehousing and wholesale of marine products Japan 93.7%<br />
Central Japan Grain Terminal Co., Ltd. Grain warehousing, stevedoring and transportation operations Japan 50.0%<br />
•Cia. Iguaçu de Café Solúvel Production of instant coffee Brazil 64.6%<br />
• Columbia Grain International, Inc. Grain trading U.S.A. 100.0%<br />
Great Wall Food (Dalian) Co., Ltd. Broiler farming and processing China 40.0%<br />
•<strong>Marubeni</strong> Chikusan Corporation Marketing of livestock, meats and processed products Japan 99.9%<br />
•<strong>Marubeni</strong> Egg Corporation Production and sales of eggs Japan 100.0%<br />
•<strong>Marubeni</strong> Foods Corporation Wholesale of coffee, tea, alcoholic beverages and foodstuffs Japan 99.9%<br />
•<strong>Marubeni</strong> Foods Investment Co., Ltd. Investment in retailers for the Agri-Marine Products Group of <strong>Marubeni</strong> Japan 100.0%<br />
•<strong>Marubeni</strong> Nisshin Feed Co., Ltd. Manufacture of compound feed Japan 60.0%<br />
•Marukoh Fisheries Co., Ltd. Wholesale of domestic and imported tuna Japan 99.1%<br />
•Melitta Japan Ltd. Coffee filter paper, equipment trading Japan 60.0%<br />
•Nacx Nakamura Corporation Wholesale, transportation and processing of frozen foods, Japan 70.0%<br />
and refrigerated warehousing<br />
•Nippon Chunky Co., Ltd. Broiler GPS farming & PS production Japan 100.0%<br />
•North Pacific Seafoods, Inc. Processing and wholesale of marine products U.S.A. 100.0%<br />
•Pacific Grain Terminal Ltd. Grain warehousing, stevedoring and transportation Japan 77.0%<br />
• Rangers Valley Cattle Station Pty. Ltd. Cattle feedlot operation Australia 100.0%<br />
•Rice World Co., Ltd. Wholesale of rice and processed rice Japan 99.0%<br />
S Foods Inc. Meat and variety meat processing and sales Japan 15.0%<br />
• Seiwa Shokuhin Co., Ltd. Wholesale of frozen foods Japan 70.0%<br />
•Stork Corporation Catering services Japan 70.0%<br />
Ten Corporation Management of “Ten-Don” fast-food chain Japan 50.6%<br />
The Maruetsu, Inc. Supermarket chain Japan 30.2%<br />
The Nisshin OilliO Group, Ltd. Seed crushing and sales of edible oils, fine chemicals and healthy food products Japan 15.2%<br />
Tobu Store Co., Ltd. Supermarket chain Japan 25.1%<br />
Tokyo Allied Coffee Roasters Co., Ltd. Manufacture and wholesale of roasted coffee Japan 23.8%<br />
• Tokyo Flour Milling Co., Ltd. Flour milling Japan 59.4%<br />
Toyo Sugar Refining Co., Ltd. Sugar refining Japan 39.3%<br />
Viñas Argentinas S.A. Production of wine and must Argentina 40.0%<br />
Weifang Meicheng Foodstuffs Broiler farming and processing China 20.0%<br />
Company Ltd.<br />
Yamaboshiya Co., Ltd. Wholesale of confectionery Japan 44.7%<br />
Textile<br />
company name main business nationality ownership<br />
•Benny Toyama Corporation Manufacture of fishing nets and warp-knit products Japan 96.7%<br />
Erawan Textile Co., Ltd. Spinning and weaving of cotton and polyester/cotton fabrics Thailand 37.2%<br />
Fabricant Co., Ltd. Production and sales of Lacoste-brand clothing Japan 33.4%<br />
• JIANGYIN NIKKE WORSTED SPINNING Production and sales of combed wool China 30.0%<br />
CO., LTD.<br />
• Kyoto <strong>Marubeni</strong> Co., Ltd. Wholesale of Japanese kimonos and related products Japan 99.9%<br />
•<strong>Marubeni</strong> Fashion Link, Ltd. Wholesale of fabrics, textile products, and fashion accessories Japan 100.0%<br />
•<strong>Marubeni</strong> Fashion Planning Corp. Consulting on fashion merchandising, planning, design and research Japan 100.0%<br />
•<strong>Marubeni</strong> Intex Co., Ltd. Wholesale of industrial and interior textiles, ready-made goods and materials Japan 99.4%<br />
•<strong>Marubeni</strong> Mate Co., Ltd. Uniform rentals and subcontracting of related clerical operations, planning, Japan 100.0%<br />
production and sales<br />
•<strong>Marubeni</strong> Tex Co., Ltd. Wholesale of textile piece goods Japan 100.0%<br />
•<strong>Marubeni</strong> Textile Asia Ltd. Import, export and domestic trading of textile materials and garments China 100.0%<br />
•<strong>Marubeni</strong> Textile Business Support, Ltd. Receiving and transfer operations for textile products Japan 100.0%<br />
•<strong>Marubeni</strong> Textile (Shanghai) Co., Ltd. Import, export and domestic trading of textile materials and garments via bases in China China 100.0%<br />
•Pacific Clothing Inc. Design, production and sales of casual wear Japan 70.0%<br />
•Passport Fashion Company Limited Production and quality control of apparel made up overseas China 100.0%<br />
•SHANGHAI TONG NUAN HONG KNITTING Production and sales of socks China 90.0%<br />
CO., LTD.<br />
• Shanghai Xin Hong Textile Co., Ltd. Spinning of synthetic yarn China 65.0%<br />
•SHANGHAI XIN SONG HONG TEXTILE Manufacture of acrylic print mats China 86.8%<br />
DECORATIONS CO., LTD.<br />
• Consolidated subsidiary
<strong>Marubeni</strong> Corporation 2005 102 / 103<br />
• SHANGHAI XIN YUAN HONG YARN Dyeing of synthetic blends, cotton and wool China 50.0%<br />
DYEING CO., LTD.<br />
Thai Textile Development & Finishing Dyeing and finishing of medium- to heavy-weight cotton and synthetic fabrics Thailand 27.5%<br />
Co., Ltd.<br />
Tokai Dyeing Co., (Thailand) Ltd. Dyeing, printing and finishing of cotton and synthetic fabrics Thailand 31.2%<br />
• WONDERFUL SAIGON GARMENT Export of uniforms and other clothing Vietnam 39.6%<br />
CO., LTD.<br />
Forest Products & General Merchandise<br />
company name main business nationality ownership<br />
• CAMS Chain Corporation Wholesale of a full range of car accessories Japan 33.3%<br />
Daishowa-<strong>Marubeni</strong> International Ltd. Manufacture and sales of pulp Canada 50.0%<br />
• Forestnet Co., Ltd. Sales and marketing of printing/writing paper by Internet,<br />
and other related services Japan 65.0%<br />
• Fukuyama Paper Co., Ltd. Manufacture of corrugating medium and paper tube materials Japan 55.0%<br />
• Koa Kogyo Co., Ltd. Manufacture of corrugating medium, containerboard and printing paper Japan 77.5%<br />
•<strong>Marubeni</strong> Building Materials Co., Ltd. Wholesale of wood products and construction materials Japan 100.0%<br />
•<strong>Marubeni</strong> Business Machines Sale of copying machines and other office equipment to Central and U.S.A. 100.0%<br />
(America), Inc. South America<br />
•<strong>Marubeni</strong> Cement & Construction Wholesale of cement and construction materials Japan 90.0%<br />
Materials Co., Ltd.<br />
•<strong>Marubeni</strong> CLS Corporation Sales of synthetic leather Japan 100.0%<br />
•<strong>Marubeni</strong> Footwear Inc. Export, import and sales of footwear Japan 100.0%<br />
•<strong>Marubeni</strong> Footwear Resources Footwear sourcing, selection and footwear production and plant sites, product planning China 100.0%<br />
Limited and development<br />
•<strong>Marubeni</strong> International Commodities Sale of natural rubber and related products Singapore 100.0%<br />
(Singapore) Pte. Ltd.<br />
•<strong>Marubeni</strong> Lumber Co., Ltd. Sawmilling and wholesale of logs and lumber Japan 100.0%<br />
•<strong>Marubeni</strong> Office Supply Co., Ltd. Conversion and sales of information processing paper Japan 97.1%<br />
• <strong>Marubeni</strong> Paper & Pulp Logistics Co., Ltd. Integrated logistics management of imported and domestic paper and pulp products Japan 91.9%<br />
•<strong>Marubeni</strong> Paper Recycle Co., Ltd. Assortment and sales of waste paper Japan 100.0%<br />
•<strong>Marubeni</strong> Pulp & Paper North America Inc. Sale of paper, paperboard, wood pulp and wood chips U.S.A. 100.0%<br />
•<strong>Marubeni</strong> Pulp & Paper Sales Co., Ltd. Wholesale of all types of paper Japan 88.2%<br />
•<strong>Marubeni</strong> Pulp & Paper Sales Sale of thermal paper, inkjet paper and pulp Germany 100.0%<br />
Europe GmbH<br />
•<strong>Marubeni</strong> Techno Rubber Corporation Wholesale of rubber materials and chemicals Japan 100.0%<br />
Marusumi Paper Co., Ltd. Manufacture and sales of printing paper and pulp Japan 32.2%<br />
•N.V. Yokohama Belgium S.A. Sale of Yokohama tires in Belgium and Luxembourg Belgium 66.6%<br />
• Pan Pacific Fiber, Inc. Waste paper collection and sales U.S.A. 66.7%<br />
•Precision Japan Ltd. Sale of shafts, grips and other golf club tuning components and accessories Japan 100.0%<br />
• Southern Plantation Forest Pty. Ltd. Hardwood plantation, chip production and sales activities Australia 57.1%<br />
Thaimac STR Co., Ltd. Sales and production of natural block rubber (STR) Thailand 49.0%<br />
• UNIMAC Rubber Company Ltd. Production and sales of natural rubber Thailand 75.0%<br />
•WA Plantation Resources Pty Ltd. Wood chip export and plantation Australia 60.0%<br />
Yokohama Reifen GmbH Sale of Yokohama tires mainly in Germany Germany 25.0%<br />
Chemicals<br />
company name main business nationality ownership<br />
• Agrovista B.V. Holding company of agrochemicals distribution companies in the U.K. and U.K. 100.0%<br />
the Netherlands<br />
•Agrovista France S.A.S. Holding company of agrochemicals and home and garden products distribution France 100.0%<br />
companies in France<br />
Ain Medical Systems Inc. Dispensing pharmacies Japan 29.8%<br />
Ain Pharmaciez Inc. Dispensing pharmacies, retail stores for health & beauty products and cosmetics Japan 15.1%<br />
Beijing Asahi Glass Electronics Co., Ltd. Manufacture and sales of multiform and frit glass China 20.0%<br />
CMK Electronics (WUXI) Co., Ltd. Development, manufacture and sales of PCB (printed circuit boards) China 20.0%<br />
Dampier Salt Limited Production and sales of salt and gypsum Australia 20.4%<br />
• Fujifilm Hungary Ltd. Sales and service for Fujifilm products and related merchandise in Hungary Hungary 100.0%<br />
(Fujifilm Magyarorszag Kft.)<br />
•Helena Chemical Company Distribution of agrochemicals, fertilizer and seeds U.S.A. 100.0%<br />
•Image Ukraine CJSC Sales of photosensitive materials and products Ukraine 76.0%<br />
Japan Opt Display Technology Co., Ltd. Manufacture and sale of liquid crystal color filters and processing of related components Japan 30.0%<br />
• Consolidated subsidiary
Major Subsidiaries and Affiliates<br />
•Jiangmen Senkei Chemical Tank Storage Operation of molten caprolactam storage facilities China 100.0%<br />
Co., Ltd.<br />
Katakura Chikkarin Co., Ltd. Manufacturing of fertilizer, marketing of LPG, feedstuffs and foods Japan 24.6%<br />
•<strong>Marubeni</strong> Chemical Asia Pacific Pte. Ltd. Import/export/offshore trade of organic and specialty chemicals Singapore 100.0%<br />
•<strong>Marubeni</strong> Chemix Corporation Sales and foreign trade of organic chemicals and specialty chemicals Japan 100.0%<br />
•<strong>Marubeni</strong> Chemicals (Shanghai) Co., Ltd. Export/import of chemicals, tripartite trade, bonded-area trading and consulting China 100.0%<br />
•<strong>Marubeni</strong> Information Technology Import/export of electronic-related components and materials China 100.0%<br />
(Shanghai) Co., Ltd.<br />
•<strong>Marubeni</strong> Plax China Ltd. Export/import of plastics materials and products, and construction materials China 100.0%<br />
•<strong>Marubeni</strong> Plax Corporation Sales and foreign trade of plastic products and resin Japan 100.0%<br />
•<strong>Marubeni</strong> Specialty Chemicals Sales and foreign trade of specialty chemicals in Europe Germany 100.0%<br />
(Europe) GmbH<br />
•<strong>Marubeni</strong> Specialty Chemicals Inc. Sales and foreign trade of specialty chemicals in the U.S. U.S.A. 100.0%<br />
•M-I Chemicals Co., Ltd. Manufacture and sales of PVC compounds Japan 100.0%<br />
Mizushima Paraxylene Co., Ltd. Production and sales of paraxylene Japan 50.0%<br />
Nantong Rayon Chemical Co., Ltd. Manufacture and sale of PMMA resin China 20.0%<br />
• Nantong Wanhong Agrochemical Co., Ltd. Formulation and sales of agrochemicals China 85.0%<br />
Nissan-Agri Co., Ltd. Production and sales of fertilizer, sales of agricultural chemicals and golf-related business Japan 35.0%<br />
• Polyglory (Hong Kong) Ltd. Manufacture and sales of PE films China 87.0%<br />
• Polytech Incorporated Manufacture and sales of polyester sheet Japan 100.0%<br />
P.T. Fukusuke Kogyo Indonesia Manufacture and sales of PE films Indonesia 35.0%<br />
•Saitama Pet Bottle Recycle Co., Ltd. Production and sales of PET flakes made from used PET bottles Japan 100.0%<br />
Shanghai Asahi Electronic Glass Co., Ltd. Manufacture and sales of glass bulbs for CRT China 25.0%<br />
• Shinko Chemical Terminal Co., Ltd. Manufacture, sales, transportation and management of storage terminals of Japan 85.5%<br />
chemical products<br />
•Tianjin Benny Sulphur Co., Ltd. Import, processing and sale of molten sulphur China 67.2%<br />
Wuxi Zhenyu Chemical Co., Ltd. Production and sales of sulphuric acid, SOP and hydrochloric acid China 44.4%<br />
• ZAO Fujifilm RU Sales of photosensitive materials and products Russia 100.0%<br />
Energy<br />
company name main business nationality ownership<br />
• Energy U.S.A. Inc. Nuclear energy-related business U.S.A. 100.0%<br />
•<strong>Marubeni</strong> Energy Corporation Sales of petroleum products; operation of oil terminals and service stations Japan 66.6%<br />
•<strong>Marubeni</strong> Ennex Corporation Management and operation of oil and gas terminals Japan 100.0%<br />
•<strong>Marubeni</strong> Liquefied Gas Corporation Sales of LPG; operation of LPG filling stations Japan 100.0%<br />
•<strong>Marubeni</strong> International Petroleum Petroleum trading primarily in Asia and Oceania Singapore 100.0%<br />
(Singapore) Pte. Ltd.<br />
•<strong>Marubeni</strong> LNG International B.V. Investment in the Qatargas LNG Project Netherlands 100.0%<br />
•<strong>Marubeni</strong> Oil & Gas (U.K.) Limited Oil and gas development and production in the North Sea U.K. 100.0%<br />
•<strong>Marubeni</strong> Oil & Gas (USA) Inc. Oil and gas development and production in the Gulf of Mexico U.S.A 100.0%<br />
•<strong>Marubeni</strong> Utility Services, Ltd. Sales of nuclear power plant-related components and services Japan 100.0%<br />
•MIECO Inc. Petroleum trading primarily in North America and the Pacific Rim U.S.A. 100.0%<br />
• MQL International B.V. Investment in the Qatargas LNG Project Netherlands 100.0%<br />
Qatar LNG Service Agency Co., Ltd. LNG importing services Japan 50.0%<br />
•Ravva Oil (Singapore) Pte. Ltd. Oil and gas development and production in India’s Ravva oilfield Singapore 100.0%<br />
Shenzhen Sino-Benny LPG Co., Ltd. Import and sales of LPG in China China 49.0%<br />
• Toh-hoku Sekiyugas Co., Ltd. Sales of petroleum products and LPG Japan 100.0%<br />
Metals & Mineral Resources<br />
company name main business nationality ownership<br />
ANT Minerals Pty. Ltd. Investing in McArthur River zinc mine in Australia Australia 20.0%<br />
East Cheer Investment Ltd. Investment in Shenzhen KTM Glass Substrates Co., Ltd., a company that manufactures China 40.0%<br />
and sells glass disk substrates for<br />
hard disk drives<br />
•<strong>Marubeni</strong> Aluminium Australia Pty. Ltd. Investment in aluminum business in Australia and sales of aluminum ingots Australia 100.0%<br />
•<strong>Marubeni</strong> Coal Pty. Ltd. Investment in coal business in Australia Australia 100.0%<br />
•<strong>Marubeni</strong> LP HOLDING B.V. Investing in Los Pelambres copper mine in Chile Netherlands 100.0%<br />
• <strong>Marubeni</strong> Metals & Minerals (Canada) Inc. Investment in aluminum business in Canada and sale of aluminum ingots Canada 100.0%<br />
•<strong>Marubeni</strong> Metals Corporation Sales of nonferrous and light metal products Japan 100.0%<br />
•<strong>Marubeni</strong> Tetsugen Co., Ltd. Sales of raw materials for steelmaking, ferro alloys and other minerals Japan 100.0%<br />
•<strong>Marubeni</strong> Thermal Coal Pty. Ltd. Investment in Dartbrook coal mine in Australia Australia 100.0%<br />
NMBG (H.K.) Ltd. Production and sales of intermediate materials used in production of China 30.0%<br />
printed circuit boards<br />
• Consolidated subsidiary
• Consolidated subsidiary<br />
<strong>Marubeni</strong> Corporation 2005 104 / 105<br />
Silbasa-Silicio de Alta Pureza da Production and sales of high purity ferro silicon Brazil 24.6%<br />
Bahia S.A.<br />
Toyo-Memory Technology Sdn. Bhd. Production of aluminum disks for hard disk drives (HDDs) Malaysia 40.0%<br />
Transportation Machinery<br />
company name main business nationality ownership<br />
•Avenue Machinery Corporation Sales of Kubota- and AGCO- brand agricultural equipment Canada 100.0%<br />
CODACA Holding & Investment Co., Ltd. Import, assembly and distribution of Hino trucks Guatemala 49.0%<br />
•Gallery Automotive Group, LLC. Sales and service of BMW, Volkswagen and Mazda vehicles U.S.A. 100.0%<br />
Hitachi Construction Machinery<br />
(Australia) Pty. Ltd.<br />
Sales and service of construction machinery in Australia Australia 20.0%<br />
• Koyo Line Ltd. Ship management, brokerage and trade of ship equipment and others Japan 100.0%<br />
Kubota Construction Machinery (Shanghai)<br />
Co., Ltd.<br />
Import, sales and after-service for Kubota small-scale construction machinery China 25.0%<br />
Kubota (Deutschland) GmbH Sales and service of Kubota tractors, generators, engines and construction machinery Germany 20.0%<br />
Kubota (U.K.) Ltd. Sales and service of Kubota tractors, generators, engines and construction machinery U.K. 40.0%<br />
Kubota Canada Ltd. Sales and service of Kubota tractors, generators, engines and construction machinery Canada 20.0%<br />
Kubota Europe S.A. Sales and service of Kubota tractors, generators, engines and construction machinery France 26.2%<br />
Kubota Tractor Australia Pty. Ltd. Sales and service of Kubota tractors, generators, engines and construction machinery Australia 20.0%<br />
• Long Island Automotive Group, Inc. Sales and service of Volvo, Land Rover, Jaguar and Porsche vehicles U.S.A. 100.0%<br />
•<strong>Marubeni</strong> Aerospace America Export of aircraft, engines, onboard equipment, space products and these U.S.A. 100.0%<br />
Corporation parts to Japan<br />
•<strong>Marubeni</strong> Aerospace Corporation Sales, export, import and lease of aircraft, engines, onboard equipment,<br />
satellites and those parts<br />
Japan 100.0%<br />
•<strong>Marubeni</strong> Auto & Construction Sales, import and export of automobiles and construction machinery, U.S.A. 100.0%<br />
Machinery America, Inc. and investment<br />
•<strong>Marubeni</strong> Auto and Construction<br />
Machinery (Russia) Co., Ltd.<br />
Import, sales and after-service of construction machinery Russia 100.0%<br />
•<strong>Marubeni</strong> Auto Dirkes GmbH Sales and service of Nissan, Mitsubishi and Fiat vehicles Germany 100.0%<br />
• <strong>Marubeni</strong> Auto Investment (UK) Limited Sales and service of Toyota and Peugeot vehicles U.K. 100.0%<br />
•<strong>Marubeni</strong> Aviation International Ltd. Aircraft lease/finance and export of helicopters, onboard equipment and these parts to Japan U.K. 100.0%<br />
•<strong>Marubeni</strong> Aviation Services Ltd. Investment in aircraft engine development programs and leasing of aircraft Cayman Islands 100.0%<br />
• MARUBENI CONSTRUCTION MACHINERY<br />
POLAND SP.Z.0.0.<br />
Sales of Komatsu construction machinery Poland 100.0%<br />
•<strong>Marubeni</strong> Construction Machinery<br />
Sales, Inc.<br />
Sales of construction machinery Japan 100.0%<br />
•<strong>Marubeni</strong> Vehicle Corporation Export, import and domestic sales of automobiles and parts Japan 100.0%<br />
• <strong>Marubeni</strong>-Komatsu Ltd. Import, sales and service of construction machinery U.K. 100.0%<br />
•N.V. <strong>Marubeni</strong> Auto and Construction<br />
Machinery (Europe) S.A.<br />
Import, distribution and service of Nissan vehicles and parts Belgium 100.0%<br />
•N.V. Nissan Belgium S.A. Wholesale and distribution of Nissan vehicles Belgium 100.0%<br />
Nissan Diesel America, Inc. Import, distribution and service of Nissan Diesel trucks U.S.A. 50.0%<br />
•Nissan <strong>Marubeni</strong> Ltda. Import, distribution and service of Nissan vehicles, trucks and parts Chile 100.0%<br />
•Nissan Norge AS Import, distribution and service of Nissan vehicles and parts Norway 100.0%<br />
•Nissan Poland Ltd. Import, distribution and service of Nissan vehicles and parts Poland 100.0%<br />
•Nissan Sverige AB Import, distribution and service of Nissan vehicles and parts Sweden 100.0%<br />
• Royal Maritime Corporation Ship leasing and financing Liberia 100.0%<br />
P.T. Astra Multi Finance Consumer financing of vehicles Indonesia 20.0%<br />
• Toyota Ghana Company Limited Import and distribution of Toyota vehicles Ghana 100.0%<br />
•UD Trucks (Oceania) Pty. Ltd. Import and distribution of Nissan Diesel trucks Australia 100.0%
Major Subsidiaries and Affiliates<br />
Industrial Machinery & Information Business<br />
company name main business nationality ownership<br />
•com Partners Co., Ltd. Outsourcing of Internet/telephone support services and solution services for companies Japan 70.9%<br />
Ecomanage Corporation Design, implementation, contracting and consulting for waste treatment business Japan 40.0%<br />
•Global Access Ltd. Providing international/domestic combined bandwidth via own fiber-optic cable Japan 99.9%<br />
•Global Solution KK Internet access service, ASP and iDC service provider Japan 99.9%<br />
Japan Cablenet Holdings Limited CATV and telecommunication operation, and management of CATV operators Japan 23.0%<br />
Koala Television Co., Ltd. CATV services in Matsudo and Nagareyama, Chiba, Japan Japan 20.5%<br />
LCA Holdings Pty. Ltd. Manufacture and sales of lighting equipment and fixtures Australia 45.0%<br />
•Marpless Communication Technologies Sales and engineering of telecommunication equipment in Africa South Africa 51.0%<br />
(Pty.) Ltd.<br />
•<strong>Marubeni</strong> Citizen-Cincom Inc. Sales of Citizen machine tools U.S.A. 60.0%<br />
•<strong>Marubeni</strong> Disc Systems, Inc. Sales of optical disc, CD and DVD machinery U.S.A. 80.0%<br />
•<strong>Marubeni</strong> Information Systems Co., Ltd. Operation and development of information and communication systems Japan 66.0%<br />
<strong>Marubeni</strong> Infotec Corporation Wholesale of PCs and peripheral equipment, semiconductors and electronics components Japan 46.9%<br />
•<strong>Marubeni</strong> Machinery Co., Ltd. Sales and distribution of printing machinery and industrial machinery Japan 100.0%<br />
•<strong>Marubeni</strong> Network Systems (Europe) B.V. Sales and engineering of telecom systems mainly in Europe and Africa Netherlands 100.0%<br />
•<strong>Marubeni</strong> Solutions Corporation Sales of computers, network products, semiconductor-related products, and SI Japan 100.0%<br />
•<strong>Marubeni</strong> Solutions USA Corporation Marketing and sales of advanced electronic equipment/devices U.S.A. 100.0%<br />
•<strong>Marubeni</strong> Tekmatex Corporation Import, export and domestic sales of textile machinery Japan 100.0%<br />
•<strong>Marubeni</strong> TEKMATEX (Thailand) Co., Ltd. Sales and technical services for textile plants and machinery Thailand 49.0%<br />
•<strong>Marubeni</strong> Techno-Systems Corporation Sales of machinery relating to media, food, beverage, packaging, chemical and Japan 100.0%<br />
environmental equipment<br />
•<strong>Marubeni</strong> Telecom Co., Ltd. Sales of telecommunications services and equipment, IT solutions and mobile contents Japan 70.8%<br />
Marunouchi Direct Access Ltd. Area local exchange carrier, providing last-mile solutions to supply dark fiber Japan 49.0%<br />
in Marunouchi, Tokyo<br />
•Mighty Card Corporation Planning, manufacture and sales of contactless IC tag systems Japan 84.8%<br />
•Mystery Channel Inc. Broadcast of Mystery Channel on satellite broadcasting and CATV Japan 67.3%<br />
Ogihara Europe Ltd. Sales and manufacture of automotive body panels and pressing die U.K. 46.5%<br />
• Shinnihon Reiki Co., Ltd. Engineering and construction of industrial-use cooling towers and accessories Japan 100.0%<br />
• TEKMATEX, INC. Import sale of textile machinery, components and others U.S.A. 100.0%<br />
• Tekmatex Europe S.A.S Sales of air jet looms, water jet looms and sizing machines and export of European France 100.0%<br />
textile machinery. Sales of other textile machinery imported from Japan<br />
Unipres Mexicana S.A. de C.V Sales and manufacture of automotive body panels Mexico 18.8%<br />
Unipres U.S.A. Inc. Sales and manufacture of automotive body panels U.S.A. 25.0%<br />
Plant, Power & Infrastructure Projects<br />
company name main business nationality ownership<br />
Aquasistema Salina Cruz S.A. de C.V. Build-operate-transfer (BOT) water recycling and desalination project for PEMEX Mexico 50.0%<br />
•Armada Power Holdings, S.L. Holding company of overseas power assets Spain 100.0%<br />
Asia Gulf Power Holding Company Investment in Taweelah B power and water project in Abu Dhabi Cayman Islands 35.0%<br />
•Axia Power Holdings Australia B.V. Holding company of overseas power assets Netherlands 100.0%<br />
Carthage Power Company sarl Build-operate-own (BOO) retail power business in Tunisia Tunisia 40.0%<br />
Chengdu Générale des Eaux-<strong>Marubeni</strong> BOT water supply project for Chengdu Municipal Government, Sichuan Province China 40.0%<br />
Waterworks Co., Ltd.<br />
Companiá de Nitrógeno de Cantarell Production and supply of nitrogen for PEMEX of Mexico Mexico 35.0%<br />
S.A. de C.V.<br />
Companiá de Servicios de Compresión de Compression of associated gas at Cantarell oil field in Mexico Mexico 50.0%<br />
Campeche, S.A. de C.V.<br />
Concesionaria Aguas Residuakes de BOT business with sewage treatment facility in Ciudad Juarez, Mexico Mexico 50.0%<br />
Juarez, S.A. de C.V.<br />
Eastern Power and Electric Company IPP in Thailand Thailand 28.0%<br />
Limited<br />
• Fuel Cell Japan, Co., Ltd. Operation and maintenance of molten carbonate fuel cells Japan 100.0%<br />
•Geoenergia de Guanacaste Ltda. Geothermal IPP in Costa Rica Costa Rica 100.0%<br />
• Hamanasu Wind Power Corporation IPP of Shimamaki Wind Farm, Hokkaido Japan 100.0%<br />
Jenets Co., Ltd. Metering of potable water and wastewater usage, utility fee collection services Japan 47.5%<br />
KAFCO Japan Investment Co., Ltd. Investment and related services for Karnaphuri Fertilizer Co., Ltd. Japan 26.8%<br />
KAJI TECHNOLOGY CORPORATION Manufacture and sales of pressing machines, textile machines, cast products, Japan 36.9%<br />
and industrial machinery<br />
•MARCOP Inc. Production and sales of pulverized coal to Gary steel plants in the U.S. U.S.A. 100.0%<br />
•<strong>Marubeni</strong> Asian Power Ltd. Asset management, marketing and development of power projects in Asia Pacific Hong Kong 100.0%<br />
•<strong>Marubeni</strong> Energy Services Corporation Operation and maintenance of Mindanao Geothermal Power Plant units 1 and 2 Philippines 100.0%<br />
• Consolidated subsidiary
<strong>Marubeni</strong> Corporation 2005 106 / 107<br />
•<strong>Marubeni</strong> Europower Ltd. Asset management, marketing and development of power projects in Europe, U.K. 100.0%<br />
Middle East and Africa<br />
•<strong>Marubeni</strong> Plant Contractor Inc. Civil work and installation of plants in the U.S. U.S.A. 100.0%<br />
•<strong>Marubeni</strong> Power Development Corporation Development and operation of overseas IPP projects Japan 100.0%<br />
•<strong>Marubeni</strong> Power International Inc. Marketing and development of power projects in Inter-American region U.S.A. 100.0%<br />
•<strong>Marubeni</strong> Power Systems Corporation Engineering, procurement and construction services for overseas power projects Japan 100.0%<br />
•<strong>Marubeni</strong> Protechs Corporation Export, transport and installation of equipment and machines, plant construction, Japan 100.0%<br />
cement, pulp and paper, nonferrous metals, sugar, plywood and steel,<br />
oil and petrochemical plants<br />
•MCP Iron Oxide, Inc. Investment in American Iron Oxide Company, a joint venture manufacturing U.S.A. 100.0%<br />
high-purity iron oxide<br />
•Mibugawa Power Company Operation and management of Mibugawa Hydro Power Station Japan 100.0%<br />
Millmerran Power Partnership IPP in Queensland, Australia Australia 30.0%<br />
•Minami-Kyushu Wind Power Corporation Sales of wind-generated electricity produced in Kagoshima, Japan Japan 80.0%<br />
•Mindanao I Geothermal Partnership Geothermal IPP in Mindanao, Philippines Philippines 100.0%<br />
•Mindanao II Geothermal Partnership Geothermal IPP in Mindanao, Philippines Philippines 100.0%<br />
Misaki Wind Power Corporation Sales of wind-generated electricity produced in Ehime, Japan Japan 49.0%<br />
PPN Power Generating Company Limited IPP in India India 26.0%<br />
•P.T. Matlamat Cakera Canggih Marketing, development, contracting and execution for power projects in Indonesia Indonesia 75.0%<br />
Sakhalin Shelf Service Company Management of equipment-supply base for Sakhalin Project Russia 25.0%<br />
San Roque Power Corporation IPP of San Roque Multipurpose Dam Project Philippines 92.5%<br />
Sarakitomanai Wind Power Corporation Sales of wind-generated electricity produced in Hokkaido, Japan Japan 49.0%<br />
SEC HoldCo, S.A. Wind power generation business operations in Spain Spain 50.0%<br />
•Sithe Ichon Cogeneration Co., Ltd. Sales of wind-generated electricity in Ichon, Korea Korea 100.0%<br />
•SmartestEnergy Ltd. Consolidation and sales of electricity and green benefits in the U.K. U.K. 100.0%<br />
•Smithfield Power Partnership IPP in South Wales, Australia Australia 100.0%<br />
•Swift Spinning Inc. Production of cotton yarns U.S.A. 100.0%<br />
Tapal Energy (Private) Ltd. Sales of diesel-generated electricity produced in Pakistan Pakistan 40.0%<br />
•Transport Systems Engineering Co., Ltd. Planning and development of transport systems Japan 100.0%<br />
Tratamiento de Aguas de Culiacan S.A. BOT business with sewage treatment facility in Mexico 50.0%<br />
de C.V. Culiacan, Mexico<br />
Uni-Mar Enerji Yatirimlari A.S. IPP in Turkey Turkey 33.3%<br />
Youngduk Wind Power Co., Ltd. Sales of wind-generated electricity in Youngduk, Korea Korea 34.0%<br />
• Yuya Wind Power Corporation Sales of wind-generated electricity produced in Yamaguchi, Japan Japan 90.0%<br />
Development & Construction<br />
company name main business nationality ownership<br />
• Benny Estate Service Co., Ltd. Property management of condominiums, buildings and commercial complexes Japan 99.3%<br />
• Fuyo Kanko Co., Ltd. Operation of Fuyo Country Golf Club Japan 74.5%<br />
Japan REIT Advisors Co., Ltd. Management of real estate investment and assets Japan 36.0%<br />
• Kohei Co., Ltd. Operation of golf courses Japan 100.0%<br />
Koshigaya Community Plaza Co., Ltd. Development and leasing of commercial complexes Japan 42.9%<br />
Lima Land, Inc . Development and sales of industrial estate in Batangas State in the Philippines Philippines 40.0%<br />
•<strong>Marubeni</strong> Real Estate Co., Ltd. Development and leasing of real estate Japan 100.0%<br />
•<strong>Marubeni</strong> Real Estate Sales Co., Ltd. Sales and marketing of real estate Japan 100.0%<br />
•<strong>Marubeni</strong> Setzbi Corporation Engineering and construction of air-conditioning systems, facilities and snow machines Japan 75.4%<br />
•P.T. Megalopolis Manunggal Development, sales and operation of industrial estate on the outskirts of Indonesia 60.0%<br />
Industrial Development Jakarta, Indonesia<br />
P.T. Mekanusa Cipta and four companies Housing development in Cibubur, Indonesia Indonesia 26.0%<br />
• Park Lane Co., Ltd. Operation of Hotel Park Lane Tsurumi and Nishikasai Japan 100.0%<br />
• Shanghai House Property Development Development of housing estates for local residents in Shanghai China 60.0%<br />
Co., Ltd.<br />
Shanghai International Realty Co., Ltd. Leasing of housing for expatriates in Shanghai China 30.0%<br />
Sin Heap Lee-<strong>Marubeni</strong> Sdn. Bhd. Development and sales of housing in suburb of Kuala Lumpur, Malaysia, and operation Malaysia 40.0%<br />
of golf course<br />
Tipness Co., Ltd . Operation of sports club and facilities Japan 28.6%<br />
• Tsunagu Network Communications, Inc. Internet service provider for condominiums Japan 60.0%<br />
• Consolidated subsidiary
Major Subsidiaries and Affiliates<br />
Finance & Logistics Business<br />
company name main business nationality ownership<br />
Avanti Staff Corporation Temporary staff placement, recruitment services, outsourcing and training services Japan 42.5%<br />
Bauan International Port, Inc. Port and harbor operations Philippines 20.0%<br />
Eastern Sea Laem Chabang Terminal Container terminal operation in Thailand Thailand 30.0%<br />
Co., Ltd.<br />
GCI Capital Co., Ltd. Investment advisory house, provision of foreign exchange margin trade Japan 19.4%<br />
•iSigma Capital Corporation Investment fund management company Japan 100.0%<br />
•Liaison Planning Inc. Advertisement planning and production; production of published material; exhibition and Japan 100.0%<br />
event planning<br />
Lima Logistics Corporation Warehousing and logistics operations Philippines 29.0%<br />
• Logipartners Inc. Management and operation of various logistics centers, distribution and related Japan 100.0%<br />
consulting services<br />
•Marnix Corporation Insurance brokerage, risk consulting Japan 100.0%<br />
•Marnix Europe Ltd. Insurance brokerage U.K. 100.0%<br />
•<strong>Marubeni</strong> Capital America Corporation Investment in pre-IPO stock funds and hedge funds U.S.A. 100.0%<br />
•<strong>Marubeni</strong> Document Systems Inc. Preparation of shipping documentation Japan 100.0%<br />
•<strong>Marubeni</strong> International Finance p.l.c. General finance operations U.K. 100.0%<br />
•<strong>Marubeni</strong> Logistics Corporation Warehousing and logistics services Japan 100.0%<br />
•<strong>Marubeni</strong> Safenet Co., Ltd. Insurance agency Japan 100.0%<br />
•<strong>Marubeni</strong> Transport Service Corporation Logistics services U.S.A. 100.0%<br />
MG Leasing Corporation General leasing Japan 25.0%<br />
•New Marble Insurance Company Pte. Ltd. Marine cargo reinsurance company for <strong>Marubeni</strong> group companies Singapore 100.0%<br />
Shanghai Waihong International Warehousing and logistics services China 25.0%<br />
Logistics Co., Ltd.<br />
Thai Logistics Service Co., Ltd. Export and domestic logistics operations in Thailand Thailand 45.0%<br />
Iron & Steel Strategies and Coordination Dept.<br />
company name main business nationality ownership<br />
<strong>Marubeni</strong> Construction Material Lease Co., Ltd. Leasing and sales of temporary construction materials Japan 35.2%<br />
<strong>Marubeni</strong>-Itochu Steel Inc. Manufacture, processing, import, export and sales of steel products Japan 50.0%<br />
Thai Cold Rolled Steel Sheet Public Co., Ltd. Manufacture of cold-rolled steel sheet Thailand 37.6%<br />
Business Incubation Dept.<br />
company name main business nationality ownership<br />
•Given Imaging KK Sales company in Japan for capsule endoscopes Japan 34.0%<br />
Others<br />
company name main business nationality ownership<br />
• Carlisle Leasing International, LLC Containers for sea transport U.S.A. 100.0%<br />
•Colombia Grain, Inc. Grain export/local terminal U.S.A. 100.0%<br />
• FAZIX Development of programs for analysis of protein structure and function U.S.A. 100.0%<br />
•MAC TRAILER LEASING LLC Lease of refrigeration and freezer trailers for overland transport U.S.A. 100.0%<br />
•<strong>Marubeni</strong> Finance Corporation Loan and zero balance transactions for the <strong>Marubeni</strong> Group Japan 100.0%<br />
•<strong>Marubeni</strong> Finance Holland B.V. General finance operations and group finance Netherland s 100.0%<br />
•<strong>Marubeni</strong> Management Resources Management services and consulting Japan 100.0%<br />
Corporation<br />
• MARUBENI SERVICE CORPORATION Maintenance services for buildings and product sales Japan 100.0%<br />
•MARICS CO., LTD. Credit management-related consulting and services Japan 100.0%<br />
Shanghai Baihong Trading Co., Ltd. Wholesaling of domestic and imported commodities, export of domestic products China 49.0%<br />
• Consolidated subsidiary<br />
(As of July 1, 2005)
Directors, Corporate Auditors and Corporate Vice Presidents<br />
MEMBERS OF THE BOARD<br />
Chairman<br />
Tohru Tsuji<br />
President and CEO<br />
Nobuo Katsumata<br />
Executive Deputy President<br />
Shigeki Kuwahara<br />
Executive Corporate Officer, Regional Strategy &<br />
Coordination Dept., and Research Institute;<br />
Advisor to the President for Plant, Power &<br />
Infrastructure Projects Div., and Iron & Steel<br />
Strategies and Coordination Dept.<br />
Corporate Executive Vice Presidents<br />
Akira Matsuda<br />
Executive Corporate Officer, Corporate<br />
Communications Dept., Corporate Planning &<br />
Coordination Dept., and Legal Dept.<br />
Makoto Isogai<br />
Advisor to the President for Forest Products &<br />
General Merchandise Div., Chemicals Div., and<br />
Development & Construction Div.<br />
Kazuo Ogawa<br />
Advisor to the President for Energy Div., Metals<br />
& Mineral Resources Div., Finance & Logistics<br />
Business Div. and Business Incubation Dept.<br />
Corporate Senior Vice Presidents<br />
Tomoyuki Nakayama<br />
Advisor to the President for Agri-Marine Products<br />
Div., and Textile Div.<br />
Teruo Asada<br />
Executive Corporate Officer, General Affairs<br />
Dept., Corporate Accounting Dept. and Finance<br />
Dept.<br />
Michio Kuwahara<br />
Advisor to the President for Transportation<br />
Machinery Div., and Industrial Machinery &<br />
Information Business Div.<br />
Masaru Funai<br />
CIO; Executive Corporate Officer, Human<br />
Resources Dept., Information Strategy Dept., and<br />
Risk Management Dept.<br />
Members of the Board<br />
Masao Fujii<br />
Takaji Kunimatsu<br />
CORPORATE AUDITORS<br />
Yuji Kato<br />
Susumu Watanabe<br />
Hiroaki Shinoda<br />
Kazuto Baba<br />
CORPORATE VICE PRESIDENTS<br />
Corporate Executive Vice President<br />
Kazuhiko Sakamoto<br />
General Manager for the Americas; President and<br />
CEO, <strong>Marubeni</strong> America Corporation<br />
Corporate Senior Vice Presidents<br />
Tadatsugu Nakajima<br />
Chief Operating Officer, Metals & Mineral<br />
Resources Div.<br />
Ko Mori<br />
Chief Operating Officer, Chemicals Div.<br />
Hitoshi Sakamoto<br />
General Manager for Europe & Africa; Managing<br />
Director and CEO, <strong>Marubeni</strong> Europe P.L.C.<br />
Fumihiko Wada<br />
Senior Corporate Officer, Regional Strategy &<br />
Coordination Dept.<br />
Makoto Itoh<br />
General Manager for ASEAN<br />
Mamoru Sekiyama<br />
Chief Operating Officer, Plant, Power &<br />
Infrastructure Projects Div.<br />
Koichi Mochizuki<br />
Chief Operating Officer, Energy Div.<br />
Toru Nishimi<br />
Chief Operating Officer, Finance & Logistics<br />
Business Div.; Executive Corporate Officer, Iron<br />
& Steel Strategies and Coordination Dept., and<br />
Business Incubation Dept.<br />
<strong>Marubeni</strong> Corporation 2005 108 / 109<br />
Corporate Vice Presidents<br />
Tadao Manabe<br />
General Manager for China; President, <strong>Marubeni</strong><br />
China Co., Ltd.<br />
Hiroshi Koyabu<br />
Chief Operating Officer, Textile Div.<br />
Tetsuro Sakamoto<br />
Chief Operating Officer, Agri-Marine Products Div.<br />
Norihiro Shimizu<br />
Chief Operating Officer, Development &<br />
Construction Div.<br />
Masanori Sasaki<br />
General Manager, Audit Dept.<br />
Satoshi Adachi<br />
Executive Corporate Officer for Kansai, Senior<br />
Operating Officer, Textile Div.<br />
Yoshinori Kusagaya<br />
Chief Operating Officer, Industrial Machinery &<br />
Information Business Div.<br />
Michihiko Ota<br />
Chief Operating Officer, Transportation<br />
Machinery Div.<br />
Fumiya Kokubu<br />
General Manager, Nagoya Branch<br />
Hideyuki Yasue<br />
General Manager, Legal Dept.<br />
Toshinori Umezawa<br />
Chief Operating Officer, Forest Products &<br />
General Merchandise Div.<br />
(As of June 24, 2005)
FOUNDED<br />
1858<br />
INCORPORATED<br />
December 1, 1949<br />
PAID-IN CAPITAL<br />
¥231,789,842,190<br />
NUMBER OF SHAREHOLDERS<br />
132,333<br />
Management Policies at <strong>Marubeni</strong><br />
COMPANY DOCTRINE<br />
Taking up the spirits of “Fairness, Innovation, Harmony,” the <strong>Marubeni</strong> Group aims to proudly<br />
contribute to the economy and society though fair and upright corporate activities.<br />
MANAGEMENT POLICY<br />
<strong>Marubeni</strong> aims to be a resilient Group possessing the No. 1 Portfolio Unit in each industry.<br />
Goals<br />
• Attain a solid financial structure<br />
• Achieve net income of at least ¥60 billion in the fiscal year ending March 31, 2006<br />
Corporate Data<br />
NUMBER OF SHARES ISSUED AND<br />
OUTSTANDING<br />
1,569,521,081<br />
NUMBER OF EMPLOYEES<br />
3,586 (plus 1,658 overseas employees)<br />
NUMBER OF DOMESTIC OFFICES*<br />
14<br />
NUMBER OF OVERSEAS BRANCHES & OFFICES AND<br />
OVERSEAS CORPORATE SUBSIDIARIES*<br />
48 overseas branches & offices and 27 overseas corporate<br />
subsidiaries with 76 offices for a total of 124 offices<br />
in 74 countries<br />
MAJOR STOCKHOLDERS<br />
Japan <strong>Trust</strong>ee Services Bank, Ltd. (<strong>Trust</strong> Account)<br />
The Master <strong>Trust</strong> Bank of Japan, Ltd. (<strong>Trust</strong> Account)<br />
The Chase Manhattan Bank N.A., London<br />
Sompo Japan Insurance Inc.<br />
Tokio Marine & Nichido Fire Insurance Co., Ltd.<br />
Mizuho Corporate Bank, Ltd.<br />
Meiji Yasuda Life Insurance Company<br />
Nippon Life Insurance Company<br />
State Street Bank and <strong>Trust</strong> Company 505103<br />
Morgan Stanley and Company Inc.<br />
STOCK LISTINGS<br />
Sapporo, Tokyo, Nagoya, Osaka, Fukuoka<br />
TRANSFER AGENT OF COMMON STOCK<br />
Mizuho <strong>Trust</strong> & Banking Co., Ltd.<br />
HOME PAGE ADDRESS<br />
http://www.marubeni.com<br />
<strong>Marubeni</strong> Corporation 2005<br />
BUSINESS STRATEGY<br />
<strong>Marubeni</strong> practices sound and strong operations through implementation of a diversified business model strategy.<br />
Each of our models is based upon risk-return and cash flow management.<br />
FOR FURTHER INFORMATION, PLEASE CONTACT:<br />
110<br />
Corporate Communications Dept., <strong>Marubeni</strong> Corporation,<br />
4-2, Ohtemachi 1-chome, Chiyoda-ku, Tokyo 100-8088, Japan<br />
Tel: 81-3-3282-2111 Fax: 81-3-3282-4241<br />
E-mail: TOKB191@marubenicorp.com<br />
(As of March 31, 2005, except * as of April 1, 2005)
http://www.marubeni.com<br />
This report was produced from recycled paper and soy ink.<br />
Printed in Japan
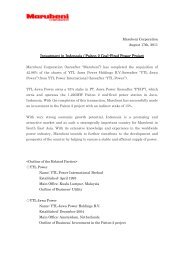
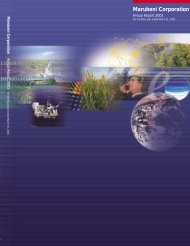
![[Chapter 2] Driving Growth: Expansion Under SG-12 - Marubeni](https://img.yumpu.com/4161147/1/190x248/chapter-2-driving-growth-expansion-under-sg-12-marubeni.jpg?quality=85)
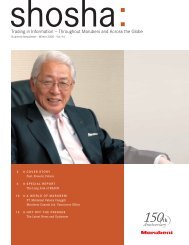
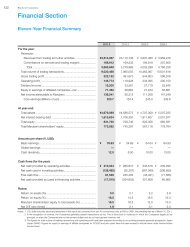
![[Chapter 4] Delivering Growth - Marubeni](https://img.yumpu.com/3464783/1/190x248/chapter-4-delivering-growth-marubeni.jpg?quality=85)