Annual Report and Accounts - Hemscott IR
Annual Report and Accounts - Hemscott IR
Annual Report and Accounts - Hemscott IR

Create successful ePaper yourself
Turn your PDF publications into a flip-book with our unique Google optimized e-Paper software.
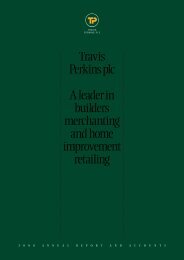
TRAVIS PERKINS PLC<br />
Travis Perkins<br />
The largest supplier of building materials in the UK<br />
A n n u a l R e p o r t a n d A c c o u n t s 2 0 1 2
TRAVIS PERKINS PLC<br />
General<br />
Merchanting<br />
Division<br />
Consumer<br />
Division<br />
Tile Giant<br />
Specialist<br />
Merchanting<br />
Division<br />
Plumbing<br />
<strong>and</strong> Heating<br />
Division<br />
Travis Perkins<br />
Midl<strong>and</strong>s<br />
<strong>and</strong> North West<br />
Toolstation<br />
Wickes<br />
Benchmarx<br />
CCF<br />
Birchwood Price Tools<br />
BSS<br />
Travis Perkins<br />
Northern<br />
Keyline<br />
City Heating Spares<br />
City Plumbing<br />
Travis Perkins<br />
South East<br />
Travis Perkins<br />
South West <strong>and</strong> Wales<br />
Connections<br />
DHS<br />
F&P Wholesale<br />
PTS<br />
This document is important <strong>and</strong> requires your immediate attention. If you are in any doubt as to what action you should take, you are recommended to seek<br />
your own financial advice from your stockbroker or other independent adviser authorised under the Financial Services <strong>and</strong> Markets Act 2000. If you have sold or<br />
transferred all of your shares in Travis Perkins plc, please forward this document, together with the accompanying documents, as soon as possible either to the<br />
purchaser or transferee or to the person who arranged the sale or transfer so they can pass these documents to the person who now holds the shares.
T R A V I S P E R K I N S A N N U A L R E P O R T A N D A C C O U N T S 2 0 1 2<br />
Contents<br />
Overview<br />
2<br />
Financial Highlights<br />
2<br />
Operating Highlights<br />
3<br />
Financial Summary<br />
5<br />
Key Performance<br />
Indicators<br />
6<br />
Our Group Mission,<br />
Vision <strong>and</strong> Values<br />
7<br />
Who we are<br />
12<br />
Our Investment Case<br />
14<br />
Our Strategy<br />
15<br />
Delivering our Strategy<br />
17<br />
Our Business Model<br />
<strong>Report</strong>s<br />
18<br />
Chairman’s Statement<br />
20<br />
Chief Executive’s<br />
Review of the Year<br />
30<br />
Deputy Chief Executive’s<br />
Review of the Year<br />
38<br />
Finance Director’s<br />
Review of the Year<br />
44<br />
Statement of Principal<br />
Risks <strong>and</strong> Uncertainties<br />
46<br />
Environmental <strong>Report</strong><br />
50<br />
Health & Safety <strong>Report</strong><br />
Governance<br />
54<br />
Directors<br />
56<br />
Corporate<br />
Responsibility Statement<br />
56<br />
Committees <strong>and</strong><br />
Professional Advisers<br />
57<br />
Corporate Governance<br />
61<br />
Audit Committee <strong>Report</strong><br />
64<br />
Directors’<br />
Remuneration <strong>Report</strong><br />
75<br />
Nominations<br />
Committee <strong>Report</strong><br />
76<br />
Directors’ <strong>Report</strong><br />
80<br />
Statement of<br />
Directors’ Responsibilities<br />
81<br />
Independent<br />
Auditor’s <strong>Report</strong><br />
Financial<br />
Statements<br />
82<br />
Income Statements<br />
83<br />
Statements of<br />
Comprehensive Income<br />
84<br />
Balance Sheets<br />
86<br />
Consolidated Statement<br />
of Changes in Equity<br />
87<br />
Statement of<br />
Changes in Equity<br />
88<br />
Cash Flow Statements<br />
89<br />
Notes to the<br />
Financial Statements<br />
130<br />
Five Year Record<br />
Shareholder<br />
Information<br />
132<br />
Notice of <strong>Annual</strong><br />
General Meeting<br />
134<br />
Notes to Notice of<br />
<strong>Annual</strong> General Meeting<br />
136<br />
Directions to <strong>Annual</strong><br />
General Meeting<br />
137<br />
Other Shareholder<br />
Information<br />
Forward looking statements<br />
The review of the businesses contained in the annual report <strong>and</strong> accounts contains forward looking statements with respect to the financial<br />
condition, results, operations <strong>and</strong> business of the Travis Perkins plc group. These statements <strong>and</strong> forecasts include risk <strong>and</strong> uncertainty because<br />
they relate to events <strong>and</strong> depend on circumstances that occur in the future. There are a number of factors that could cause actual results or<br />
developments to differ materially from those expressed or implied by the forward statements.<br />
1
Financial<br />
Highlights<br />
Operating<br />
Highlights<br />
Group revenue up 1.4%<br />
at £4,845m, down 1.4%<br />
on a like-for-like basis<br />
Adjusted operating<br />
profit, up 4.3% to £327m,<br />
adjusted PBT up 1.1% to<br />
£300m, <strong>and</strong> adjusted EPS<br />
up 2.1% to 95.1p<br />
Sustained adjusted<br />
operating margin at 6.7%<br />
<strong>Report</strong>ed PBT after<br />
exceptional items up<br />
16.2% to £313m<br />
Free cash flow<br />
generated of £242m<br />
Underlying £155m debt<br />
reduction, net debt down<br />
to £452m, <strong>and</strong> financing<br />
ratios further improved<br />
Full year dividend of 25p<br />
per share up 25%,<br />
with adjusted dividend<br />
cover now 3.8 times<br />
Increased BSS synergy<br />
target achieved <strong>and</strong><br />
integration programme<br />
near completion<br />
Toolstation network<br />
expansion to 123<br />
branches <strong>and</strong> Toolstation<br />
Europe trial launched<br />
Gross margin<br />
before synergies<br />
increased by 0.2%<br />
Tight cost control, like-forlike<br />
overheads down 2.3%<br />
Solfex systems acquired<br />
on 30 January 2013<br />
for initial consideration<br />
of £8m<br />
2
T R A V I S P E R K I N S A N N U A L R E P O R T A N D A C C O U N T S 2 0 1 2<br />
Financial Summary<br />
2012 2011<br />
£m % £m<br />
OVERVIEW<br />
Revenue 4,844.9 1.4 4,779.1<br />
Adjusted: *<br />
Note<br />
Operating profit 5a 326.6 4.3 313.2<br />
Profit before taxation 5b 299.9 1.1 296.7<br />
Profit after taxation 5b 226.8 3.6 219.0<br />
Adjusted earnings per ordinary share (pence) 11b 95.1 2.1 93.1<br />
Statutory:<br />
Operating profit 300.5 3.4 290.5<br />
Profit before taxation 313.3 16.2 269.6<br />
Profit after taxation 259.6 22.2 212.4<br />
Basic earnings per ordinary share (pence) 108.9 20.6 90.3<br />
Total dividend declared<br />
per ordinary share (pence) 12 25.0p 25.0 20.0p<br />
* Throughout this <strong>Annual</strong> <strong>Report</strong> the term ‘adjusted’ has been used to signify that the effects of the exceptional items, amortisation of intangible assets<br />
<strong>and</strong> the associated tax impacts have been excluded from the disclosure being made.<br />
3
Gareth Hurst, Driver<br />
<strong>and</strong> Trevor Horwood,<br />
Branch Supervisor<br />
at Travis Perkins<br />
4<br />
Managed Services,<br />
Aylesbury
T R A V I S P E R K I N S A N N U A L R E P O R T A N D A C C O U N T S 2 0 1 2<br />
Key Performance Indicators<br />
Revenue<br />
(£m)<br />
Like-for-like<br />
sales growth (%)<br />
Adjusted profit<br />
before taxation (£m)<br />
Adjusted earnings<br />
per share (pence)<br />
2011<br />
2012<br />
2010<br />
2011<br />
2011<br />
2012<br />
2010<br />
2011<br />
2012<br />
OVERVIEW<br />
2010<br />
2010<br />
2012<br />
Adjusted pre-tax<br />
return on capital (%)<br />
Free cash flow (£m)<br />
Net debt to<br />
EBITDA<br />
Employee<br />
retention (%)<br />
2010<br />
2011<br />
2012<br />
2010<br />
2011<br />
2010<br />
2010<br />
2011<br />
2012<br />
2012<br />
2011<br />
2012<br />
5
Our Group Mission, Vision <strong>and</strong> Values<br />
Our Group Mission<br />
‘Continue to deliver better<br />
returns by... putting in place <strong>and</strong><br />
growing the best businesses, with<br />
outst<strong>and</strong>ing people <strong>and</strong> operations,<br />
providing comprehensive building<br />
material solutions, to everyone<br />
creating, maintaining, repairing or<br />
improving the built environment,…<br />
helping to build Britain’.<br />
Our Group Vision<br />
To ensure that anyone in Britain<br />
who wants to access any kind of<br />
building materials through any<br />
form of supply channel will have a<br />
Travis Perkins group operation as<br />
their first or first alternative choice.<br />
Our Group Values<br />
At Travis Perkins, we:<br />
Know our customers – we underst<strong>and</strong> their needs, beat their expectations,<br />
treat them with respect, <strong>and</strong> know our major customers personally.<br />
Talk <strong>and</strong> listen – we say what we mean clearly <strong>and</strong> honestly, we listen<br />
carefully; we respond objectively, we explain our decisions.<br />
Are with you, not against you – we seek mutual benefits with all stakeholders;<br />
we think about the impact of our actions; we search for similarities.<br />
Know how to do our jobs – not just today, but for the next job; we equip<br />
ourselves with the skills needed to perform <strong>and</strong> be confident we can perform.<br />
Like to deliver – we enjoy being the best; we know exactly what each of us<br />
is expected to achieve; we focus on getting results, simply.<br />
Work together – we actively work with each other; when something goes<br />
wrong, the first thing we will do is fix the problem; not look for someone<br />
to blame.<br />
Always try to get better – we constructively challenge how we work; we<br />
look for fresh ideas that are different; we only have rules where they are<br />
necessary because we use our common sense.<br />
Are proud to be here – this is a great company; everyone working with us<br />
is welcome; we make work enjoyable for everyone.<br />
6
T R A V I S P E R K I N S A N N U A L R E P O R T A N D A C C O U N T S 2 0 1 2<br />
Who we are<br />
TRAVIS<br />
PERKINS<br />
PLC<br />
OVERVIEW<br />
Norman Bell<br />
Group Development<br />
Director<br />
Carol Kavanagh<br />
Group Human<br />
Resources Director<br />
Travis Perkins plc, is the UK’s<br />
largest supplier to the building <strong>and</strong><br />
construction market, one of the most<br />
economically significant activities<br />
in the UK.<br />
The present day Company was<br />
formed in 1988 out of a merger<br />
between Travis <strong>and</strong> Arnold plc, a<br />
company with strong Midl<strong>and</strong>s<br />
<strong>and</strong> Northern based business, <strong>and</strong><br />
S<strong>and</strong>ell Perkins plc, a company with<br />
an equivalent strength in the South<br />
of Engl<strong>and</strong>.<br />
The origins of S<strong>and</strong>ell Perkins<br />
can be traced back over 200 years<br />
to 1797 when a carpentry company<br />
was first established in London;<br />
Travis <strong>and</strong> Arnold was initially<br />
formed as a partnership in 1899.<br />
During the early to mid 20th<br />
century both businesses exp<strong>and</strong>ed<br />
before eventually becoming listed<br />
public companies, Travis <strong>and</strong><br />
Arnold was the first to the market<br />
in 1964, followed 22 years later by<br />
S<strong>and</strong>ell Perkins.<br />
Martin Meech<br />
Group Property<br />
Director<br />
Andrew Pike<br />
Company Secretary<br />
<strong>and</strong> General Counsel<br />
Robin Proctor<br />
Supply Chain<br />
Director<br />
Jean-Jacques<br />
Van Oosten<br />
Chief Informatioin<br />
Officer<br />
Group reorganisation<br />
On 1 January 2012 we reorganised the business into four divisions, General<br />
Merchanting, Specialist Merchanting, Consumer <strong>and</strong> Plumbing & Heating.<br />
It is on the new divisional structure described in this section that we have<br />
prepared the <strong>Annual</strong> <strong>Report</strong>.<br />
7
GENERAL<br />
MERCHANTING<br />
DIVISION<br />
Kevin Appleton<br />
Divisional Chairman<br />
Kieran Griffin<br />
MD Midl<strong>and</strong>s <strong>and</strong><br />
North West<br />
Mark Nottingham<br />
MD South West<br />
<strong>and</strong> Wales<br />
Phil Gransden<br />
MD South East<br />
David Kelman<br />
MD North<br />
Our general merchanting division,<br />
trades nationally through the Travis<br />
Perkins br<strong>and</strong> <strong>and</strong> comprises four<br />
geographically organised individual<br />
businesses. It has 636 branches,<br />
supplying building materials to<br />
professional building companies,<br />
contractors <strong>and</strong> tradesmen<br />
throughout Great Britain.<br />
Kevin Appleton, who joined the<br />
Group in 2011, leads the General<br />
Merchanting business in his role as<br />
Divisional Chairman. The Managing<br />
Directors of the four businesses<br />
are Kieran Griffin (Travis Perkins<br />
Midl<strong>and</strong>s <strong>and</strong> the North West), Phil<br />
Gransden (Travis Perkins South<br />
East), David Kelman (Travis Perkins<br />
North) <strong>and</strong> Mark Nottingham<br />
(Travis Perkins South West <strong>and</strong><br />
Wales). The customers of the four<br />
general merchanting businesses are<br />
primarily professional tradesmen,<br />
ranging from sole traders to<br />
national housebuilders, whose key<br />
requirements are product range <strong>and</strong><br />
availability, competitive pricing <strong>and</strong><br />
customer service.<br />
The strategy of the general<br />
merchanting business aims to<br />
increase market share through<br />
implementation of our best practice<br />
programme, ongoing branch<br />
network expansion, entry into new<br />
market segments <strong>and</strong> exploitation<br />
of multi channel opportunities.<br />
The Best Practice programme is<br />
designed to enhance our overall<br />
service to trade customers <strong>and</strong><br />
covers all of their key requirements:<br />
even though all four general<br />
merchanting businesses are already<br />
operating to high st<strong>and</strong>ards in<br />
these areas they have stretching<br />
targets in place to deliver further<br />
improvements.<br />
Network expansion will be<br />
concentrated on identifying prime<br />
locations through brownfield<br />
openings <strong>and</strong> small acquisitions.<br />
In addition, store projects <strong>and</strong><br />
framework agreements will continue<br />
to be exp<strong>and</strong>ed with Local Authorities<br />
<strong>and</strong> Housing Associations.<br />
8
T R A V I S P E R K I N S A N N U A L R E P O R T A N D A C C O U N T S 2 0 1 2<br />
SPECIALIST<br />
MERCHANTING<br />
DIVISION<br />
OVERVIEW<br />
Arthur Davidson<br />
Divisional Chairman<br />
Chris Larkin<br />
MD Benchmarx<br />
Andrew Harrison<br />
MD Keyline<br />
Howard Luft<br />
MD CCF<br />
The specialist merchanting business<br />
consists of three separate businesses<br />
trading from 203 branches under<br />
the following br<strong>and</strong>s; Keyline, CCF<br />
<strong>and</strong> Benchmarx. We also have an<br />
interest in an associate company,<br />
Rinus Roofing Supplies which has<br />
12 branches. Arthur Davidson is<br />
the Divisional Chairman. He has<br />
worked in merchanting for over<br />
thirty years having joined Keyline<br />
prior to its acquisition by the Travis<br />
Perkins Group.<br />
Andrew Harrison, the Managing<br />
Director of Keyline has been with<br />
the Group since 1989. Keyline is<br />
a specialist merchant supplying<br />
heavy building materials <strong>and</strong><br />
civils <strong>and</strong> drainage solutions to the<br />
construction industry throughout<br />
the UK. Keyline is known for its<br />
knowledgeable staff <strong>and</strong> excellent<br />
delivery service.<br />
CCF is a leading supplier of<br />
interior building products to the<br />
construction industry. It operates<br />
throughout the UK, offering a<br />
one-stop-shop to its customers from<br />
its nationwide branch network. CCF’s<br />
Managing Director is Howard Luft,<br />
formerly managing director of Buck<br />
<strong>and</strong> Hickman, which was sold by the<br />
Group in September 2011.<br />
In 2006 Benchmarx became the<br />
first group br<strong>and</strong> to be created as<br />
a completely new business within<br />
a market adjacent to the markets<br />
already served by the Group. The<br />
business is a leading supplier of<br />
kitchen <strong>and</strong> joinery products to the<br />
trade through its competitive pricing,<br />
quality products <strong>and</strong> knowledgeable<br />
staff. Benchmarx is led by Chris<br />
Larkin, formerly a Regional Director<br />
within Travis Perkins South East,<br />
who became Managing Director in<br />
July 2009.<br />
Rinus Roofing Supplies, an<br />
associate company in which the<br />
Group holds a 25% interest, is<br />
a supplier of roofing materials.<br />
The Group has entered into a<br />
development agreement with Rinus<br />
aimed at creating a new competitor<br />
in this adjacent market. Although<br />
the Group sells many of the products<br />
available through Rinus, specialist<br />
roofing contractors prefer using<br />
specialist distributors in this market.<br />
9
CONSUMER<br />
DIVISION<br />
Jeremy Bird<br />
Divisional Chairman<br />
Simon King<br />
MD Wickes<br />
Neil Carroll<br />
MD Toolstation<br />
Andy Morrison<br />
MD Tile Giant<br />
The consumer division comprises<br />
three businesses; Wickes, a national<br />
chain of DIY retail outlets, Tile<br />
Giant a ceramic tile merchant<br />
acquired in 2007 <strong>and</strong> Toolstation a<br />
multi-channel operator, which was<br />
acquired by the Group on 3 January<br />
2012. We have 458 branches in the<br />
consumer division.<br />
The Chairman of the Consumer<br />
Division is Jeremy Bird who joined<br />
Wickes 19 years ago <strong>and</strong> has held<br />
a number of senior positions in the<br />
Group including that of Managing<br />
Director of Wickes. The present<br />
managing director of Wickes is<br />
Simon King who joined the Company<br />
at the end of 2011 <strong>and</strong> has fulfilled<br />
various external retail roles including<br />
chief operating officer of Asda.<br />
Wickes, which opened its first<br />
store in the UK in 1972 at Whitefield<br />
in Manchester, was acquired by<br />
Travis Perkins in 2005 <strong>and</strong> the<br />
Company now operates from 224<br />
stores nationwide.<br />
Wickes stores are designed to<br />
appeal to tradesmen, who undertake<br />
general repairs, maintenance <strong>and</strong><br />
improvement projects for households<br />
<strong>and</strong> small businesses, <strong>and</strong> to serious<br />
DIY customers, who undertake<br />
more complete DIY projects. These<br />
customers are more dem<strong>and</strong>ing in<br />
terms of service, quality <strong>and</strong> price.<br />
The business meets its customers’<br />
expectations by offering a focussed<br />
range of high quality, primarily own<br />
br<strong>and</strong>, competitively priced home<br />
improvement products, such as<br />
timber, building materials, tools <strong>and</strong><br />
decorative materials. In addition,<br />
Wickes stores offer a range of<br />
kitchens <strong>and</strong> bathrooms, which are<br />
sold through both in-store showrooms<br />
<strong>and</strong> 11 st<strong>and</strong>alone specialist kitchen<br />
<strong>and</strong> bathroom stores.<br />
In 2007, Travis Perkins acquired<br />
its seventh br<strong>and</strong>, Tile Giant. The<br />
br<strong>and</strong> is now trading from 106<br />
stores. Under the leadership of<br />
managing director Andy Morrison,<br />
the br<strong>and</strong> offers a strong pipeline for<br />
further expansion.<br />
The Group first took a minority<br />
investment in Toolstation, a direct<br />
retailer of lightside products, during<br />
2008 before acquiring the remaining<br />
shares in 2012. Since then, led by<br />
its founder Mark Goddard-Watts,<br />
with support from the Group, this<br />
multi-channel retailer of lightside<br />
products has rapidly exp<strong>and</strong>ed<br />
its trade counter network <strong>and</strong><br />
now occupies 123 trade counters<br />
throughout Great Britain. It also<br />
operates a very successful catalogue<br />
based internet business.<br />
10
T R A V I S P E R K I N S A N N U A L R E P O R T A N D A C C O U N T S 2 0 1 2<br />
Direct Heating Spares<br />
PLUMBING<br />
AND HEATING<br />
DIVISION<br />
OVERVIEW<br />
Paul Tallentire<br />
Divisional Chairman<br />
Frank Elkins<br />
MD BSS Industrial<br />
Paul Nieduszynski<br />
MD Birchwood<br />
Price Tools<br />
Ian Church<br />
MD PTS Group<br />
John Frost<br />
MD City Plumbing<br />
The new plumbing <strong>and</strong> heating<br />
division was established on 1<br />
January 2012 under the leadership<br />
of its Chairman, Paul Tallentire.<br />
The division consists of the original<br />
plumbing business of the Travis<br />
Perkins group, City Plumbing<br />
Supplies together with the<br />
businesses of The BSS Group, which<br />
were acquired on 14 December 2010.<br />
It is now the leading plumbing <strong>and</strong><br />
heating business in the UK operating<br />
from 587 locations.<br />
City Plumbing Supplies, run by<br />
managing director John Frost, is a<br />
major nationwide plumbing <strong>and</strong><br />
heating merchant serving both the<br />
contract market <strong>and</strong> the general<br />
plumbing <strong>and</strong> heating market from<br />
189 branches. The business offers<br />
high quality products <strong>and</strong> expert<br />
service to the trade. In 2010, a new<br />
operation was formed, City Heating<br />
Spares, the spare parts division of<br />
City Plumbing.<br />
The ex-BSS businesses are<br />
leading distributors of plumbing<br />
<strong>and</strong> heating products to specialist<br />
trades. Their principal activities<br />
are the distribution <strong>and</strong> sale of<br />
heating, ventilation <strong>and</strong> plumbing<br />
products, tools <strong>and</strong> industrial<br />
supplies to, amongst others,<br />
industrial contractors, domestic<br />
plumbers, independent merchants<br />
<strong>and</strong> industrial end users through<br />
a network of 397 branches. 395<br />
branches are located in the United<br />
Kingdom <strong>and</strong> two in the Republic<br />
of Irel<strong>and</strong>.<br />
PTS operates from 314 branches<br />
<strong>and</strong> supplies a wide range of<br />
customers from national contractors<br />
to sole trading plumbers <strong>and</strong> heating<br />
engineers.<br />
The industrial, commercial,<br />
process, construction <strong>and</strong> warehouse<br />
markets are serviced through a<br />
network of sixty two branches of BSS<br />
Industrial in the UK <strong>and</strong> Irel<strong>and</strong>.<br />
Birchwood Price Tools is a<br />
wholesaler of power tools <strong>and</strong><br />
accessories, h<strong>and</strong> tools, safety wear<br />
<strong>and</strong> general consumables <strong>and</strong> F&P<br />
Wholesale supply heating, plumbing<br />
<strong>and</strong> sanitaryware to smaller<br />
merchanting businesses.<br />
11
Our Investment Case<br />
Market prospects are good for the medium term…<br />
Prospects for growth in our markets in the medium term<br />
are strong. Construction activity is at unsustainably<br />
low levels when compared to long run trends. It is clear<br />
that there is a significant requirement for more housing<br />
across the UK to address household composition <strong>and</strong><br />
for significant upgrading <strong>and</strong> repair of infrastructure,<br />
domestic <strong>and</strong> public buildings. Climate change concerns<br />
also indicate the value of the building materials market<br />
will increase significantly.<br />
UK market leadership allows economies of scale…<br />
Travis Perkins is the largest supplier of building<br />
materials in the UK, a position it has achieved through<br />
major acquisitions, the ‘roll up’ of smaller operators<br />
<strong>and</strong> the organic development of new branches. Our size<br />
allows us to benefit from economies of scale through<br />
both our centralised back office, business services <strong>and</strong><br />
sourcing model. The Group has a history of producing<br />
like-for-like <strong>and</strong> total market share gains in competitive<br />
trade <strong>and</strong> consumer markets. It has achieved this<br />
by focussing its operating management on offering<br />
a compelling customer proposition in the market<br />
segments in which it trades.<br />
On-going expansion…<br />
There is still significant scope to grow the existing<br />
branch network by extending our multi-channel <strong>and</strong><br />
geographic coverage further in the UK. Our estimates<br />
suggest that sufficient opportunities exist for us to<br />
extend our operations to around 3,000 locations, backed<br />
up by an increasingly sophisticated national supply<br />
chain network. We have a significant <strong>and</strong> popular multichannel<br />
capabilities across the Group, led by Wickes<br />
<strong>and</strong> Toolstation, with sales now growing at over 25% p.a.<br />
Potential to enter new market adjacencies…<br />
There is large untapped potential in specialised building<br />
materials distribution market segments where the Group<br />
does not have a presence. The Group has successfully<br />
established itself in six specialist channels since 1999,<br />
with BSS, Toolstation <strong>and</strong> Tile Giant being the most<br />
recent examples.<br />
12
T R A V I S P E R K I N S A N N U A L R E P O R T A N D A C C O U N T S 2 0 1 2<br />
OVERVIEW<br />
Strong customer proposition <strong>and</strong> br<strong>and</strong> identity…<br />
greater focus for each business<br />
Travis Perkins trades through sixteen national br<strong>and</strong>s<br />
via a network of nearly 1,900 locations. Each br<strong>and</strong><br />
has developed an overall proposition <strong>and</strong> customer<br />
experience, which recognises the requirements of its<br />
customers, <strong>and</strong> has defined a br<strong>and</strong> essence <strong>and</strong> values<br />
by which each business will operate. This approach<br />
has improved customer loyalty <strong>and</strong> its continued<br />
deployment is key to growing both our customer<br />
base <strong>and</strong> operating margin. All of our businesses are<br />
challenged to achieve a best in class rating by customers<br />
<strong>and</strong> a best in class operating margin ahead of any<br />
comparable business,<br />
Attracting <strong>and</strong> retaining the best people at all levels…<br />
We have a high quality team, with huge experience of<br />
our industry that has consistently delivered a strong<br />
profit performance regardless of the economic climate<br />
it faces. We attract <strong>and</strong> retain the best people in our<br />
sector <strong>and</strong> operate at high levels of engagement having<br />
a culture of continuous improvement, which encourages<br />
colleagues to develop new skills that allow them to excel<br />
in their jobs.<br />
Best practice… leading operational efficiency<br />
We have a strong track record of improving our<br />
operational efficiency through the automation<br />
of systems <strong>and</strong> processes designed to increase<br />
productivity, improve availability, reduce the cost of<br />
buying <strong>and</strong> holding stock <strong>and</strong> manage our property<br />
portfolio to reduce costs <strong>and</strong> leverage value in our assets.<br />
Our objective is to ensure that each enhancement will<br />
deliver improved returns for shareholders going forward.<br />
13
Our Strategy<br />
The statements of Mission, Vision, <strong>and</strong> Values on<br />
page 6 of this annual report set out what we exist to do,<br />
the direction we aim to take the Group, <strong>and</strong> the way in<br />
which we believe we should work. The strategy we are<br />
following to achieve these aims is designed to maximise,<br />
over the long-term, shareholder returns through<br />
innovation, organic self-help initiatives <strong>and</strong> targeted<br />
expansion. It involves:<br />
• Creation, acquisition <strong>and</strong> development of businesses<br />
that seek to serve all the segments for the distribution<br />
of building materials in the UK;<br />
• Continuously improving the customer <strong>and</strong> supplier<br />
proposition in all our businesses to become the<br />
highest rated in each segment, as measured by<br />
customers, <strong>and</strong> as tested by seeking to outperform<br />
markets on a like-for-like basis;<br />
• Exploit the economies of scale this creates through<br />
the centralisation of common activities <strong>and</strong> common<br />
purchasing into low cost, highly efficient <strong>and</strong> powerful<br />
central functions;<br />
• Sustaining an organisational model that devolves<br />
authority to operating managers <strong>and</strong> allows them<br />
to compete with the most effective competitors with<br />
minimal constraints, but always maintaining very<br />
strong controls;<br />
• Operating a performance management system,<br />
closely matched to arrangements for incentives, that<br />
encourages the right economic behaviour <strong>and</strong> allows<br />
all colleagues to participate in the financial success of<br />
the Group;<br />
• Recruiting <strong>and</strong> developing people whose personal<br />
characteristics are consistent with a culture of<br />
customer sensitivity, continuous improvement <strong>and</strong> a<br />
drive for performance;<br />
• Cautiously, with a low-risk <strong>and</strong> low-capital approach<br />
that does not adversely affect profits <strong>and</strong> debt<br />
reduction, exploring the prospects for expansion in<br />
new markets.<br />
Management, at Executive Director, Executive<br />
Committee, Division <strong>and</strong> individual business levels, are<br />
held to account on both current performance <strong>and</strong> the<br />
delivery of improved capabilities on each of these aspects<br />
of strategy via a balanced scorecard. This scorecard<br />
forms part of the metrics for incentives for Executive<br />
Directors <strong>and</strong> the Executive Committee. The balance of<br />
measures is designed to ensure that management are<br />
focussed on both current performance <strong>and</strong> the long-term<br />
improvement <strong>and</strong> quality of the Group.<br />
14
T R A V I S P E R K I N S A N N U A L R E P O R T A N D A C C O U N T S 2 0 1 2<br />
Delivering our Strategy<br />
STRATEGIC<br />
DIMENSION<br />
People<br />
The table below shows how we approach the various<br />
dimensions of our strategy, how we judge progress <strong>and</strong><br />
how our strategy is integrated with our management of<br />
the principal risks faced by the Group, which are set out<br />
on pages 44 <strong>and</strong> 45.<br />
Successful execution of our strategy is dependent<br />
upon maintaining our IT capabilities, purchasing <strong>and</strong><br />
APPROACH<br />
Devolving authority to managers to allow them to compete in the<br />
market, but without weakening our control environment.<br />
Recruiting <strong>and</strong> developing people with attributes that support our core<br />
values.<br />
Operating a performance management system closely aligned to<br />
incentives.<br />
Coaching, guiding <strong>and</strong> holding people to account for their attitude as<br />
much as their performance.<br />
Meeting our corporate social responsibilities in areas such as health <strong>and</strong><br />
safety, environmental <strong>and</strong> community relations.<br />
distributing goods effectively <strong>and</strong> recruiting <strong>and</strong> retaining<br />
the best people. We operate a strong <strong>and</strong> well-resourced<br />
shared service model, which enables branches to<br />
concentrate on delivering excellent customer service,<br />
whilst allowing the central teams to concentrate on<br />
innovation <strong>and</strong> leadership across the Group.<br />
KEY PERFORMANCE<br />
INDICATORS<br />
Colleague retention.<br />
Colleague engagement.<br />
PRINCIPAL<br />
RISKS AND<br />
UNCERTAINTIES<br />
Colleague<br />
recruitment,<br />
retention <strong>and</strong><br />
succession.<br />
OVERVIEW<br />
Sales <strong>and</strong><br />
margin<br />
management<br />
Exploiting economies of scale from growth to improve our proposition,<br />
gain further market share <strong>and</strong> improve operating margins.<br />
Centralising purchasing to increase the benefits of common purchasing.<br />
Improving our supply chain capabilities.<br />
Exp<strong>and</strong>ing our global sourcing activities to support our own br<strong>and</strong><br />
proposition.<br />
Continuously improving our customer <strong>and</strong> supplier proposition.<br />
Harmonising product specifications across our businesses.<br />
Like-for-like revenue growth.<br />
Like-for-like sales outperformance.<br />
Gross margin gains from sourcing<br />
projects, less margin investment in<br />
proposition.<br />
Adjusted operating profit/margin.<br />
Competitive<br />
pressures.<br />
Information<br />
technology failure.<br />
Supplier<br />
dependency <strong>and</strong><br />
direct sourcing<br />
operational<br />
difficulties.<br />
Cost control<br />
<strong>and</strong> asset<br />
management<br />
Exploiting the economies of scale delivered by growth <strong>and</strong> centralisation<br />
to improve our operating margins.<br />
Centralising most support services.<br />
Operating a well resourced <strong>and</strong> innovative property function to improve<br />
asset turn, lower property costs <strong>and</strong> realise surplus assets.<br />
Group overheads to sales ratio.<br />
Colleague productivity ratio.<br />
Adjusted ROCE.<br />
Information<br />
technology failure.<br />
Defined benefit<br />
pension scheme<br />
funding.<br />
Expansion<br />
Using our superior financial performance to exp<strong>and</strong> our branch network<br />
so ensuring we penetrate all catchments in the UK.<br />
Extending our multi-channel capabilities.<br />
Adding additional channels or creating businesses to serve all segments<br />
of the UK building materials market where we can achieve synergies.<br />
Shareholder Value created from<br />
expansion projects (at individual<br />
site <strong>and</strong> whole business level).<br />
Information<br />
technology failure.<br />
Developing <strong>and</strong> owning trade parks <strong>and</strong> multiple br<strong>and</strong> sites.<br />
Financial<br />
Achieving market leading returns on sales <strong>and</strong> returns on capital<br />
employed.<br />
Reducing debt through cash generation.<br />
Increasing adjusted earnings per share.<br />
Optimising our dividend cover.<br />
Lease adjusted net debt to EBITDAR.<br />
Free cash flow.<br />
Adjusted ROCE.<br />
Adjusted EPS.<br />
Adjusted PBT.<br />
Adjusted Dividend cover.<br />
Market conditions.<br />
15
T R A V I S P E R K I N S A N N U A L R E P O R T A N D A C C O U N T S 2 0 1 2<br />
Our Business Model<br />
Travis Perkins is a multi-channel operator selling a wide range of building materials through four divisions to the<br />
trade <strong>and</strong> consumer primarily through a network of mainly UK branches.<br />
Source products<br />
from over<br />
10,500 suppliers<br />
Stock <strong>and</strong> then<br />
distribute goods<br />
from 1,890 branches<br />
<strong>and</strong> 24 warehouses<br />
using a fleet of over<br />
2,300 vehicles<br />
Sell goods <strong>and</strong><br />
services to over<br />
190,000 account<br />
<strong>and</strong> countless cash<br />
customers<br />
OVERVIEW<br />
Our business model is based upon:<br />
• Being the number one or number two distributor in<br />
the markets in which we operate;<br />
• Achieving growth through investing in organic<br />
initiatives <strong>and</strong> acquisitions that leverage our fixed<br />
<strong>and</strong> central costs to deliver further benefits from<br />
increasing economies of scale; An organisation<br />
structure, which devolves responsibilities to those<br />
colleagues close to our customers whilst providing<br />
the benefits of shared central services;<br />
• Thorough performance management monitoring<br />
systems <strong>and</strong> processes;<br />
• A technology approach, where retaining control<br />
by writing our own systems delivers lower cost,<br />
more flexibility <strong>and</strong> higher matched functionality,<br />
particularly in areas such as logistics, supply chain<br />
<strong>and</strong> multi-channel;<br />
• Incentivisation structures that are linked to<br />
performance <strong>and</strong> encourage improvement;<br />
• A strong culture, which extends to the types of<br />
people we employ <strong>and</strong> the values <strong>and</strong> leadership<br />
behaviours we encourage.<br />
In delivering our product<br />
solutions we...<br />
Our products are distributed to<br />
the end user through a supply<br />
chain network which…<br />
We strive to provide our<br />
customers with the highest levels<br />
of service possible by…<br />
Neil Ives,<br />
P & H Product<br />
Leader <strong>and</strong><br />
Danny<br />
Mackintosh,<br />
Branch<br />
Supervisor,<br />
City Plumbing<br />
Are committed to ensuring that we<br />
buy quality goods <strong>and</strong> materials<br />
from responsible <strong>and</strong> ethical<br />
sources, at prices that are fair to all.<br />
Purchase a broad range of over<br />
100,000 products from UK <strong>and</strong><br />
overseas manufacturers <strong>and</strong><br />
distributors.<br />
Stock a wide range of own br<strong>and</strong><br />
products, particularly in our<br />
consumer business, as well as<br />
br<strong>and</strong>ed goods supplied by market<br />
leading companies.<br />
Achieve economies of scale by<br />
focussing our purchases towards a<br />
limited number of key suppliers.<br />
Are the largest or second largest<br />
customer for a considerable number<br />
of our suppliers, many of whom<br />
have forged close relationships with<br />
the Group over a long period of time.<br />
Operates from 24 central<br />
warehouses, enabling us to buy<br />
goods in bulk <strong>and</strong> distribute them to<br />
our branches in smaller quantities.<br />
Utilises a distribution fleet of<br />
192 vehicles to transport product<br />
between warehouses <strong>and</strong> branches.<br />
Makes around 350,000 branch<br />
deliveries p.a.<br />
Engages over 1,650 colleagues to<br />
ensure the efficient movement of<br />
stock throughout our organisation.<br />
Improves branch efficiency by<br />
ensuring we have an appropriate<br />
mix of suppliers delivering either<br />
direct to our branches or to our<br />
central warehouses.<br />
Gives customers the opportunity<br />
to transact with our multi-channel<br />
businesses through a nationwide<br />
branch network, via the telephone or<br />
over the internet.<br />
Employing the best available people<br />
<strong>and</strong> investing in their training <strong>and</strong><br />
development.<br />
Ensuring branches maintain high<br />
levels of stock availability in full<br />
project quantities.<br />
Offering advice <strong>and</strong> building related<br />
services that support our customer’s<br />
needs.<br />
Using a fleet of 2,300 vehicles to<br />
provide an efficient, on-time-in–<br />
full, local delivery service, where<br />
customers have chosen not to<br />
collect goods from our sites.<br />
Making credit available for<br />
approximately 80% of customer<br />
purchases in our merchanting<br />
businesses.<br />
Ensuring our prices reflect both the<br />
quality of the goods we sell <strong>and</strong> the<br />
service we provide, whilst remaining<br />
competitive.<br />
17
Chairman’s<br />
Statement<br />
FOR THE YEAR ENDED 31 DECEMBER 2012<br />
Robert Walker<br />
Chairman<br />
Introduction<br />
Travis Perkins is the UK’s largest supplier of materials to<br />
the building <strong>and</strong> construction markets.<br />
We aim to grow the business by providing the widest<br />
possible range of products <strong>and</strong> materials, coupled with<br />
the highest levels of consumer service; <strong>and</strong> in so doing,<br />
provide our shareholders with growing <strong>and</strong> sustainable<br />
returns, based on market leading margins <strong>and</strong> return<br />
on capital.<br />
We reacted quickly to the start of the downturn five<br />
years ago by managing costs <strong>and</strong> trading margins<br />
through the worst construction downturn in living<br />
memory. Since then we have transformed the Group,<br />
through acquisitions <strong>and</strong> strong organic growth, to<br />
become the leading player in the sector today. Our<br />
trading businesses have market leading propositions<br />
that provide a platform for further growth through<br />
network expansion; supported by value adding, shared<br />
central functions. In the past year, we have made good<br />
progress in strengthening our senior executive bench<br />
through recruitment <strong>and</strong> management development,<br />
<strong>and</strong> are well positioned for the next phase in the<br />
Company’s growth story.<br />
2012 was a year of consolidation <strong>and</strong> steady progress<br />
for many of the Group’s businesses <strong>and</strong> trading formats.<br />
Progress was achieved despite some very difficult<br />
trading conditions, particularly during the unusually<br />
wet summer months <strong>and</strong> the disruption <strong>and</strong> distraction<br />
caused by the London Olympics.<br />
Despite this, we were pleased to complete the<br />
acquisition of Toolstation, adding further branches <strong>and</strong><br />
taking initial steps to test the validity of the concept in<br />
Holl<strong>and</strong>. More recently, in January 2013, we acquired<br />
Solfex, an important <strong>and</strong> fast-growing distributor of<br />
environmental products <strong>and</strong> building materials. This<br />
will add significantly to the Group’s eco-building range<br />
<strong>and</strong> environmental credentials. Good progress continued<br />
in integrating the former BSS businesses, <strong>and</strong> both<br />
cost synergies <strong>and</strong> progress on systems integration are<br />
ahead of our original targets. We also added additional<br />
branches across the rest of the Group’s trading formats,<br />
bringing the total number of operating branches at the<br />
year end to 1,896.<br />
Results<br />
The markets that our businesses operate in remain<br />
very competitive, having contracted in volume terms<br />
for the fifth year running. Against that background, our<br />
revenue increased by 1.4% to £4.9bn (2011: £4.8bn) with<br />
adjusted pre-tax profits rising by 1% to £300m; adjusted<br />
earnings per share were up by 2.1% to 95.1 pence.<br />
A continued focus on cash generation has reduced<br />
debt by a further £131m to £452m at 31 December 2012<br />
after allowing for the £24m paid to acquire the 70% of<br />
Toolstation shares we did not already own.<br />
Our integration of BSS has made good progress <strong>and</strong><br />
our excellent work to realise synergies has resulted in<br />
£32m being recognised in 2012, £7m higher than our<br />
original expectation for 2013.<br />
We are pleased with the performance of the<br />
Toolstation business in its first year of our ownership<br />
<strong>and</strong> have added a further 20 branches to its portfolio<br />
during 2012.<br />
18
T R A V I S P E R K I N S A N N U A L R E P O R T A N D A C C O U N T S 2 0 1 2<br />
“Progress was achieved despite some very<br />
difficult trading conditions, particularly during<br />
the unusually wet summer months.”<br />
Dividend<br />
Supported by good operational delivery <strong>and</strong> having<br />
carefully considered the current condition of the market<br />
in which the Group operates the Board has decided it<br />
is appropriate to continue increasing dividends ahead<br />
of earnings growth, reducing dividend cover towards its<br />
previously stated target range of 2.5 times to 3.5 times.<br />
The Board is pleased to recommend a final dividend<br />
of 17 pence per share, payable to shareholders on the<br />
register on 3 May 2013, which will give a total dividend<br />
for 2012 of 25 pence per share. With a proposed 25%<br />
increase in full year dividend, dividend cover for the year<br />
based on adjusted earnings per share is now 3.8x (2011:<br />
4.7x). The total cash outflow for dividends declared in<br />
2012 will be £60m.<br />
Board of directors<br />
In September, we announced that Paul Hampden Smith,<br />
our Group Finance Director for the past 16 years, had<br />
decided to retire from the Board in March 2013. It is<br />
impossible to overestimate the contribution that Paul<br />
has made to the Group’s success during his years as<br />
Finance Director <strong>and</strong> everyone in the Group will want<br />
to join me in wishing Paul every success for the future.<br />
In replacing Paul, we have recruited Tony Buffin as<br />
Group Finance Director, who will join us on 8 April 2013.<br />
He was previously Group CFO for Coles, the substantial<br />
Australian supermarket chain <strong>and</strong> had previously<br />
worked for Groupe Aeroplan, Loyalty Management<br />
Group, <strong>and</strong> Alliance Boots.<br />
In January 2013 John Coleman was appointed as our<br />
Senior Independent Director replacing Chris Bunker, who<br />
had held that position for the previous four years. Chris<br />
has been Chairman of the Audit Committee since April<br />
2004, <strong>and</strong> will step down from this role during 2013.<br />
Employees<br />
Difficult trading conditions always seem to bring the<br />
best out of our colleagues in the business. Once again,<br />
they have produced good results in the most difficult<br />
of circumstances. I would like to pass on my thanks on<br />
behalf of both the Board <strong>and</strong> our Shareholders.<br />
Outlook<br />
We anticipate difficult conditions in the first half year,<br />
but there are reasons to be more optimistic about the<br />
second half, when recent rises in mortgage <strong>and</strong> housing<br />
transactions should feed into improved volumes. We will<br />
continue to monitor these lead indicators <strong>and</strong> trends<br />
carefully, <strong>and</strong> expect that our next move will be to a<br />
more expansionary stance on volume, whilst continuing<br />
our restrained approach on costs, further benefitting<br />
from overhead gearing <strong>and</strong> improving operating margins.<br />
Robert Walker<br />
Chairman<br />
REPORTS<br />
19
Chief Executive’s<br />
Review of the Year<br />
FOR THE YEAR ENDED 31 DECEMBER 2012<br />
Geoff Cooper<br />
Chief Executive<br />
Introduction<br />
The Group made good progress in 2012, despite a<br />
challenging construction industry background resulting<br />
from a combination of continuing economic uncertainty,<br />
the wettest weather conditions in living memory <strong>and</strong><br />
continued reductions in public sector activity <strong>and</strong> weak<br />
consumer confidence.<br />
Action in both like-for-like (‘LFL’) <strong>and</strong> exp<strong>and</strong>ed<br />
operations has enabled the Group to achieve increases<br />
in turnover, adjusted operating profits, profits before tax,<br />
earnings per share <strong>and</strong> to recommend a 25% increase in<br />
the full year dividend.<br />
Construction activity in 2012 fell by about 9%, whilst<br />
the materials distribution market fell in volume by<br />
about 4%.<br />
We have continued to execute trading tactics finely<br />
tuned to the current environment with the aim of<br />
maximising operating profits <strong>and</strong> operating margin. This<br />
has meant that for most of our businesses <strong>and</strong> branches<br />
we have focussed on gross margin protection, which<br />
has caused us to turn away some unprofitable sales,<br />
balancing cost control with protecting service levels <strong>and</strong><br />
carefully managing working capital.<br />
By focussing more on gross margin we have<br />
de-emphasised our goal of out-performing markets<br />
on a LFL basis, reducing our previous rate of sales<br />
out-performance. For the year as a whole we have<br />
sustained our market share <strong>and</strong> a market position<br />
consistent with our objective of trading sensibly in a<br />
disappointing market.<br />
Against contracting market volumes, our trading<br />
stance <strong>and</strong> our continued programme of self-help<br />
initiatives has increased profits by 4.5%, with the main<br />
drivers of our improved financial performance coming<br />
from; Toolstation, for which we acquired the remaining<br />
70% of its share capital on 3 January 2012; the 13 new<br />
ex-Focus stores which were opened in the autumn of<br />
2011; <strong>and</strong> our BSS synergy programme.<br />
Having acquired Toolstation in 2012 <strong>and</strong> previously<br />
having acquired BSS, we chose to limit other network<br />
expansion to ‘tidying up’ the estate <strong>and</strong> a few high<br />
returning projects. However, the economic environment<br />
also presented us with a few other opportunities. In 2012<br />
we saw a small, but clearly discernible worsening in the<br />
outlook for a number of competitor companies in our<br />
sector. Our Specialist division benefited from the slow<br />
demise of the leading civils <strong>and</strong> heavyside distributor<br />
during the second half of the year <strong>and</strong> a number of<br />
company administrators <strong>and</strong> independent owners<br />
offered to sell us small businesses. In most cases we<br />
declined the opportunity, preferring to let the capacity<br />
fall out of the market, but we were able to agree terms to<br />
acquire the trade <strong>and</strong> assets for five businesses. Overall<br />
this expansion has increased our turnover by 2.8%.<br />
On 1 January we established our new Plumbing<br />
<strong>and</strong> Heating division under the chairmanship of Paul<br />
Tallentire. He has been closely involved with our BSS<br />
integration programme which has seen a restructuring<br />
of the PTS management team, the roll out of a new<br />
point-of-sales system with enhanced functionality<br />
into PTS <strong>and</strong> the closure of several poorly performing<br />
branches. Further work remains in the BSS integration<br />
programme, however a significant value of synergies<br />
has been achieved, <strong>and</strong> many of the organisational <strong>and</strong><br />
technology changes have been implemented.<br />
The BSS synergy programme has continued to<br />
20
T R A V I S P E R K I N S A N N U A L R E P O R T A N D A C C O U N T S 2 0 1 2<br />
“For the year as a whole we have sustained our<br />
market share <strong>and</strong> a market position consistent<br />
with our objective of trading sensibly in a<br />
disappointing market.”<br />
exceed our expectations. Having beaten our original<br />
£8m synergy target for 2011 by £12m, we reset our<br />
2012 target to £30m. Thanks to the excellent work of<br />
a large number of colleagues, synergies for 2012 have<br />
totalled £32m of which £6m related to overheads <strong>and</strong><br />
£26m to buying gains. Despite this success, our work to<br />
maximise synergies is not yet fully complete. We have<br />
identified further opportunities of around £5m for 2013,<br />
but these will be more difficult to deliver as it will involve<br />
structural change to supply chain activities.<br />
Markets <strong>and</strong> our response<br />
According to the Consumer Products Association,<br />
construction output in 2012 fell by about 9% as a result<br />
of a significant reduction in public spending coupled<br />
with a slowdown in private sector investment caused<br />
by economic uncertainty. That reduction is the worst<br />
market performance since the depths of the recession<br />
back in 2009.<br />
Despite a relatively strong start to 2012, we predicted,<br />
in early 2012, that volumes in our markets would fall<br />
for the year as a whole. In reality the performances<br />
of our end markets have been mixed. Volumes in the<br />
merchanting market actually reduced by around 2%<br />
whilst retail market volumes are down by around<br />
7% year-on-year, which has resulted in even greater<br />
competition for sales.<br />
The majority of our business is related to RMI<br />
activities which have been a little more robust than the<br />
other parts of the market that we operate in.<br />
In the private sector new build has been relatively flat<br />
for most of the year although we have seen some gentle<br />
expansion towards the end of the year. Latent dem<strong>and</strong><br />
for new housing has increased, but low consumer<br />
confidence <strong>and</strong> restricted funding availability has<br />
caused subdued numbers of mortgage approvals <strong>and</strong><br />
housing transactions, which remain at half the level they<br />
were in 2006. The Government’s action to encourage first<br />
time buyers through Funding for Lending, Firstbuy <strong>and</strong><br />
the Newbuy guarantee scheme are to be welcomed, but<br />
the overall housing market remains in desperate need of<br />
a kick start.<br />
Public sector spend on construction has contracted<br />
sharply, particularly in new build as the government<br />
cuts have taken effect, but opportunities remain in some<br />
segments such as rail <strong>and</strong> utilities.<br />
The economic uncertainty continues to impact<br />
consumers, with confidence levels little higher than in<br />
December 2011. Consumers remain cautious because<br />
wage awards are once again below the rate of inflation,<br />
<strong>and</strong> until recently money has been hard to come by.<br />
This has adversely impacted the consumers’ desire to<br />
make big money purchases.<br />
Financial performance<br />
Throughout this annual report, consistent with our<br />
approach last year, the term ‘adjusted’ has been used<br />
to signify that the effects of exceptional items <strong>and</strong><br />
amortisation of intangible assets have been excluded<br />
from the disclosures being made. Details of the<br />
exceptional items are given in the Finance Director’s<br />
review of the year on page 39.<br />
A combination of the economy <strong>and</strong> the extreme<br />
weather conditions had a significant impact on<br />
construction activity <strong>and</strong> constrained the performance<br />
of our heavy-side businesses.<br />
REPORTS<br />
21
C H I E F E X E C U T I V E ’ S R E V I W O F T H E Y E A R<br />
Total revenue is 1.4% higher than for 2011 at<br />
£4,845m (2011: £4,779m), driven by the Toolstation<br />
acquisition <strong>and</strong> the 13 ex-Focus stores opened during<br />
the autumn of 2011.<br />
We have modified our group trading stance to reflect<br />
the more competitive environment we have experienced<br />
during 2012 with the result that we have traded some<br />
volume to protect margin. Even so, by concentrating<br />
on our customer propositions, we have sustained our<br />
performance relative to the market, which together with<br />
our ability to pass through the bulk of cost inflation<br />
from suppliers has restricted the like-for-like sales<br />
volume reduction to 2.4% in markets that we estimate<br />
fell by around 4%.<br />
The pricing environment has weakened as the year<br />
has progressed with full year price inflation of 1% rather<br />
than a more normal 3%. By quarter 4 month-on-month<br />
sales price inflation for the Group was virtually zero,<br />
with merchanting slightly positive, consumer flat <strong>and</strong><br />
plumbing <strong>and</strong> heating negative due to the impact of<br />
reducing basic commodity pricing.<br />
With the exception of the plumbing <strong>and</strong> heating<br />
division, like-for-like volumes improved in the second<br />
half of the year when compared with the first half,<br />
particularly in our Specialist division where Keyline<br />
benefited from the failure of a major competitor.<br />
Sales expansion arose primarily from the Toolstation<br />
acquisition <strong>and</strong> our subsequent investment in opening<br />
a further 20 new branches <strong>and</strong> the full year effect of the<br />
13 new Wickes stores opened in 2011. In our plumbing<br />
<strong>and</strong> heating division 2012 total sales show a reduction<br />
compared with 2011 principally because of the sale of<br />
Buck <strong>and</strong> Hickman during September 2011.<br />
With a competitive market we concentrated on<br />
carefully managing our overhead base with the result<br />
that each of our businesses showed an improvement<br />
in operating margin, or at worst a very slight decline<br />
when compared with 2011. Group operating margin has<br />
improved by 0.1% to 6.7% due to an improvement in<br />
overall gross margins for the Group <strong>and</strong> the additional<br />
benefits from our synergy programme. Whilst the<br />
overhead to sales ratio has increased by 0.3%, this<br />
was principally a mix effect of Toolstation being<br />
consolidated for the first time.<br />
Adjusted operating profit increased by £14m to<br />
£327m (2011: £313m), which resulted in an adjusted<br />
group operating margin of 6.7%, a 0.1% improvement<br />
over 2011. Even though the effect of currency<br />
fluctuations on our portfolio of derivatives increased<br />
financing costs by 62% to £27m (2011: £17m), the<br />
Group still improved adjusted pre-tax profits by £3m<br />
(1%) to £300m (2011: £297m).<br />
Adjusted earnings per share increased by 2.1% to 95.1<br />
pence (2011: 93.1 pence).<br />
General Specialist Plumbing<br />
Revenue Merchanting Merchanting Consumer & Heating Total<br />
% % % % %<br />
Volume (1.5) (0.2) (6.6) (1.6) (2.4)<br />
Price 1.5 2.5 1.0 - 1.0<br />
Like-for-like per day - 2.3 *(5.6) (1.6) (1.4)*<br />
Trading day impact - - 0.3 - -<br />
Expansion / disposals 0.9 1.3 18.5 (4.4) 2.8<br />
Total revenue change 0.9 3.6 13.2 (6.0) 1.4<br />
*<br />
Including Toolstation on a proforma basis would result in like-for-like sales for Consumer being -3.1% <strong>and</strong> for the Group being -0.8%.<br />
Adjusted operating General Specialist Plumbing<br />
margin Merchanting Merchanting Consumer & Heating Total<br />
% % % % %<br />
2011 operating margin 11.8 4.5 4.5 4.6 6.6<br />
Gross margin (0.9) - 0.4 (0.6) 0.2<br />
Synergies 0.2 0.1 0.1 0.7 0.2<br />
Overheads 0.6 0.5 0.6 (0.2) (0.3)<br />
2012 property differential (0.2) 0.1 - - -<br />
2012 operating margin 11.5 5.2 5.6* 4.5 6.7<br />
*Excluding Toolstation, gross margin improved by 1.1%, overheads to sales rose by 0.1% <strong>and</strong> property profits to sales rose by 0.1% giving a year-on-year<br />
divisional operating margin increase of 1.2%.<br />
Joanne<br />
Kavanagh,<br />
Customer Service<br />
Assistant at<br />
Travis Perkins,<br />
Rickmansworth,<br />
with tile display<br />
22
T R A V I S P E R K I N S A N N U A L R E P O R T A N D A C C O U N T S 2 0 1 2<br />
REPORTS<br />
23
C H I E F E X E C U T I V E ’ S R E V I W O F T H E Y E A R<br />
Divisions<br />
General Merchanting<br />
2012 2011 Change<br />
£m £m %<br />
Turnover 1,457 1,443 0.9%<br />
Adjustment segment profit 167 170 -1.9%<br />
The growth in sales in our General Merchanting<br />
division has arisen from the limited expansion we have<br />
undertaken during the year – LFL sales growth was<br />
zero. Volumes were only 1.5% lower than 2011, whilst<br />
sales prices rose by an average of 1.5% over the course<br />
of the year.<br />
Gross margin declined by 0.9% due to reduced<br />
product inflation (0.5%), customer mix changes arising<br />
from the better performance of large contractors<br />
compared to their smaller competitors (0.2%), <strong>and</strong> more<br />
competitive market conditions as construction activity<br />
fell (0.2%). In a stable, or even a rising market, we would<br />
expect each of these drivers to reverse.<br />
The tough gross margin conditions were balanced by<br />
management in the division exercising tight cost control,<br />
<strong>and</strong> the overhead to sales ratio improved by 0.6%.<br />
Divisional operating margin was only 0.1% below 2011,<br />
adjusting for the change in property profits.<br />
Kevin Appleton, the divisional chairman, <strong>and</strong> his<br />
team have implemented a number of initiatives to drive<br />
profitability. On a selective basis low margin business<br />
is being turned away <strong>and</strong> customer <strong>and</strong> product<br />
profitability is being closely monitored to manage mix.<br />
Marketing initiatives are in place to target profitable<br />
segments, <strong>and</strong> the overall customer service is being<br />
enhanced through the development of dedicated<br />
customer contact centres.<br />
Further opportunities to improve efficiency have been<br />
identified via selective actions aimed at employee <strong>and</strong><br />
vehicle productivity.<br />
Specialist Merchanting<br />
2012 2011 Change<br />
£m £m %<br />
Turnover 604 582 3.6%<br />
Adjusted segment profit 32 26 20.2%<br />
Under the guidance of Arthur Davidson, the Specialist<br />
division recorded a strong performance driven by<br />
Keyline, our heavy-side, civils <strong>and</strong> drainage business.<br />
The division gained further market share <strong>and</strong> reported<br />
a 2.3% like-for-like sales growth on the back of above<br />
average price inflation. The team did well to protect<br />
gross margin recording a flat year-on-year performance<br />
in increasingly competitive markets.<br />
The failure of the largest civils merchant brought<br />
some short-term benefit to Keyline as both customers<br />
<strong>and</strong> suppliers sought to put more business our way.<br />
Even though many of the closed branches have now<br />
been sold <strong>and</strong> re-opened, the Keyline team is working<br />
hard to retain the new business they have won. New<br />
opportunities in rail <strong>and</strong> utilities are being pursued by<br />
dedicated teams established during the year.<br />
Net margin progress in Keyline was good <strong>and</strong><br />
according to our key suppliers our business growth with<br />
them outperformed their respective markets. Having<br />
suffered from the lack of buying gains in the first half, we<br />
created opportunities which crystallised in the second<br />
half without a rise in stock levels.<br />
CCF faced intensified competition during the<br />
year as its markets have been particularly difficult.<br />
The commercial market is affected by both lower<br />
commercial construction activity <strong>and</strong> reduced new<br />
public sector spending in buildings such as hospitals<br />
<strong>and</strong> schools, which has all but dried up.<br />
Benchmarx has seen another improvement in its<br />
performance with sales growing by nearly 20%. LFL<br />
sales growth was close to double digits <strong>and</strong> at the same<br />
time gross margin advanced. The business has been<br />
targeting the contracts market <strong>and</strong> the investment made<br />
is now starting to pay off.<br />
As with our other divisions, the Specialist businesses<br />
paid close attention to managing the overhead base with<br />
the result that the ratio of overheads to sales fell by 0.5%<br />
equivalent to savings of approximately £3m.<br />
Consumer<br />
2012 2011 Change<br />
£m £m %<br />
Turnover 1,152 1,018 13.2%<br />
Adjusted segment profit 65 46 40.7%<br />
Our Consumer Division, led by Jeremy Bird has<br />
significantly outperformed in 2012, with the Wickes, Tile<br />
Giant <strong>and</strong> Toolstation businesses all producing excellent<br />
results. The consumer division markets were the hardest<br />
hit of any that our divisions operate in, so that makes<br />
the result achieved in 2012 even more remarkable. A<br />
combination of careful margin management, strong<br />
overhead control <strong>and</strong> targeted investment resulted in<br />
profits rising by 40.7% whilst turnover on a reported<br />
basis was up only 13.2%. If Toolstation is excluded from<br />
the 2012 result, divisional turnover was flat year-onyear,<br />
whilst profits increased by 26.5%.<br />
Wickes has made further market share gains, for the<br />
sixth year in a row. Both the Trade <strong>and</strong> Kitchen <strong>and</strong><br />
Bathroom offerings have done well, but our performance<br />
in the DIY segment has been less strong as discretionary<br />
spend has been under pressure.<br />
Our trading tactics continue to deliver both higher<br />
gross margins <strong>and</strong> sustained market share through<br />
careful management of promotions, range developments<br />
<strong>and</strong> working with suppliers to reduce supply chain costs.<br />
24
T R A V I S P E R K I N S A N N U A L R E P O R T A N D A C C O U N T S 2 0 1 2<br />
Research continues to indicate the clarity <strong>and</strong> simplicity<br />
of the Wickes <strong>and</strong> Tile Giant propositions are compelling<br />
for many customers.<br />
Toolstation performed strongly as those stores opened<br />
with our support pre-acquisition moved further towards<br />
maturity. Like-for-like sales are up 21%, significantly<br />
ahead of other multi-channel operators, profits are<br />
approximately 280% higher <strong>and</strong> the estate has grown by<br />
20 branches during the year.<br />
Overheads were well controlled throughout the<br />
division with the ratio of overheads to sales for Wickes<br />
<strong>and</strong> Tile Giant increasing by only 0.1% despite turnover<br />
remaining flat. Wickes like-for-like costs fell as a result of<br />
changing the store colleague structure late in 2011 <strong>and</strong><br />
from re-targeting their marketing spend.<br />
Plumbing <strong>and</strong> Heating<br />
2012 2011 Change<br />
£m £m %<br />
Gross turnover 1,632 1,736 -6.0%<br />
Adjusted segment profit 73 80 -8.7%<br />
If the results of Buck <strong>and</strong> Hickman <strong>and</strong> 17 P&H<br />
branches divested in 2011 are excluded from the 2011<br />
comparative, turnover has decreased by £21m (1.2%),<br />
whilst net profit fell by £5m (6.3%).<br />
Throughout 2012, trading in both the commercial<br />
<strong>and</strong> domestic markets has been difficult. The domestic<br />
heating market was subdued all year with the markets for<br />
the key product groups of boilers <strong>and</strong> radiators 2% <strong>and</strong><br />
10% down year-on-year respectively. The ending of the<br />
last phase of government subsidies impacted dem<strong>and</strong><br />
<strong>and</strong> new initiatives such as Green Deal, Renewable Heat<br />
Incentive <strong>and</strong> the energy company ECO commitments<br />
did not have any real impact during the year.<br />
In a low dem<strong>and</strong> market, competition remained<br />
intense <strong>and</strong> throughout the year decisions were taken<br />
to improve pricing <strong>and</strong> monitor customer profitability.<br />
In PTS several long st<strong>and</strong>ing supply relationships were<br />
re-negotiated or terminated altogether.<br />
The Group has a good record of pre-price increase<br />
stock buying. With sales price deflation in our plumbing<br />
market those opportunities to bolster margins through<br />
buying gains have been considerably more limited.<br />
The industrial businesses of BSS were the strongest<br />
performer in a weakening plumbing market. Some major<br />
contract wins helped protect sales with margins slightly<br />
above last year’s levels due to a number of self-help<br />
measures improving product mix. Good overhead control<br />
resulted in an improvement in overall operating margin.<br />
The domestic business, which includes PTS <strong>and</strong><br />
F&P, our wholesale distribution business supplying<br />
second tier merchants, has suffered as a result of a sharp<br />
contraction in the boiler <strong>and</strong> radiator markets <strong>and</strong> low<br />
product inflation. Tight competitive conditions have<br />
resulted in a reduction in margins, <strong>and</strong> management<br />
have taken action to cut costs by restructuring the<br />
network, closing nine branches.<br />
City Plumbing performed well <strong>and</strong> whilst its likefor-like<br />
turnover is slightly down, it has improved its<br />
gross margin compared with 2011. Our ‘Endeavour’ new<br />
showroom concept has continued to outperform the<br />
rest of the estate <strong>and</strong> so we will extend their presence<br />
throughout the estate during 2013.<br />
P&H divisional overheads were tightly controlled<br />
with some additional costs being incurred by PTS for<br />
the full year administration of the solus British Gas<br />
contract to whom we are proud to provide an industry<br />
leading service.<br />
Overseas expansion<br />
During the year we have taken our first tentative<br />
step into international markets. In conjunction with<br />
the founder of Toolstation, we have made a small<br />
investment of less than €2m in five Toolstation branches<br />
located in the Netherl<strong>and</strong>s that were previously<br />
franchised to an independent operator. The initial focus<br />
has been on exp<strong>and</strong>ing the product range <strong>and</strong> improving<br />
marketing, but much work still needs to be done. Whilst<br />
we anticipate making further small investments in 2013<br />
<strong>and</strong> 2014, it will be some time before we are able to<br />
determine whether the venture will be successful.<br />
Investors <strong>and</strong> lenders<br />
Holders of the Company’s equity are concentrated<br />
primarily in the UK <strong>and</strong> North America, with North<br />
American investors now holding 26% of the Company’s<br />
shares. We are committed to frequent <strong>and</strong> open dialogue<br />
with our shareholders <strong>and</strong> we take a pro-active stance to<br />
ensure we meet with as many of them as possible.<br />
During the year a combination of me, Paul Hampden<br />
Smith <strong>and</strong> John Carter met with 44 investors holding<br />
55% of our shares at least once. We also met with a<br />
significant number of non-holders as we sought to widen<br />
our investor base.<br />
We find that both investors, members of the analyst<br />
community <strong>and</strong> our lenders benefit from seeing<br />
our operations first h<strong>and</strong>. It provides them with an<br />
opportunity to see our sites <strong>and</strong> talk with the hard<br />
working colleagues who make Travis Perkins such a<br />
strong company. During 2012 we undertook 3 store,<br />
warehouse <strong>and</strong> branch visits <strong>and</strong> we intend to continue<br />
this in 2013. In the autumn, once we have completed our<br />
annual strategy review, we expect to combine a site tour<br />
with a strategic update for both investors <strong>and</strong> analysts.<br />
I reported last year that in difficult markets for<br />
raising finance we had secured a £550m revolving credit<br />
facility that is available to draw down from April 2013.<br />
As with our investors, we think it is important to build<br />
relationships with our banks <strong>and</strong> other lenders <strong>and</strong><br />
so we maintain regular contact throughout the year.<br />
I am pleased to report that the confidence the banks<br />
showed in the Group last year has continued. Following<br />
REPORTS<br />
25
C H I E F E X E C U T I V E ’ S R E V I W O F T H E Y E A R<br />
discussions with several banks who were interested in<br />
making further funds available to the Group at improved<br />
rates, we have secured a £50m of medium term<br />
committed funding by way of a bilateral loan.<br />
Executive committee<br />
If we are to maintain our position as the UK’s leading<br />
supplier of building materials we need to invest in<br />
our executive team to ensure we have the best talent<br />
available to develop <strong>and</strong> deliver our strategy. During<br />
2012 there have been two significant changes to our<br />
Executive Committee.<br />
After 40 years of service with the Group, Joe Mescall<br />
retired on 31 December 2012. Whilst the phrase ‘can<br />
never be replaced’ is over-used <strong>and</strong> is rarely true, it<br />
should be applied to unique people <strong>and</strong> Joe is definitely<br />
one of these. He has a great blend of long <strong>and</strong> varied<br />
experience, well honed leadership skills <strong>and</strong> first class<br />
trading ‘nous’ which is admired by everyone who has<br />
had the privilege to work with him.<br />
Joe’s position has been taken by Kevin Appleton.<br />
Kevin joined us from the Lavendon Group where he<br />
held the position of CEO for 10 years. He brings a lot of<br />
relevant experience from the customer-focused delivery<br />
services <strong>and</strong> logistics sectors having previously held<br />
managing director roles for a division of FedEx <strong>and</strong> the<br />
Dexlon group. I am confident that the new experiences<br />
Kevin brings will build on the achievements of Joe <strong>and</strong><br />
the TP team to ensure that we continue to stay ahead of<br />
our competitors.<br />
Our second key appointment was Jean-Jacques<br />
(‘JJ’) Van Oosten to the position of Chief Information<br />
Officer. This position is critical to the Group’s continued<br />
development so it was important that we employed a<br />
person with a proven track record of determining IT<br />
strategy, leading large teams <strong>and</strong> delivering complex IT<br />
projects in a multichannel environment.<br />
JJ was previously at Tesco plc where he held the<br />
role of CIO <strong>and</strong> Market place Director both reporting<br />
to the CEO of Tesco.com. He led <strong>and</strong> delivered critical<br />
programmes which established Tesco’s multi channel<br />
IT capability. Prior to that he was the Group CIO for<br />
Kingfisher plc, where he established <strong>and</strong> led a shared<br />
service centre for IT that combined twelve technology<br />
teams across multiple geographies. He was also<br />
responsible for delivering systems for B&Q Trade<br />
counter <strong>and</strong> leading the multi-channel agenda.<br />
Charitable <strong>and</strong> community activities<br />
We are passionate about the charitable work we<br />
undertake, <strong>and</strong> we continue to have strong <strong>and</strong><br />
extremely valuable partnerships with a number of<br />
British charities. The enthusiasm <strong>and</strong> commitment<br />
shown by our colleagues as they fundraise is something<br />
we are enormously proud of. We are also delighted by<br />
the support frequently provided by our customers <strong>and</strong><br />
our suppliers.<br />
Each of our 16 businesses supports their preferred<br />
charity, selected by employees, <strong>and</strong> throughout<br />
2012 they pursued a range of activities to raise<br />
funds. An army of employees across the Group grew<br />
dubious moustaches in support of Movember <strong>and</strong><br />
Prostate Cancer UK, the charity partner of our Keyline<br />
business, while Tim Parsons <strong>and</strong> Paul Widger from<br />
our PTS business braved sweltering heat to cycle 500<br />
kilometres from Ho Chi Minh City in Vietnam to Angkor<br />
Wat in Cambodia, raising over £14,400 for Cancer<br />
Research UK.<br />
The Travis Perkins business was awarded ‘Business<br />
of the Year’ at the 2012 Business Charity Awards,<br />
sponsored by the Charities Aid Foundation (CAF), for its<br />
outst<strong>and</strong>ing partnership with Breast Cancer Campaign<br />
<strong>and</strong> Together for Short Lives over the last three years.<br />
As the driving force behind a number of charitable<br />
initiatives, including painting a number of Travis Perkins<br />
delivery trucks pink, Ian Church was awarded ‘Business<br />
Charity Champion 2012’. Ian, formerly Managing<br />
Director of Travis Perkins in the Midl<strong>and</strong>s <strong>and</strong> now<br />
Managing Director of our PTS business, underst<strong>and</strong>s<br />
the power of charitable activity as a way of driving the<br />
engagement of employees <strong>and</strong> customers.<br />
Internally, our employees can support additional<br />
charitable activity through payroll-giving <strong>and</strong> a<br />
‘Colleague Lottery’, <strong>and</strong> the popularity of these schemes<br />
remains undiminished.<br />
Thanks to wonderful activities like these, we are<br />
pleased to have donated more than £2.1m (2011: £1.9m)<br />
through group activities, including £165,716 (2011:<br />
£146,217) directly from the Group, to worthwhile causes<br />
in the fields of cancer research, support for children <strong>and</strong><br />
young people, <strong>and</strong> the hospice movement, to name a few.<br />
We encourage our colleagues <strong>and</strong> businesses to<br />
support community activities in the areas they live, work<br />
<strong>and</strong> operate. During the year many opportunities arose<br />
where we were able to help; here are just a few examples.<br />
BSS Industrial donated sleeping bags to charities<br />
across various locations in December, giving a small<br />
helping h<strong>and</strong> to the homeless over the harsh winter.<br />
Travis Perkins supported the next generation of builders<br />
by donating materials to Live Train, a London-based<br />
training scheme which equips unemployed people with<br />
the skills <strong>and</strong> experience to start a sustainable career in<br />
the construction industry.<br />
CCF <strong>and</strong> Travis Perkins branches in Reading teamed<br />
up to fit new flooring for West Street, a house for<br />
severely disabled children in Henley on Thames, whilst<br />
colleagues from Travis Perkins Hyde helped create a<br />
memorial garden in memory of PCs Fiona Bone <strong>and</strong><br />
Nicola Hughes, the two Greater Manchester Police<br />
officers who were tragically killed in September.<br />
Piotr<br />
Trebiatowski,<br />
Warehouse<br />
Operative<br />
at Brackmills<br />
distribution<br />
centre<br />
26
T R A V I S P E R K I N S A N N U A L R E P O R T A N D A C C O U N T S 2 0 1 2<br />
REPORTS<br />
27
Post year end acquisition<br />
We expect the renewables market for construction<br />
materials to show growth ahead of market averages for<br />
some time, as consumers become better informed <strong>and</strong><br />
invest to reduce their energy costs whilst improving<br />
carbon generated.<br />
On 30 January we acquired the renewable energy<br />
distribution specialists, Solfex Energy Systems (‘Solfex’),<br />
a company that in December 2012 was listed as the UK’s<br />
fifth fastest growing private company in the Sunday<br />
Times Virgin Fast Track 100.<br />
Solfex uses its distribution platform to integrate <strong>and</strong><br />
supply components to the UK’s renewable companies<br />
<strong>and</strong> provides a value-added service to customers through<br />
comprehensive technical <strong>and</strong> customer support. It is a<br />
valuable addition to the Plumbing <strong>and</strong> Heating Division<br />
of our Group.<br />
Our strategy of offering our customers an integrated<br />
approach to energy efficient building will be greatly<br />
enhanced by the market leading proposition created by<br />
the Solfex team.<br />
2013 performance<br />
It is difficult to draw any conclusions from the first few<br />
weeks of trading because the January 2012 comparator<br />
was quite strong whilst 2013 has seen a continuation of<br />
the poor weather conditions experienced in 2012. Overall<br />
group LFL sales, on a delivered basis, for the first seven<br />
weeks were down 5.1%.<br />
General Specialist Plumbing<br />
Merchanting Merchanting Consumer & Heating Total<br />
% % % % %<br />
(4.5) 2.0 (7.6) (5.4) (5.1)<br />
We view underlying like-for-like sales in February as<br />
broadly flat.<br />
Outlook<br />
Our like-for-like sales in quarter 4 of 2012 showed an<br />
improving trend on the two previous quarters in most<br />
of our businesses making it difficult to read for signals<br />
of underlying activity. Accordingly, we look to medium<br />
term indicators to plan our resource levels for 2013<br />
<strong>and</strong> beyond.<br />
In the short term, trends will be volatile; we<br />
currently anticipate that our markets will be stronger<br />
in the second quarter, mainly due to a relatively weak<br />
comparator in 2012 <strong>and</strong> potential recovery from low<br />
activity levels expected in first three months of this year.<br />
Whilst this suggests difficult conditions will remain<br />
in the first half year, there are reasons to be more<br />
optimistic about the second half. The recent rise in<br />
mortgage <strong>and</strong> housing transaction activity should feed<br />
into improved volumes in the market by the second<br />
half of the year. In the public sector market, the huge<br />
potential spending on various infrastructure programmes<br />
announced by the government should begin to gradually<br />
show in real activity on (<strong>and</strong> in) the ground.<br />
Overall we believe that market volumes for 2013 are<br />
likely to be lower than 2012, but the rate of decrease will<br />
be smaller than last year at around 1% to 2%. Inflation is<br />
likely to stay low with early indications suggesting it will<br />
be around 1% to 2% for the second year running.<br />
Since the financial crisis in 2008, the term ‘roller<br />
coaster’ could fairly be applied to the gradient of annual<br />
<strong>and</strong> monthly change in our markets. Five years later,<br />
we have yet to experience a flatter track, <strong>and</strong> we wait<br />
for evidence of a steady recovery from the current<br />
unsustainably low levels of activity.<br />
We have an excellent track-record of matching our<br />
margin <strong>and</strong> costs to the prevailing market conditions,<br />
<strong>and</strong> we judge our cautious stance to be appropriate.<br />
However, we shall be monitoring lead indicators<br />
carefully, <strong>and</strong> expect that our next change will be to<br />
a more expansionary stance in volume. We plan to<br />
combine this with a restrained approach to costs, so as<br />
to benefit from overhead gearing <strong>and</strong> further improve<br />
operating margins. We anticipate increasing expenditure<br />
only for unavoidable inflation <strong>and</strong> pension increases <strong>and</strong><br />
subject to satisfactory trading continuing, we plan to<br />
invest further in pursuing our multichannel strategy.<br />
Whilst, for most of our businesses, our operating<br />
margins remain ahead of our competitors, the ‘trough’<br />
levels of market activity are consistent with, against<br />
recent history, operating margins, which we regard<br />
as unsatisfactory for three of our four divisions. For<br />
Specialist, P&H <strong>and</strong> Consumer divisions a combination<br />
of self help initiatives <strong>and</strong> a recovering market should<br />
deliver steady growth in operating margins. For Travis<br />
Perkins, investments in improvements to the proposition<br />
will be applied to increasing market share on a LFL<br />
basis, whilst sustaining operating margins.<br />
So in summary, we think the performance of our<br />
markets in 2013 may begin to turn, but it will be<br />
mainly through our own endeavours to outperform our<br />
competition <strong>and</strong> manage our operating margin that the<br />
Group will be driven forward.<br />
Geoff Cooper<br />
Chief Executive<br />
Cain Doolan,<br />
Manager,<br />
BSS Industrial,<br />
Reading<br />
28
T R A V I S P E R K I N S A N N U A L R E P O R T A N D A C C O U N T S 2 0 1 2<br />
REPORTS<br />
29
Deputy Chief<br />
Executive’s<br />
Review of the Year<br />
FOR THE YEAR ENDED 31 DECEMBER 2012<br />
John Carter<br />
Deputy Chief Executive<br />
Introduction<br />
After planning our new divisional structure during<br />
2011 <strong>and</strong> ensuring that we had the right people in<br />
place with the right blend of skills to take our business<br />
forward, 2012 has been a year where our efforts have<br />
been directed towards consolidating our previous<br />
achievements whilst managing in a commercially<br />
challenging environment.<br />
Early in the year we changed slightly our approach to<br />
generating sales. We retreated from our previous stance<br />
where we had sought to outperform the market <strong>and</strong> took<br />
a more long term view of accepting slightly lower, but<br />
more sustainable growth in order to protect our gross<br />
margins from significant erosion.<br />
Improving the overall operating margin of the Group<br />
remains a priority <strong>and</strong> that has required us to maintain<br />
our focus on costs. Mindful that we do not want to<br />
damage the Group’s ability to take advantage of the<br />
market once it starts to improve we have proactively<br />
managed each business to achieve a gentle reduction<br />
of costs rather than undertaking wholesale cost cutting.<br />
Our priority has been to review all businesses to ensure<br />
they have the right cost structure for the business they<br />
are currently h<strong>and</strong>ling.<br />
Business model<br />
Our strategy is set out on page 14. The business model<br />
we deploy to execute that strategy is shown in the table<br />
on page 17.<br />
Operationally we measure our success through a<br />
comprehensive ‘balanced scorecard’ of key performance<br />
indicators (‘KPI’), which are aligned to achieving our<br />
strategy:<br />
2012 2011<br />
Like-for-like revenue change – General Merchanting 0.0% 9.3%<br />
Like-for-like revenue change – Specialist Merchanting 2.3% 11.5%<br />
Like-for-like revenue change – Consumer (5.6)% (1.3)%<br />
Like-for-like revenue change – P&H (1.6)% 3.4%<br />
Like-for-like revenue outperformance 1.4% 5.0%<br />
Colleague retention 84.0% 87.0%<br />
Revenue from expansion 2.8% 2.0%<br />
Health <strong>and</strong> safety – see separate report on pages 50 to 52. Environment – see separate report on pages 46 to 49.<br />
30
T R A V I S P E R K I N S A N N U A L R E P O R T A N D A C C O U N T S 2 0 1 2<br />
“Improving the overall operating margin of the<br />
Group remains a priority <strong>and</strong> that has required<br />
us to maintain our focus on costs.”<br />
2012 has not been a year for making large<br />
investments in new initiatives. We started the year<br />
determined to continue with a number of operational<br />
initiatives where we had already achieved improvements<br />
<strong>and</strong> could envisage further progress. We also wanted to<br />
ensure that any new investments either resulted in a<br />
rapid payback or were necessary to maintain progress<br />
toward our longer term strategies. As a result the main<br />
areas of focus have been:<br />
• Continuing our drive to eliminate accidents <strong>and</strong><br />
injuries from the Group;<br />
• Investigating <strong>and</strong> further improving our customer<br />
proposition;<br />
• Reducing the administrative burden on branch<br />
colleagues so they can spend more time with<br />
customers;<br />
• Generating additional purchasing <strong>and</strong> overhead<br />
synergies from the BSS acquisition <strong>and</strong> continuing<br />
with the integration of that business into the Group;<br />
• Leveraging our investment in our direct sourcing<br />
operations;<br />
• Dealing with the opportunities for improvement<br />
identified by our bi-enniel colleague engagement<br />
survey.<br />
Stay Safe<br />
Following the reorganisation of the group health <strong>and</strong><br />
safety team in 2012, which enables us to manage safety<br />
in a different way; we have invested a lot of energy <strong>and</strong><br />
resource into Stay Safe during the year. Full details are<br />
given on pages 50 to 52, but in summary we are intent<br />
on eliminating accidents <strong>and</strong> injuries <strong>and</strong> making<br />
everyone associated with our group fully underst<strong>and</strong> the<br />
role that we all play, <strong>and</strong> the responsibilities we all have,<br />
in maintaining a safety culture across all our locations.<br />
The training <strong>and</strong> culture journey for managers <strong>and</strong><br />
colleagues is the most critical part of winning hearts<br />
<strong>and</strong> minds to keep colleagues safe, <strong>and</strong> great progress<br />
has been made in engagement <strong>and</strong> in improving the<br />
communication process across the network.<br />
Sales <strong>and</strong> margin management<br />
We are set up to be the best whatever the market<br />
circumstances – in good times we take advantage<br />
to grow, in bad times we undertake the careful<br />
management of costs. In the current markets the<br />
approach our operators must take is to:<br />
• Focus on customers – manage our resources so we get<br />
the most out of what we have;<br />
• Concentrate on the quality of trading – review our<br />
trading stance to drive profit <strong>and</strong> ensure we are not<br />
letting the competition take our business;<br />
• Trust our central resources to deliver the right<br />
improvements that will enable branches to improve<br />
profitability.<br />
We pride ourselves on the service we provide to our<br />
customers, but we are not complacent <strong>and</strong> we recognise<br />
the need to continually improve. Our customer<br />
proposition team under the leadership of Norman<br />
Bell is working on a major project to look at how we<br />
REPORTS<br />
31
D E P U T Y C H I E F E X E C U T I V E ’ S R E V I E W O F T H E Y E A R<br />
can streamline our processes <strong>and</strong> make it easier for<br />
customers to deal with us. We are reviewing all aspects<br />
of our customer touch points from ease of opening a<br />
new trading account through to the simplification of our<br />
invoices <strong>and</strong> statements.<br />
We know that regular targeted communication with<br />
our customers helps build a relationship based on<br />
trust <strong>and</strong> can stimulate sales. We are looking at ways<br />
of improving our customer segmentation <strong>and</strong> from<br />
that how we can better inform our customers of our<br />
capabilities <strong>and</strong> then help them transact with the Group.<br />
The quality of our customer proposition is partly<br />
dependent upon product range availability <strong>and</strong> the<br />
services we provide. Our supply chain team’s mission<br />
is to make building materials supply ‘Easy’ for both<br />
branches <strong>and</strong> customers, their ‘Easy Supply of Products’<br />
(ESP) programme being a key pillar of the Group’s<br />
plans for growth <strong>and</strong> the continued development of its<br />
multichannel offer.<br />
Our new Chief Information Officer, JJ Van Oosten<br />
joined us mid year <strong>and</strong> undertook a fundamental review<br />
of our IT strategy <strong>and</strong> capability. Our strategically<br />
important multi-channel project is focussing on<br />
using alternative technology, with the result that our<br />
website redesign project continued, albeit at a slower<br />
pace during 2012. In 2013 the pace of multichannel<br />
developments will accelerate <strong>and</strong> the new site, which<br />
will allow customers to trade on-line, will be introduced<br />
into Wickes initially before being rolled out to our<br />
merchanting businesses.<br />
We are challenging the way building materials have<br />
traditionally been supplied to our businesses through<br />
collaborating with our suppliers. For example, we now<br />
have 12 colleagues from key suppliers implanted within<br />
the Group, working with us to create the best route to<br />
market for their products. As a result, our availability <strong>and</strong><br />
service offer with these suppliers continues to improve<br />
with customers more likely to source these suppliers’<br />
products through our branches.<br />
With the Group providing access to over 100,000<br />
products, sourced from over 10,500 suppliers, it is<br />
essential that the distribution infrastructure <strong>and</strong><br />
systems can support our branches <strong>and</strong> customers to<br />
complete their transactions <strong>and</strong> projects as quickly as<br />
possible, making them <strong>and</strong> the Group more profitable.<br />
The integration of BSS continues to progress well <strong>and</strong><br />
in most cases well ahead of expectations. The synergy<br />
program delivered a net £32m benefit versus the initial<br />
projection of £25m announced at the point of acquisition<br />
<strong>and</strong> the forecast of £30m at the end of last year.<br />
The implementation of the new PTS point of sale<br />
computer system (POS) has progressed very well during<br />
2012 with over 120 PTS branches, representing more<br />
than 50% of revenue, now being on the system. This will<br />
be a l<strong>and</strong>mark in PTS’ history as it will be the first time<br />
that each branch manager will have an unequivocal view<br />
of daily performance in real time. We plan to complete<br />
the PTS roll out by mid 2013 before transferring both<br />
BSS Industrial <strong>and</strong> F&P Wholesale to a version of the<br />
same system.<br />
The General Merchanting division has been targeting<br />
branches to improve the quality of orders taken <strong>and</strong><br />
the mix of products sold. It is currently piloting four<br />
regional customer centres designed to improve account<br />
management for our smaller customers <strong>and</strong> engineer<br />
opportunities to upsell.<br />
In August an improved search capability was<br />
launched on the General Merchanting website allowing<br />
customers to search <strong>and</strong> request quotes for over 9,000<br />
products on line. This is the start of a journey to improve<br />
our multi-channel offering, but it is already generating a<br />
good level of sales.<br />
Both Wickes <strong>and</strong> Tile Giant have improved their<br />
performance in 2012. Despite tough competition,<br />
both have increased their gross margins <strong>and</strong> overall<br />
profitability. Dropping Mycard in June allowed the<br />
Wickes team to invest some of the subsequent savings<br />
into selectively reducing prices.<br />
A lot of work has been undertaken to complete the<br />
integration of ten UGS branches into Keyline. We have<br />
invested in infrastructure, systems <strong>and</strong> stock availability<br />
to bring them up to the st<strong>and</strong>ard we expect of our<br />
branches <strong>and</strong> given our colleagues the tools they need to<br />
maximise their effectiveness.<br />
Our work on leveraging the strength of our own br<strong>and</strong><br />
products has continued. The popular Scruffs safety-wear<br />
range, supplied by Birchwood Price Tools, has replaced<br />
ranges previously stocked in Wickes <strong>and</strong> Travis Perkins;<br />
sales have exceeded our expectations.<br />
We have also invested in our geotechnics expertise<br />
having previously had a limited capability. On 3 October<br />
a new team joined us from a competitor <strong>and</strong> we look<br />
forward to exp<strong>and</strong>ing our presence in this increasingly<br />
important market.<br />
Tight cost control <strong>and</strong> asset management<br />
Group scale means we are able to develop solutions that<br />
can often be shared across multiple businesses <strong>and</strong><br />
markets, improving services, return on investment <strong>and</strong><br />
lowering cost. We undertake a large number of projects<br />
during the course of a year, each of which contributes<br />
to improving our operating margin. It is not possible to<br />
discuss all of them, but the following paragraphs set<br />
out details of some of the more significant changes we<br />
have made.<br />
In 2012 Keyline transferred responsibility for much<br />
branch administration to a central team based in<br />
Northampton. This freed up branch colleague time to<br />
enable them to focus on customers whilst improving<br />
the efficiency with which we deal with suppliers <strong>and</strong><br />
customers. In 2013 we will be taking a similar step in our<br />
General Merchanting division.<br />
Stephen Doody,<br />
Yard Supervisor<br />
at Keyline<br />
32
T R A V I S P E R K I N S A N N U A L R E P O R T A N D A C C O U N T S 2 0 1 2<br />
REPORTS<br />
33
D E P U T Y C H I E F E X E C U T I V E ’ S R E V I E W O F T H E Y E A R<br />
Our property department under the direction of<br />
Martin Meech is an important profit generating centre,<br />
but it also has an important part to play in controlling<br />
our cost base. Where possible we will look to exit leases<br />
if a branch is performing poorly <strong>and</strong> we can integrate<br />
the branch activity into a nearby branch. There are a<br />
number of opportunities in PTS <strong>and</strong> we believe that<br />
opportunities exist in respect of a number of Wickes<br />
properties as we target smaller 20,000 sq. ft. footprint<br />
stores to lower property costs. This will also allow us to<br />
open in previously unattractive locations that could not<br />
support larger stores.<br />
Supply chain continues to leverage our group<br />
distribution infrastructure. During the year we have<br />
transferred the:<br />
• Wickes bathroom home delivery operation in-house,<br />
without increasing our space footprint, which has<br />
improved service at the same time as reducing costs;<br />
• Moved our PTS radiator supply to an in-house<br />
solution, improving service <strong>and</strong> margins;<br />
• Provided our biggest customer, British Gas, with a<br />
supply chain for its insulation installation business.<br />
By selectively investing in GPS in our distribution<br />
vehicles to get a return we have been able to strengthen<br />
the management of our vehicle costs whilst also<br />
reducing our environmental impact.<br />
Our IT department is being restructured <strong>and</strong><br />
re-focused so we can reduce the costs of ‘keeping the<br />
lights on’ <strong>and</strong> divert more resource towards developing<br />
the IT infrastructure that will support the business on its<br />
strategic journey. One of the first changes will be moving<br />
from Microsoft to Google Enterprise allowing us to use<br />
new technologies to improve utilisation <strong>and</strong> efficiency.<br />
Improve return on capital<br />
We spend a considerable amount of time finding ways<br />
to improve our management of working capital. A lot<br />
of colleagues are involved in ensuring that we receive<br />
prompt payments from our customers. In 2012 we have<br />
piloted giving CCF drivers PDF devices that allow them to<br />
electronically process proof of delivery documents at the<br />
time of making the delivery. We are also developing our<br />
central cash allocation systems to reduce the time we<br />
spend dealing with receipts <strong>and</strong> to make it easier for our<br />
customers to manage their accounts.<br />
Achieving the balance between maintaining stock<br />
availability in nearly 2,000 outlets <strong>and</strong> controlling the<br />
value of stock in our balance sheet requires a great deal<br />
of skill. We continue to manage our branch m<strong>and</strong>ated<br />
stock <strong>and</strong> are currently considering making it more<br />
branch specific to reduce the level of slow moving stock<br />
that can accumulate from a one-size fits all approach.<br />
We are also seeking to improve the co-ordination<br />
of inventory reduction across the Group by sharing<br />
knowledge <strong>and</strong> best practice.<br />
We have developed <strong>and</strong> implemented i-Replen, a<br />
new automated stock ordering system for Wickes<br />
stores that improves availability reduces stock <strong>and</strong><br />
frees up management time. We believe that in due<br />
course this will help reduce Wickes stock without<br />
impacting availability.<br />
Our distribution infrastructure has been developed<br />
with a flexible approach <strong>and</strong> low levels of automation,<br />
to ensure that we can respond quickly to the rapidly<br />
changing service dem<strong>and</strong>s of the market, driven in part<br />
by the growth of multichannel business. The success of<br />
the model in improving sales, profitability <strong>and</strong> service<br />
means the business will open a further 650,000 sq. ft.,<br />
warehouse in Warrington in 2015 to support the Groups<br />
growth <strong>and</strong> multichannel ambitions. This investment<br />
will see the Group take a further step in improving<br />
service by providing access to more centralised products<br />
<strong>and</strong> reducing delivery lead times.<br />
External expansion<br />
With our aim of increasing our return on capital, we<br />
have been more selective when making investments<br />
to improve our proposition. At 31 December 2012 we,<br />
<strong>and</strong> our associate companies, operated from 1,896<br />
branches (including 12 Rinus Roofing <strong>and</strong> 5 Toolstation<br />
Netherl<strong>and</strong>s sites) a net increase of 28 during the year.<br />
We opened 48 new sites, 20 of which were for<br />
Toolstation where new branches rapidly achieve<br />
profitability <strong>and</strong> have an above group average return on<br />
incremental capital employed. We also closed 17 underperforming<br />
sites, 9 of which were in our plumbing <strong>and</strong><br />
heating division <strong>and</strong> sold 3 others.<br />
We now have tool-hire operations situated on 200 sites<br />
including 8 new implants for the commercial contract<br />
market in BSS Industrial branches. The dedicated teams<br />
installed in each of the BSS locations have delivered<br />
excellent service <strong>and</strong> sales <strong>and</strong> the number of customers<br />
using the service is ahead of projections. In 2013 further<br />
roll out of the offering is planned.<br />
Our managed services offering goes from strength<br />
to strength <strong>and</strong> we opened another 8 sites in 2012. Our<br />
record of winning more than our expected share of<br />
these opportunities continues as those tendering the<br />
contracts recognise the skills that we possess <strong>and</strong> the<br />
opportunities that will give them to improve their own<br />
profitability.<br />
Sales of spares grew by 11% year-on-year due to<br />
the good like-for-like performance from the existing<br />
plumbing <strong>and</strong> heating locations <strong>and</strong> the opening of<br />
new sites. We now operate from over 200 sites across<br />
the Group.<br />
We opened 39 new bathroom showrooms, 13 of<br />
which were in Travis Perkins General merchant sites<br />
<strong>and</strong> now have 51 showrooms in the Group with plans<br />
to continue the roll out in 2013. The new showroom<br />
concept, which has received excellent feedback from<br />
both trade customers <strong>and</strong> the retail customers of the<br />
34
T R A V I S P E R K I N S A N N U A L R E P O R T A N D A C C O U N T S 2 0 1 2<br />
“Developing highly skilled colleagues<br />
who can progress as our business grows<br />
is of paramount importance to us.”<br />
tradesmen, has resulted in significant sales growth <strong>and</strong><br />
improvements in product mix have been seen across the<br />
new network.<br />
People<br />
Our vision is to create a great place to work; one that is<br />
safe, rewarding <strong>and</strong> empowering <strong>and</strong> so we were pleased<br />
that for the third year running we were independently<br />
assessed to be one of Britain’s top employers.<br />
We employ over 23,400 people. Our customer insight<br />
work indicates that high levels of colleague engagement<br />
have a very positive impact on customer experience,<br />
both in terms of satisfaction <strong>and</strong> ratings of customer<br />
service. Therefore, seeking feedback from those<br />
colleagues is vital, especially when we face a challenging<br />
trading environment.<br />
In 2012 we undertook our biennial ‘You Talk We<br />
Listen’ employee survey in our head office locations,<br />
<strong>and</strong> our General <strong>and</strong> Specialist Merchanting <strong>and</strong> our<br />
Consumer divisions. 79% (2011: 63%) of colleagues<br />
responded with overall engagement scores increasing<br />
when compared with 2011. 84% of colleagues were<br />
proud to work in their location. Teams across the Group<br />
reviewed the results, then identified <strong>and</strong> implemented<br />
actions to address any issues.<br />
Developing highly skilled colleagues who can progress<br />
as our business grows is of paramount importance<br />
to us, so we work hard to support them throughout<br />
their career. In 2012 51% (2011: 44%) of management<br />
appointments were filled by internal c<strong>and</strong>idates.<br />
During 2012:<br />
• In partnership with Ashridge business school<br />
we delivered the ‘Horizons’ business leadership<br />
programme to 60 directors. It focused on leadership<br />
behaviours, business strategy <strong>and</strong> fostering<br />
collaboration across the Group;<br />
• Our branch managers were able to attend the 6 day<br />
‘Evolve’ management development programme which<br />
delivers leadership, sales <strong>and</strong> commercial modules.<br />
We provide a diverse range of development opportunities<br />
for all our colleagues ranging from practical job skills<br />
<strong>and</strong> product knowledge through to management <strong>and</strong><br />
leadership development. We also invest in training<br />
technology <strong>and</strong> during the year we launched iLearn.<br />
It is a platform, which enhances the online learning<br />
options available to all colleagues, whilst also providing<br />
technology to manage <strong>and</strong> record colleagues’ learning<br />
<strong>and</strong> development activity.<br />
Our commitment to apprenticeships continued<br />
with high levels of activity throughout the year. This<br />
commitment was supported by the development of<br />
our apprenticeship website, designed to attract young<br />
people into our business.<br />
The Travis Perkins Group ‘Building People’<br />
Apprenticeship scheme (which replaced our<br />
management trainee scheme in 2011) is aimed at<br />
attracting <strong>and</strong> developing the skills <strong>and</strong> knowledge<br />
of young people within our branch operations <strong>and</strong><br />
management roles. We hope that this new scheme<br />
will develop the same high quality future leaders <strong>and</strong><br />
managers that we see in our business today. There are<br />
two parts to the scheme:<br />
• The branch scheme is aimed at attracting those who<br />
are new to merchanting, with many joining as their<br />
first job;<br />
• The management apprenticeship scheme is focused<br />
on attracting talent from other merchanting branch<br />
networks, with apprentices’ development being<br />
accelerated through completion of the scheme.<br />
Over 30 apprentices graduated with a nationallyrecognised<br />
qualification during the year <strong>and</strong> a second<br />
tranche of 30 high calibre ‘Building People’ apprentices<br />
joined us during the autumn. We also have 500<br />
apprentices enrolled onto the Wickes Level Two Retail<br />
Apprenticeship Scheme.<br />
Sharing knowledge with our people is key to<br />
engagement so they can see, where we are going as a<br />
business, the part each of us plays in that journey, <strong>and</strong><br />
that we listen to what they are saying.<br />
Many of our br<strong>and</strong>s produce internal magazines<br />
<strong>and</strong> newsletters, so that everyone can see <strong>and</strong> better<br />
underst<strong>and</strong> what is happening across the Group.<br />
However, we have reviewed our internal <strong>and</strong> external<br />
communications activity this year <strong>and</strong> realised there is<br />
more we can do to raise awareness of the Travis Perkins<br />
Group as a whole.<br />
We have also appointed a Head of Corporate<br />
Communications to support the internal <strong>and</strong> employee<br />
REPORTS<br />
35
D E P U T Y C H I E F E X E C U T I V E ’ S R E V I E W O F T H E Y E A R<br />
“In 2013, we will continue to take a balanced<br />
view when managing sales, seeking to protect<br />
margin where necessary, but all the time<br />
ensuring that our costs are well controlled.”<br />
communications work already underway in our<br />
businesses. She will also identify areas to improve<br />
communication with new <strong>and</strong> existing audiences, <strong>and</strong><br />
so build our br<strong>and</strong> reputation <strong>and</strong> influence opinion in<br />
our sector.<br />
Our Save as You Earn (SAYE) scheme is a real success<br />
with 1,200 or 19% more colleagues, joining in 2012.<br />
It’s really encouraging that 7,500 (2011: 6,300) of our<br />
colleagues are keen to share in the success of the Group<br />
through the SAYE scheme, even when there are so many<br />
other dem<strong>and</strong>s on their money.<br />
Pension membership increased during the year as<br />
a result of our work to introduce a new pension plan<br />
which meets the government’s requirements for autoenrolment<br />
from March 2013. In total, at January 2013<br />
42% (2011: 27%) of our colleagues are now members of a<br />
group pension plan.<br />
Awards<br />
For the second year running the innovation, skills <strong>and</strong><br />
performance of our supply chain team <strong>and</strong> our Wickes<br />
distribution team were recognised during 2012. Between<br />
them, they were shortlisted for 5 awards of which they<br />
won four:<br />
• Hermes Retail Week – Supply Chain Leader of the Year<br />
was our group supply chain director Robin Proctor;<br />
• Hermes Retail Week – Multichannel Project of the<br />
Year Award went to the Wickes National Delivery<br />
Service.<br />
• Hermes Retail Week – Gr<strong>and</strong> Prix Award (Overall<br />
Winner) was also awarded to the Wickes National<br />
Delivery Service.<br />
• The European Supply Chain Excellence Awards –<br />
Public Sector was won jointly by British Gas <strong>and</strong> Travis<br />
Perkins for our collaboration project.<br />
In addition our marketing team won the ‘Best Use of<br />
Direct Marketing’ award at the Construction marketing<br />
awards in December. That was followed in February<br />
2013 by the team winning the award for ‘Best B2B’ for<br />
its customer lifestyle optimisation campaign at the Data<br />
Strategy Awards.<br />
Management changes<br />
There have been few changes in our senior management<br />
group during 2012.<br />
Chris Bosworth was appointed managing director of<br />
Group spares; a new role that will focus on the multichannel<br />
growth of spares across the Travis Perkins group.<br />
On 31 December 2012 Mo Iqbal left our business,<br />
six years after we purchased Tile Giant <strong>and</strong> he came<br />
on board to oversee its integration <strong>and</strong> expansion. Mo<br />
brought great expertise <strong>and</strong> knowledge to the Group<br />
<strong>and</strong> has had a huge influence in the success of our tile<br />
business. We wish him well in his new endeavours.<br />
Outlook<br />
I think it is important that I place on record my<br />
appreciation for the work undertaken by all colleagues<br />
in all our businesses <strong>and</strong> supporting functions. The<br />
success of our Group is founded on the quality <strong>and</strong> the<br />
commitment of people throughout our organisation.<br />
2012 has been another testing year for them, but once<br />
again, they have excelled. Early indications are that<br />
in the short term certainly, 2013 may be not be any<br />
better, but I know that colleagues will continue to deliver<br />
outst<strong>and</strong>ing results regardless of the circumstances.<br />
We have many initiatives underway to deliver<br />
improvements across the Group, some of which I have<br />
described in this report. In 2013, we will continue to take<br />
a balanced view when managing sales, seeking to protect<br />
margin where necessary, but all the time ensuring that<br />
our costs are well controlled. In that way we will continue<br />
to maximise the advantage of our operational gearing<br />
<strong>and</strong> so sustain our overall operating margin.<br />
John Carter<br />
Deputy Chief Executive<br />
John Williams,<br />
Warehouse<br />
Supervisor at CCF<br />
Birmingham<br />
36
T R A V I S P E R K I N S A N N U A L R E P O R T A N D A C C O U N T S 2 0 1 2<br />
REPORTS<br />
37
Finance Director’s<br />
Review of the Year<br />
FOR THE YEAR ENDED 31 DECEMBER 2012<br />
Paul Hampden Smith<br />
Finance Director<br />
Financial achievements<br />
2012 has been a year of consolidation as we have<br />
continued to manage our businesses so they are well<br />
positioned to take advantage of the opportunities that<br />
will arise when our markets start to improve. Our balance<br />
sheet is stronger, with lease adjusted net debt to adjusted<br />
EBITDAR reducing from 3.4 times to 3.2 times, our<br />
dividend up by 25% <strong>and</strong> in January 2013 we have secured<br />
a £50m increase in our medium term funding.<br />
Investment has been carefully targeted towards<br />
projects that give the best short-term returns, in<br />
particular Toolstation expansion, our focus on lowering<br />
debt has realised a further £155m reduction in<br />
underlying debt (before business acquisitions of £24m)<br />
<strong>and</strong> we have made significant progress on the BSS<br />
synergy <strong>and</strong> integration projects.<br />
Our operating margin has improved <strong>and</strong> we have<br />
maintained strong cost control; even though RPI<br />
annual inflation in 2012 was 3.1% we have reduced our<br />
like-for-like overheads by 2.3% whilst continuing to<br />
invest in the business.<br />
Financial performance<br />
The following table shows the Group’s key financial<br />
performance indicators:<br />
2012 2011<br />
Adjusted operating profit to revenue 6.7% 6.6%<br />
Group adjusted overheads to revenue 23.8% 23.6%<br />
Profit before tax growth 16.2% 37.0%<br />
Adjusted profit before tax growth 1.1% 36.9%<br />
Adjusted earnings per share 95.1p 93.1p<br />
Adjusted dividend cover 3.8x 4.7x<br />
Free cash flow (note 35) £242m £294m<br />
Lease adjusted net debt to adjusted EBITDAR (note 36) 3.2x 3.4x<br />
Adjusted pre-tax return on capital (note 37) 11.5% 11.3%<br />
38
T R A V I S P E R K I N S A N N U A L R E P O R T A N D A C C O U N T S 2 0 1 2<br />
“Investment has been carefully targeted<br />
towards projects that give the best short-term<br />
returns, in particular Toolstation expansion.”<br />
Financial results<br />
Changes in turnover, operating profit <strong>and</strong> operating<br />
margins have been discussed in the Chief Executive’s<br />
Review of the year.<br />
Net financing costs before exceptional charges<br />
have increased by £10m to £27m. The primary cause<br />
of the increase was £4m of mark-to-market losses<br />
(2011: £4m of gains) from revaluing forward currency<br />
contracts taken out during the course of the year to fix<br />
the exchange rate at which goods sourced in foreign<br />
currency will be purchased. In addition, as highlighted<br />
in last year’s report, putting in place the Group’s new<br />
borrowing facility increased interest costs by around<br />
£4m. The average interest rate during the year was 3.9%<br />
(2011: 3.0%).<br />
Pre-tax exceptional items of £31m were credited to<br />
the income statement (2011: debit £14m) during the<br />
year due to:<br />
• £15m (2011: £14m) of costs arising from the BSS<br />
integration programme, which continues to progress<br />
well;<br />
• Sub-letting several vacant retail sites, for which<br />
£6m of the exceptional onerous lease provisions,<br />
established in 2008, were released;<br />
• Applying the requirements of the International<br />
Financial <strong>Report</strong>ing St<strong>and</strong>ard relating to acquisitions,<br />
which resulted in a £36m non-taxable revaluation<br />
gain in respect of the Group’s 30% investment<br />
in Toolstation immediately prior to the Group’s<br />
acquisition of the remaining 70% of its shares;<br />
• Fair valuing the outst<strong>and</strong>ing consideration for<br />
Toolstation at the year-end resulted in a £4m credit to<br />
the income statement.<br />
After exceptional items, profit before tax, rose by £43m<br />
to £313m, a 16.2% increase (2011: £270m).<br />
The tax charge was £54m (2011: £57m). If the impact<br />
of the non-taxable exceptional items is excluded from<br />
profit before tax <strong>and</strong> the £13m (2011: £13m) exceptional<br />
deferred tax credit (caused by the 1% corporation tax<br />
rate reduction in April 2012) is ignored, the underlying<br />
tax charge was £69m (2011: £75m). That represents<br />
an effective rate of 24.5% (2011: 26.5%). We expect our<br />
corporation tax rate to reduce further in the coming<br />
years in line with government announced falls in the<br />
statutory tax rate to 23.25% in 2013, 21.5% in 2014<br />
<strong>and</strong> 21.0% in 2015. The reduction in the effective rate<br />
from last year reflects the drop in the statutory tax rate<br />
during the year.<br />
Basic earnings per share were 20.6% higher at 108.9<br />
pence (2011: 90.3 pence). Adjusted earnings per share<br />
(note 11) were 95.1 pence (2011: 93.1 pence). There<br />
is no significant difference between basic <strong>and</strong> diluted<br />
earnings per share <strong>and</strong> between adjusted <strong>and</strong> diluted<br />
adjusted earnings per share.<br />
Capital employed <strong>and</strong> balance sheet<br />
Our balance sheet remains strong with over £2bn of net<br />
assets <strong>and</strong> once again our calculations show there were<br />
no impairments to the carrying values of goodwill <strong>and</strong><br />
other intangible assets. Across the Group, our operating<br />
REPORTS<br />
39
F I N A N C E D I R E C T O R ’ S R E V I E W O F T H E Y E A R<br />
assets continue to be highly cash <strong>and</strong> profits generative.<br />
Capital employed at the end of 2012 was £2,308m<br />
(2011: £2,108m). The Group’s adjusted pre-tax return<br />
on capital for the year was 11.5%, (2011: 11.3%), which<br />
continues to be above our weighted average cost of<br />
capital (‘WACC’).<br />
During the year, the daily closing share price ranged<br />
between 794p (2011: 711p) <strong>and</strong> 1,149p (2011: 1,127p).<br />
The shares closed the year at a price of 1,088p (2011:<br />
796p), increasing the Group’s market capitalisation<br />
over the year by 37% to £2.66bn (2011 £1.94bn). This<br />
represented 1.2 times shareholders funds (31 December<br />
2011: 0.9 times).<br />
Extracting value from our business assets<br />
The Group’s property team has continued to make an<br />
important contribution to group profits by realising<br />
£15m of gains (2011: £16m) from 10 projects. The largest<br />
contribution came from the St Pancras development,<br />
the contract for which became unconditional in July.<br />
Property disposals realised £30m of cash in 2012, but<br />
a further £9m of proceeds on the St Pancras deal does<br />
not fall due, <strong>and</strong> so will not be recognised, until the<br />
development is completed.<br />
At the year-end, the carrying value of our freehold<br />
<strong>and</strong> long leasehold property portfolio was £287m (2011:<br />
£285m).<br />
Pension fund performance<br />
At 31 December 2012 the combined accounting net<br />
deficit of the Group’s defined benefit pension schemes<br />
was £45m (2011: £34m), which represents an £11m<br />
worsening over the course of the year. The Travis<br />
Perkins final salary pension scheme has a surplus of<br />
£2m (2011: £19m), whilst the aggregate gross deficits<br />
on the two BSS related defined benefit schemes totalled<br />
£59m (2011: £65m).<br />
Positive influences on the gross deficit in the year<br />
were due to:<br />
• Returns on scheme assets exceeding expectations by<br />
£28m due to strong equity performance;<br />
• The impact of changes in inflation which reduced the<br />
combined deficit by around £12m;<br />
• £23m of excess contributions <strong>and</strong> £11m of other<br />
finance income.<br />
Two factors had an adverse effect on the combined<br />
deficit:<br />
• A 0.3% reduction in the discount rate to 4.6%, which<br />
reflects another year of falling yields on high quality<br />
corporate bonds, has increased the deficit by £61m;<br />
• The allowance for scheme experience between the<br />
2008 actuarial valuation <strong>and</strong> the 2011 actuarial<br />
valuation of the Travis Perkins scheme impacted the<br />
deficit by £21m;<br />
The triennial valuation of the Travis Perkins defined<br />
benefit scheme for September 2011 was finalised during<br />
the year. The future service contribution rate has been<br />
increased to 13.1% (previously 11.5%) of pensionable<br />
salaries. In addition, the employing companies have<br />
agreed to increase their annual combined deficit cash<br />
contribution by £2m to £15m backdated to September<br />
2011. Future deficit contributions will increase, although<br />
not significantly, if the Company’s investment rating<br />
changes or dividends rise above a pre-agreed limit.<br />
The triennial valuation of the BSS defined benefit<br />
scheme as at 1 June 2012 has been agreed with the<br />
Trustees. The future service contribution rate, based<br />
on the projected unit approach is 10.3%. In order to<br />
eliminate the deficit, additional payments of £10m per<br />
annum will be made over the ten years to May 2022.<br />
Having finalised the triennial actuarial valuations of<br />
the Travis Perkins <strong>and</strong> the BSS Group defined benefit<br />
schemes, the cash contribution to reduce the combined<br />
deficits will increase by £5m in 2013 to £28m before<br />
reducing to £26m thereafter.<br />
In 2013 we will apply the new requirements of<br />
IAS 19, the accounting st<strong>and</strong>ard on pensions, for the<br />
first time. This will result in other finance income (a<br />
non-cash item) in the income statement reducing by<br />
approximately £12m.<br />
Continued focus on debt reduction<br />
Net debt was £131m lower than the previous year-end<br />
at £452m (2011: £583m) as a result of a continuing<br />
focus on capital investment <strong>and</strong> working capital<br />
management. Free cash flow for the year was £242m<br />
(2011: £294m) (note 35), lower than 2011 partly as a<br />
result of not repeating the prior year tax cash benefit<br />
from the BSS acquisition.<br />
Gross capital <strong>and</strong> investment expenditure totalled<br />
£110m (2011: £121m). £54m (2011: £55m) was spent<br />
on capital replacements, <strong>and</strong> £56m (2011: £66m) on<br />
expansion.<br />
The peak <strong>and</strong> minimum levels of daily borrowings on<br />
a cleared basis during the year ended 31 December 2012<br />
were £827m <strong>and</strong> £468m respectively (2011: £949m <strong>and</strong><br />
£597m). The maximum month end cleared borrowings<br />
were £682m (2011: £867m).<br />
Toolstation<br />
On the 3 January 2012 the Group acquired the<br />
remaining 70% of the issued share capital of Toolstation<br />
Limited for an initial £24m with additional <strong>and</strong> final<br />
consideration becoming payable in early 2014 based<br />
upon the performance <strong>and</strong> expansion of the business in<br />
the year ending 31 December 2013.<br />
After taking into account the requirements of the<br />
purchase <strong>and</strong> sale agreement the cash payment in<br />
2014 is currently expected to be £51m. This acquisition<br />
resulted in goodwill of £103m being recognised in the<br />
balance sheet during 2012.<br />
Financial capital management<br />
Strong financial capital management is a fundamental<br />
component of the overall group strategy.<br />
The Directors are committed to the generation of<br />
Wickes<br />
Kettering<br />
40
T R A V I S P E R K I N S A N N U A L R E P O R T A N D A C C O U N T S 2 0 1 2<br />
REPORTS<br />
41
F I N A N C E D I R E C T O R ’ S R E V I E W O F T H E Y E A R<br />
long-term shareholder value, which we believe will be<br />
achieved through:<br />
• Increasing the Group’s market share via a<br />
combination of LFL sales growth <strong>and</strong> targeted<br />
expansion through acquisitions, brown field openings<br />
<strong>and</strong> in-store development;<br />
• Investing in projects <strong>and</strong> acquisitions where the<br />
post-tax return on capital employed exceeds the<br />
weighted average cost of capital of the Group;<br />
• Generating sufficient free cash flow to enable the<br />
Group to exp<strong>and</strong> its operations whilst funding<br />
attractive returns to shareholders <strong>and</strong> reducing its<br />
debt <strong>and</strong> pension deficit;<br />
• Operating an efficient balance sheet, by structuring<br />
sources of capital to minimise the Group’s weighted<br />
average cost of capital consistent with maintaining<br />
an investment grade financial profile. On a lease<br />
adjusted basis this would mean a ratio of net debt <strong>and</strong><br />
capitalised operating leases to EBITDAR would be less<br />
than three times (31 December 2012: 3.2 times);<br />
• Maintaining long-term adjusted dividend cover at<br />
between two <strong>and</strong> a half <strong>and</strong> three <strong>and</strong> a half times<br />
earnings (2012: 3.8 times).<br />
The Group maintains a capital structure that is both<br />
appropriate to the on-going needs of the business <strong>and</strong><br />
ensures it remains within the covenant limits that apply<br />
to its banking arrangements.<br />
The capital structure is formally reviewed by the Board<br />
as part of its annual strategy review, but it is kept under<br />
review by me throughout the year. As necessary, the<br />
Company will rebalance its capital structure by raising or<br />
repaying debt, issuing equity or paying dividends.<br />
The Group’s capital structure is intended to balance<br />
equity <strong>and</strong> debt in a way, which comfortably retains<br />
the Group’s investment grade status, maintains the<br />
financial flexibility for business development <strong>and</strong><br />
optimises the efficiency of its finance costs given that<br />
the cost of debt is below the cost of equity. This equates<br />
to a maximum lease adjusted net Debt / EBITDAR<br />
target of sub 3 times ratio.<br />
The current preferred capital structure of the Group<br />
consists of debt, which includes the bank borrowings<br />
<strong>and</strong> the US private placement notes, cash <strong>and</strong> cash<br />
equivalents <strong>and</strong> equity attributable to equity holders<br />
of the parent, comprising issued capital, reserves <strong>and</strong><br />
retained earnings. However, the Board regularly reviews<br />
the sources of debt available to the Group with the aim<br />
of maintaining both diversified sources <strong>and</strong> diversified<br />
maturities.<br />
The Group is also party to a large number of leases,<br />
most of which relate to premises occupied by the Group<br />
for trading purposes. Note 30 gives further details<br />
about the Group’s operating lease commitments. At 31<br />
December 2012, the annual rent roll for leased properties<br />
was approximately £189m. Our aim is to maintain a<br />
ratio approximating to 20% of properties owned, 80%<br />
leased, by value.<br />
The capital structure of the Group at 31 December<br />
comprised:<br />
2012 2011<br />
£m £m<br />
Cash <strong>and</strong> cash equivalents 139 79<br />
Bank loans (264) (323)<br />
US private placement notes at fair value (261) (279)<br />
Loan notes (3) (3)<br />
Finance leases (26) (20)<br />
Liability to pension scheme (37) (37)<br />
Pension fund deficit (45) (34)<br />
Equity attributable to shareholders (2,308) (2,108)<br />
Total balance sheet capital employed (2,805) (2,725)<br />
Operating leases (8x property rentals) (1,512) (1,408)<br />
Total capital employed (4,317) (4,133)<br />
Liquidity <strong>and</strong> funding<br />
In addition to its equity, the Group is financed through<br />
a combination of unsecured bank borrowings <strong>and</strong><br />
unsecured guaranteed private placement notes at<br />
fixed <strong>and</strong> floating rates of interest. The Board regularly<br />
reviews the facilities available <strong>and</strong> seeks to maintain<br />
them at a level sufficient to facilitate execution of its<br />
strategy, whilst ensuring that liquidity headroom will<br />
cover reasonably possible contingencies.<br />
At 31 December 2012, the Group had a committed<br />
UK bank facility of £739m <strong>and</strong> $400m of $US private<br />
placement notes in issue. In addition, it had £40m of<br />
uncommitted overdraft facilities. The UK bank facility<br />
expires in April 2013 when it will be replaced by a<br />
£550m revolving credit facility advanced by a syndicate<br />
of 10 banks, which runs until December 2016.<br />
Since the year-end, there have been several changes<br />
to the Group’s debt facilities. On 26 January 2013,<br />
7 years after they were issued, $200m of US senior<br />
notes fell due for repayment. The Board has decided<br />
not to issue replacement notes for the time being, so,<br />
to increase the Group’s liquidity headroom, it entered<br />
into a new £50m bilateral committed revolving credit<br />
facility of fifteen-months duration. In addition, to<br />
reduce excess liquidity headroom on its existing<br />
syndicated loan facility £50m was prepaid two months<br />
early. As a result of these changes borrowing costs have<br />
been reduced.<br />
The remaining $200m of funding from US senior<br />
notes, which is available until January 2016, together<br />
with the existing committed bilateral <strong>and</strong> syndicated<br />
bank facilities provide the Group with the liquidity it<br />
requires for the foreseeable future.<br />
At 31 December 2012, the Group had undrawn<br />
committed facilities of £475m (2011: £475m). The<br />
maturity profile of the Group’s facilities is as follows:<br />
42
T R A V I S P E R K I N S A N N U A L R E P O R T A N D A C C O U N T S 2 0 1 2<br />
Committed facilities available at the year-end £m<br />
January 2013 (fully drawn) 126<br />
April 2013 (£264m drawn) 739<br />
January 2016 (fully drawn) 135<br />
Committed facilities at 31 December 2012 1,000<br />
Known changes in 2013<br />
January 2013 repayment (126)<br />
New facility committed to March 2014 50<br />
April 2013 repayment (739)<br />
New facility committed to December 2016 550<br />
Committed facilities from 4 April 2013 735<br />
Effective financial risk management<br />
The overall aim of the Group’s financial risk<br />
management policies is to minimise potential adverse<br />
effects on financial performance <strong>and</strong> net assets. The<br />
Group manages the principal financial risks within<br />
policies <strong>and</strong> operating parameters approved by the<br />
Board of Directors <strong>and</strong> does not enter into speculative<br />
transactions. Treasury activities, which fall under my<br />
day-to-day responsibilities, are managed centrally under<br />
a framework of policies <strong>and</strong> procedures approved by <strong>and</strong><br />
monitored by the Board.<br />
The Group’s policy is to enter into derivative contracts<br />
only with members of its UK banking facility syndicate,<br />
provided such counterparties meet the minimum rating<br />
set out in the Board approved derivative policy.<br />
The Group’s hedging policy is to generate its preferred<br />
interest rate profile, <strong>and</strong> so manage its exposure<br />
to interest rate fluctuations, by using interest rate<br />
derivatives. Currently the policy is to maintain between<br />
33% <strong>and</strong> 75% of drawn borrowings at fixed interest rates.<br />
The Group has entered into a number of interest<br />
rate derivatives designed to protect it from fluctuating<br />
interest <strong>and</strong> exchange rates on its borrowings. At<br />
the year-end, the Group had £175m notional value<br />
of interest rate derivatives fixing interest rates on<br />
approximately 39% (2011: 38%) of the Group’s cleared<br />
gross debt (before cash <strong>and</strong> cash equivalents). In total<br />
53% (2011: 66%) of the Group’s gross debt is at fixed<br />
interest rates.<br />
The Group settles its currency related trading<br />
obligations using a combination of currency purchased<br />
at spot rates <strong>and</strong> currency bought in advance on forward<br />
contracts. Its policy is to purchase forward contracts for<br />
between 30% <strong>and</strong> 70% of its anticipated requirements<br />
twelve months forward. At 31 December 2012 the<br />
nominal value of currency contracts, all of which were<br />
$US denominated, was $113m.<br />
To protect itself against adverse currency movements<br />
<strong>and</strong> enable it to achieve its desired interest rate profile,<br />
the Group has entered into 4 cross currency swaps <strong>and</strong> 4<br />
forward contracts in respect of its $400m of $US private<br />
placement notes.<br />
In summary, the key points of our financial risk<br />
management strategy are that we:<br />
• Seek to maintain a strong balance sheet;<br />
• Accord top priority to effective cash <strong>and</strong> working<br />
capital management;<br />
• Maintain borrowing facility liquidity headroom of<br />
over £100m <strong>and</strong> continue good relationships with our<br />
bankers;<br />
• Manage counterparty risk by raising funds from a<br />
syndicate of lenders, the members of which maintain<br />
investment grade credit ratings;<br />
• Operate within comfortable margins to our banking<br />
covenants:<br />
• The ratio of net debt to EBITDA (earnings before<br />
interest, tax depreciation <strong>and</strong> amortisation) has to<br />
be lower than 3.0; it was 0.95 at the year-end (note<br />
36); <strong>and</strong><br />
• The number of times operating profit covers<br />
interest charges has to be a least 3.5 times <strong>and</strong> it<br />
was 13.1 times at 31 December 2012.<br />
• Have a conservative hedging policy that reduces<br />
the Group’s exposure to currency <strong>and</strong> interest rate<br />
fluctuations.<br />
Going concern<br />
After reviewing the Group’s forecasts <strong>and</strong> risk<br />
assessments <strong>and</strong> making other enquiries, the Directors<br />
have formed a judgement at the time of approving<br />
the financial statements, that there is a reasonable<br />
expectation that the Group <strong>and</strong> the Company have<br />
adequate resources to continue in operational existence<br />
for the foreseeable future. For this reason, they continue<br />
to adopt the going concern basis in preparing the<br />
financial statements.<br />
In arriving at their opinion the Directors considered<br />
the:<br />
• Group’s cash flow forecasts <strong>and</strong> revenue projections;<br />
• Reasonably possible changes in trading performance;<br />
• Committed facilities available to the Group to late<br />
2016 <strong>and</strong> the covenants thereon;<br />
• Group’s robust policy towards liquidity <strong>and</strong> cash flow<br />
management; <strong>and</strong><br />
• Group management’s ability to successfully manage<br />
the principal risks <strong>and</strong> uncertainties outlined on<br />
pages 44 <strong>and</strong> 45 during periods of uncertain economic<br />
outlook <strong>and</strong> challenging macro economic conditions.<br />
Paul Hampden Smith<br />
Finance Director<br />
REPORTS<br />
43
Statement of Principal<br />
Risks <strong>and</strong> Uncertainties<br />
FOR THE YEAR ENDED 31 DECEMBER 2012<br />
A number of factors affect the operating results,<br />
financial condition <strong>and</strong> prospects of each of the<br />
businesses in the Travis Perkins Group. This section<br />
describes the risk factors that are considered by the<br />
Directors to be material, their potential impacts <strong>and</strong> the<br />
factors that mitigate them. However, these should not be<br />
regarded as a complete <strong>and</strong> comprehensive statement<br />
of all potential risks <strong>and</strong> uncertainties. Additional risks<br />
<strong>and</strong> uncertainties that are not presently known to the<br />
Directors, or which they currently deem immaterial,<br />
may also have an adverse effect on the Group’s operating<br />
results, financial condition or prospects.<br />
RISK DESCRIPTION<br />
Market conditions<br />
The Group’s products are sold to<br />
tradesmen <strong>and</strong> retail customers for a<br />
broad range of end uses in the built<br />
environment. The performance of the<br />
market is affected by general economic<br />
conditions <strong>and</strong> a number of specific<br />
drivers of construction <strong>and</strong> DIY activity,<br />
including housing transactions, net<br />
disposable income, house price inflation,<br />
consumer confidence, interest rates <strong>and</strong><br />
unemployment.<br />
IMPACT<br />
D<strong>IR</strong>ECTION<br />
Adverse<br />
effect on<br />
financial<br />
results.<br />
RISK MITIGATION<br />
The Board conducts an annual review of strategy, which includes an<br />
assessment of likely competitor activity, market forecasts <strong>and</strong> possible<br />
future trends in products, channels of distribution <strong>and</strong> customer<br />
behaviour.<br />
The Group maintains a comprehensive tracking system for lead<br />
indicators that influence the market for the consumption of building<br />
materials in the UK.<br />
Significant events including those in the supply chain that may affect<br />
the Group are monitored by the Executive Committee <strong>and</strong> reported to<br />
the Board monthly by the Group Chief Executive.<br />
Competitive pressures<br />
Market trends, particularly in respect of<br />
customers’ preferences for purchasing<br />
materials through a range of supply<br />
channels <strong>and</strong> not just through our<br />
traditional competitors may affect the<br />
Group’s performance so making traditional<br />
branch based operations less relevant.<br />
Public sector buying groups could reduce<br />
sales if public bodies chose to buy direct<br />
from the manufacturers.<br />
Disintermediation may become more of<br />
a threat if manufacturers decide to deal<br />
directly with the end user.<br />
Adverse<br />
effect on<br />
financial<br />
results.<br />
Changes to market practice are tracked on an on-going basis <strong>and</strong> reported<br />
to the Board each month.<br />
We are building our multi-channel capabilities so they compliment our<br />
existing operations <strong>and</strong> provide our customers with the opportunity to<br />
transact with the group as they wish.<br />
The Group is leading the industry in terms of the development of new<br />
<strong>and</strong> innovative supply solutions, <strong>and</strong> works closely with customers <strong>and</strong><br />
suppliers on a programme of continuous improvement of current models.<br />
We continue to refine our pricing strategies to ensure we retain our<br />
competitiveness.<br />
The Group’s br<strong>and</strong>ing strategy allows it to use sites flexibly. Alternative<br />
space utilisation models are possible, including maintaining smaller<br />
stores <strong>and</strong> implanting additional services into existing branches.<br />
Information technology<br />
The operations of the Group depend<br />
on a wide range of complex IT systems<br />
operating efficiently <strong>and</strong> effectively.<br />
The rapid expansion of the Group together<br />
with an increasing dem<strong>and</strong> for IT services,<br />
particularly as we embrace modern <strong>and</strong><br />
future platforms such as multi-channel,<br />
could result in development programmes<br />
being delayed.<br />
Increasing levels of cyber crime represent<br />
a significant threat with the potential<br />
to cause loss of system availability or<br />
financial loss.<br />
Adverse<br />
effect on<br />
financial<br />
results.<br />
Adverse<br />
effect on the<br />
Company’s<br />
reputation.<br />
The strategic dem<strong>and</strong>s of the business, resources available to IT,<br />
performance levels of key systems <strong>and</strong> IT security are kept under review<br />
by the Executive Committee.<br />
Maintenance is undertaken on an on-going basis to ensure the resilience<br />
of group systems, with escalation procedures operating to ensure any<br />
performance issues are resolved at an early stage. Our three data centres<br />
mirror each other with data processing switched from one to the other on<br />
a regular basis. An IT disaster recovery plan exists <strong>and</strong> is tested regularly<br />
together with the business continuity plan with arrangements in place<br />
for alternative data sites for both trade <strong>and</strong> consumer businesses. Off-site<br />
back-up routines are in place.<br />
44
T R A V I S P E R K I N S A N N U A L R E P O R T A N D A C C O U N T S 2 0 1 2<br />
RISK DESCRIPTION<br />
Colleague recruitment, retention <strong>and</strong> succession<br />
IMPACT<br />
D<strong>IR</strong>ECTION<br />
RISK MITIGATION<br />
Many colleagues have worked for the Group for some<br />
considerable time during which they have gained valuable<br />
knowledge <strong>and</strong> expertise.<br />
The ability to recruit, retain <strong>and</strong> motivate suitably qualified<br />
staff is an important driver of the Group’s overall performance.<br />
Ensuring succession for key positions throughout the Group is<br />
important if it is to continue to be successful in the future.<br />
Avoiding ‘recession fatigue’ amongst our key management<br />
layers <strong>and</strong> ensuring a continuous flow of innovation in the<br />
Group.<br />
Supplier dependency <strong>and</strong> direct sourcing<br />
The Group is the largest customer of many of its suppliers.<br />
In some cases, those suppliers are large enough to cause<br />
significant difficulties to the Group if they become unable to<br />
meet their supply obligations.<br />
Alternative sourcing is available, but the volumes required <strong>and</strong><br />
the time it may take those suppliers to increase production<br />
could result in significant stock-outs for some considerable<br />
time.<br />
We have rapidly exp<strong>and</strong>ed our direct sourcing capabilities,<br />
which has increased the Group’s reliance on overseas factories<br />
producing product. This increases the Group’s exposure to<br />
sourcing, quality, trading, warranty <strong>and</strong> currency issues.<br />
Potential for European anti-dumping legislation to be extended<br />
to cover further Asian countries so increasing the cost of some<br />
imported products.<br />
Inability to<br />
develop <strong>and</strong><br />
execute our<br />
development<br />
plans.<br />
Competitive<br />
disadvantage.<br />
Adverse<br />
effect on<br />
financial<br />
results.<br />
Adverse<br />
effect on the<br />
Company’s<br />
reputation.<br />
The Group Human Resources Director monitors<br />
staff engagement <strong>and</strong> turnover by job type <strong>and</strong><br />
reports to the Executive Committee regularly<br />
<strong>and</strong> to the Board annually. Succession plans are<br />
established for the most senior positions within the<br />
Group <strong>and</strong> these are reviewed annually.<br />
Our reward <strong>and</strong> recognition systems are actively<br />
managed to ensure high levels of employee<br />
engagement.<br />
A wide-range of training programmes are in<br />
place to encourage staff development, whilst<br />
management development programmes are used<br />
to assist those identified for more senior positions.<br />
Salaries <strong>and</strong> other benefits are benchmarked<br />
annually to ensure that the Group remains<br />
competitive.<br />
The commercial <strong>and</strong> financial teams monitor the<br />
financial position of the Group’s key suppliers.<br />
Where possible, contracts exist with more than one<br />
supplier for key products.<br />
The Group has made a significant investment in<br />
a new Far East infrastructure to support its direct<br />
sourcing operation.<br />
Comprehensive checks are undertaken on the<br />
factories producing product, the quality <strong>and</strong><br />
suitability of that product before it is shipped to<br />
the UK.<br />
REPORTS<br />
Defined benefit pension scheme funding<br />
The Group is required by law to maintain a minimum funding<br />
level in relation to its on-going obligations to provide current<br />
<strong>and</strong> future pensions for members of its pension schemes who<br />
are entitled to defined benefits.<br />
Some issues could adversely affect the funding of these<br />
obligations including poor performance of the pension fund<br />
investments <strong>and</strong> increasing longevity of pension scheme<br />
members.<br />
The level of contributions required from the Group to meet<br />
the benefits promised in the final salary schemes will vary<br />
depending upon the funding position of those schemes.<br />
Adverse<br />
effect on<br />
financial<br />
condition.<br />
All of the Group’s final salary pension schemes are<br />
closed to new members.<br />
For the Travis Perkins scheme, pensionable salary<br />
inflation has been capped at 3% per annum.<br />
The scheme’s investment policy is kept under<br />
regular review to ensure asset profiles are kept in<br />
line with the profile of liabilities.<br />
45
Environmental <strong>Report</strong><br />
FOR THE YEAR ENDED 31 DECEMBER 2012<br />
Introduction<br />
In 2012, we were awarded Retro Expo’s Outst<strong>and</strong>ing<br />
Achievement Award in recognition of the positioning<br />
work we have done to ensure we take advantage of the<br />
low carbon construction economy. We have set targets<br />
for 2020 <strong>and</strong> have invested to improve our analysis of<br />
our supply chain carbon opportunities <strong>and</strong> liabilities.<br />
The environmental impact of all group activities is<br />
included in this report.<br />
Process improvements <strong>and</strong> outside influences<br />
Management systems<br />
The Group’s certified Environmental Management System<br />
now covers BSS <strong>and</strong> PTS, but does not yet fully cover<br />
Toolstation or businesses not wholly owned by the Group.<br />
The strategic management of our environmental<br />
approach was improved in 2012 by adopting key<br />
environmental metrics <strong>and</strong> targets out to 2020. We<br />
regard responsible operations as both important <strong>and</strong><br />
financially prudent. Our zero waste to l<strong>and</strong>fill ambition<br />
has been transposed to a 2017 target. By 2020, we<br />
expect to reduce our carbon dioxide intensity by 48%.<br />
The effect of the law<br />
What we do, <strong>and</strong> how we do it, is partially a response<br />
to regulatory drivers. We estimate that it costs us<br />
£2.2 million in direct fees to comply with current<br />
environmental regulations. We have increased our<br />
direct advocacy <strong>and</strong> interest in industry bodies like the<br />
Construction Products Association (CPA), British Retail<br />
Consortium (BRC) <strong>and</strong> the Green Building Council (GBC)<br />
so we can help achieve better regulation.<br />
Opportunities from environmental regulation such as<br />
The Green Deal, which officially launched on January 28<br />
2013, have yet to materialise – however, we expect this<br />
to build gradually as consumers become more informed.<br />
Travis Perkins <strong>and</strong> our Green Deal Provider Partner,<br />
Toriga, were among the first organisations to create an<br />
approved Green Deal Plan. The Travis Perkins Toriga<br />
Green Deal proposition will allow customers to gain<br />
access to this growing market opportunity as it develops<br />
over the coming years.<br />
The effect of stakeholder views<br />
In 2012, excluding regular support for our contractor<br />
customers tendering activities <strong>and</strong> routine dialogue<br />
with WWF, CPA, BRC, GBC or our own environmental<br />
advisory bodies, we spoke to approximately 200 people<br />
or organisations about our environmental approach.<br />
Regrettably, 28 of these (30 in 2011) were complaints.<br />
We recognise that from time to time conflicts can arise<br />
with neighbours, or we will have supplied materials<br />
customers regard as lacking environmental credentials.<br />
On each occasion we seek to listen, react <strong>and</strong> agree<br />
changes where possible.<br />
Encouragingly, we had a positive engagement with<br />
investors in 2012 about our environmental approach<br />
<strong>and</strong> this has improved the level of disclosure in this<br />
report. Wherever possible, we now include absolute<br />
levels of emissions or consumption <strong>and</strong> an indicator<br />
stating the level of measured versus estimated data.<br />
Our strategic priorities, themes <strong>and</strong> objectives<br />
are formally reviewed regularly against solicited<br />
or unsolicited commentary we receive about our<br />
environmental approach along with the feedback from<br />
our Non Executive Environmental Advisory Panel. We<br />
believe this makes our approach more effective <strong>and</strong><br />
closer to stakeholder expectations.<br />
What we report<br />
For the 2013 calendar year we will report under the<br />
proposed Green House Gas m<strong>and</strong>atory reporting rules<br />
<strong>and</strong> restate comparatives to ensure consistency. For 2012<br />
data we reviewed the calculations of our metrics, which<br />
are produced by combining measured, estimated <strong>and</strong><br />
extrapolated data, but did not materially change them.<br />
We have increased our content of environmental<br />
information on the Web <strong>and</strong> in other publications <strong>and</strong><br />
have continued to have this report <strong>and</strong> its contents<br />
verified by Lloyds Register of Quality Assurance. A copy<br />
of the verification statement is downloadable from the<br />
Travis Perkins plc. environment web pages.<br />
Buying Responsibly<br />
Timber <strong>and</strong> timber products<br />
In 2012, we estimate that 90% by value of the timber<br />
<strong>and</strong> timber products purchased by the Group was from<br />
certified well managed or controlled forests.<br />
Over 85% of the timber data comes from our central<br />
sales records, with the remaining estimated.<br />
All centrally purchased major timber product groups<br />
are either fully certified or a plan for full certification<br />
is underway. By Q2 of 2013, all materials we import<br />
Wickes<br />
Call Centre<br />
Brackmills<br />
46
T R A V I S P E R K I N S A N N U A L R E P O R T A N D A C C O U N T S 2 0 1 2<br />
REPORTS<br />
47
E N V I R O N M E N T A L R E P O R T<br />
directly from outside of the EU, which are the focus<br />
of the EU timber regulations (EUTR), will have the<br />
assurance of full chain of custody from credible<br />
certification schemes.<br />
However, we are now faced with the prospect of<br />
considerable supply uncertainty <strong>and</strong> significant<br />
upheaval to our internal processes as the certification<br />
bodies adapt from being a voluntary label of<br />
environmental quality to a compliance tool under the<br />
EUTR. Whilst we are confident the change will happen,<br />
the timing <strong>and</strong> requirements are unclear, <strong>and</strong> therefore<br />
we have chosen not to engage with colleagues <strong>and</strong> local<br />
suppliers until we can communicate clear expectations.<br />
This engagement is vital to achieve <strong>and</strong> sustain full<br />
certification with 10% of timber still specified <strong>and</strong><br />
purchased locally by our merchant branch managers.<br />
We have therefore reluctantly concluded that, given the<br />
short amount of time remaining, we will not achieve<br />
100% certified timber <strong>and</strong> timber product purchases<br />
by 2014 as we had hoped. Our new target for 2014 is to<br />
purchase 95% of timber <strong>and</strong> timber products by value<br />
from credibly certified well managed or controlled<br />
wood sources.<br />
Resource efficiency<br />
In 2012, we continued to source products with recycled<br />
content <strong>and</strong> worked with our suppliers to reduce<br />
packaging. Wickes has achieved the 15% packaging<br />
reduction target under the WRAP Home Improvement<br />
Sector Commitment.<br />
We are currently examining the Construction<br />
Excellence/WRAP construction product resource<br />
efficiency plans to determine how we might act to<br />
deliver the greatest leverage <strong>and</strong> resource efficiency gain<br />
in 2013 <strong>and</strong> beyond.<br />
We will measure our performance in this area with a<br />
single resource efficiency target, which we are hoping to<br />
set in 2013.<br />
Embedded impacts<br />
How we manage carbon emissions in our supply chain<br />
represents a significant, sustainable competitive<br />
advantage. In 2012, we embarked on a partnership<br />
with Carbon River to model how much, <strong>and</strong> where,<br />
carbon was being emitted in the entire value chain<br />
of our products <strong>and</strong> bought in goods <strong>and</strong> services. We<br />
propose to use this measure as a broad indicator of our<br />
environmental health <strong>and</strong> robustness. We expect to<br />
publish our initial findings in mid 2013.<br />
Supply chain environmental management<br />
We continue to scrutinise our supply chain for<br />
environmental risk <strong>and</strong> require our partners to make<br />
a commitment to environmental management. Our<br />
figures suggest that approximately 66% by value of the<br />
products our merchant division distributes come from<br />
supply chains, which are regarded as responsible by<br />
a BREEAM assessment, helping our customers meet<br />
higher building codes.<br />
Operating responsibly<br />
Carbon dioxide intensity<br />
In 2012, 101,954 tonnes of carbon dioxide were emitted<br />
as a result of our consumption of energy (96,348 tonnes<br />
in 2011) <strong>and</strong> 104,602 tonnes of carbon dioxide from our<br />
transport activities (104,082 tonnes in 2011).<br />
Over 95% of the data is from measured sources with the<br />
remainder extrapolated from expenditure on fuel.<br />
A combination of relatively benign temperatures,<br />
more grid energy coming from renewable sources<br />
<strong>and</strong> changing colleague behaviours has kept our<br />
performance flat in 2012 despite increased vehicle miles<br />
as a result of our supply chain network expansion.<br />
Out of hours electricity useage within the Wickes<br />
estate has fallen by a cumulative value of 7% in 2012<br />
over 2011 as a result of our Environmental Improvement<br />
Scheme. Approximately 400 branches now use routeplanning<br />
software to increase vehicle efficiency, leading<br />
to fewer emissions. In total, we estimate that these<br />
changes in behaviour have reduced carbon dioxide<br />
emissions by 4,139 tonnes.<br />
We have chosen to concentrate on changing<br />
behaviours in the early part of our carbon strategy,<br />
as a cost effective way of keeping emissions in check.<br />
Addressing consumption choices will remain our priority<br />
in 2013 <strong>and</strong> 2014, even if this means that progress will<br />
be modest. Our previous targets were overambitious <strong>and</strong><br />
need to be revised. Our new target is for a 20% reduction<br />
by 2014 (20% by 2013 previously). Our carbon strategy<br />
is now based on achieving a 48% reduction in intensity<br />
by 2020 (on our 2005 levels) with a 37% reduction by<br />
2017 against the same baseline.<br />
Waste<br />
In 2012 we created 41,241 tonnes of waste with 31,805<br />
tonnes, 77%, being diverted from l<strong>and</strong>fill (60% in 2011).<br />
Over 95% of the data provided by our waste contractors<br />
are measured <strong>and</strong> the remainder extrapolated on an<br />
average branch-tonnage basis.<br />
In 2012, our waste to l<strong>and</strong>fill intensity was at an all time<br />
low at 2.9 tonnes per million pounds of yard <strong>and</strong> core<br />
sales. We confirmed our zero waste l<strong>and</strong>fill target for<br />
2017 <strong>and</strong> introduced a further interim target of a 90%<br />
reduction to l<strong>and</strong>fill from 2005 levels by 2014.<br />
We have achieved our leading performance in waste<br />
management by having strong partnerships with waste<br />
management companies, particularly in respect of<br />
our customer waste offering, a service that now turns<br />
over £4.1 million. Here, Hippo Waste Solutions have<br />
been helpful <strong>and</strong> we have worked together to develop<br />
recycling solutions for managed service customers <strong>and</strong><br />
our consumer kitchen <strong>and</strong> bathroom installer service.<br />
More excitingly, our collaboration with Recipro in Wales<br />
<strong>and</strong> the North West has enabled us to supply unwanted<br />
stock to community projects,<br />
More managers are choosing to introduce branchrecycling<br />
zones, using the information provided by<br />
48
T R A V I S P E R K I N S A N N U A L R E P O R T A N D A C C O U N T S 2 0 1 2<br />
Waste tonnage<br />
OECD sales deflated figures.<br />
Tonnes waste per £m yard <strong>and</strong><br />
core sales.<br />
CO 2<br />
emissions<br />
OECD sales deflated figures.<br />
Tonnes CO 2<br />
per £m group sales.<br />
Timber certification<br />
Timber purchased (£).<br />
Environmental<br />
incidents <strong>and</strong><br />
complaints<br />
1.0<br />
20<br />
10<br />
0<br />
1.7<br />
2.8<br />
3.1<br />
5.6<br />
7.7<br />
21.9<br />
19.6<br />
18.0<br />
18.4<br />
13.3<br />
9.0<br />
4.5 6.8<br />
2.9 9.8<br />
2.2 TARGET<br />
60<br />
30<br />
27.1<br />
26.5<br />
25.6<br />
27.6<br />
26.9<br />
26.7<br />
27.4<br />
28.3<br />
32.6<br />
31.9<br />
27.8<br />
32.6<br />
32.3<br />
33.7<br />
25.3<br />
27.5<br />
47.8 TARGET<br />
0<br />
0<br />
0<br />
05 06 07 08 09 10 11 12 14<br />
05 06 07 08 09 10 11 12 14<br />
05 06 07 08 09 10 11 12 14<br />
05 06 07 08 09 10 11 12 14<br />
L<strong>and</strong>fill Diverted from l<strong>and</strong>fill Energy Transport FSC Other certified schemes<br />
Incidents Complaints<br />
80<br />
40<br />
34%<br />
24%<br />
28%<br />
26%<br />
26%<br />
25%<br />
20%<br />
22%<br />
36%<br />
49%<br />
48%<br />
54%<br />
58%<br />
63%<br />
65%<br />
68%<br />
95% TARGET<br />
50<br />
25<br />
5<br />
10<br />
10<br />
17<br />
21<br />
37<br />
25 30<br />
5<br />
5<br />
6<br />
4<br />
3<br />
5<br />
25<br />
18<br />
10 TARGET<br />
The data for 2011 has been slightly amended<br />
due to a small data error in the 2011 report.<br />
The data for 2011 has been slightly amended<br />
due to a small data error in the 2011 report.<br />
2005 data excludes Wickes timber figures.<br />
our Environmental Improvement Scheme. In 2013, we<br />
are planning to introduce even more opportunities for<br />
managers to increase recycling through segregation to<br />
reduce still further the component of our waste that goes<br />
to l<strong>and</strong>fill.<br />
Water<br />
In 2012, we used 312,959 m 3 of water.<br />
Data provided by our energy bureau contractor<br />
from invoices.<br />
Our water consumption is equivalent to 85m 3 for every<br />
million pounds of sales. We continue to actively identify<br />
irregular consumption patterns <strong>and</strong> address their causes<br />
<strong>and</strong> through these actions believe we will achieve a 45%<br />
reduction on 2008 levels by 2014.<br />
Pollution prevention<br />
Small oil <strong>and</strong> paint spills continue to number most<br />
amongst environmental incidents we experience <strong>and</strong> we<br />
have increased the priority accorded to dealing with these.<br />
In 2012, we recorded 16 incidents of which 13 needed<br />
reporting to the regulator because of a potential risk to<br />
pollution of controlled environments. In each case the<br />
regulator was satisfied with the remedial actions we<br />
took <strong>and</strong> chose not to investigate further. We were not<br />
prosecuted for any environmental offence in 2012.<br />
In 2013, because we have raised the profile of effective<br />
pollution prevention, we are targeting a reduction in the<br />
total number of incidents to less than 10.<br />
with the launch of a suite of new build <strong>and</strong> retrofit<br />
construction plans, providing the construction industry<br />
with easy to follow guidelines to meet the changing<br />
requirements of building regulations <strong>and</strong> the Code for<br />
Sustainable Homes. The SBS website now has over 400<br />
pages of information on sustainable building, covering,<br />
products, specifications <strong>and</strong> practical advice. In 2013<br />
SBS will be heavily involved in delivering the Green Deal<br />
<strong>and</strong> ECO home improvement measures, <strong>and</strong> continuing<br />
to bring innovative products <strong>and</strong> services to the UK<br />
construction market.<br />
Selling certified timber <strong>and</strong> timber products<br />
Our customers, both large <strong>and</strong> small, are increasingly<br />
concerned about purchasing well-managed timber <strong>and</strong><br />
timber products <strong>and</strong> we anticipate this concern will only<br />
grow with the introduction of the EUTR. We are well<br />
placed to deal with such increased interest as we retain<br />
one of the largest multi-site Chain of Custody certificates<br />
in Europe, which means certified products are widely<br />
available from our network.<br />
We are really pleased that the UK Construction<br />
Group has agreed a common position on both certified<br />
material requirements <strong>and</strong> reporting, <strong>and</strong> welcome<br />
the opportunity to work in partnership with our<br />
customers on improving timber traceability in the<br />
construction sector.<br />
REPORTS<br />
Selling responsibly<br />
Sustainable building solutions<br />
Sustainable Building Solutions (SBS), a business we<br />
started in 2010, continued its development in 2012,<br />
Geoff Cooper<br />
Chief Executive<br />
49
Health <strong>and</strong> Safety <strong>Report</strong><br />
FOR THE YEAR ENDED 31 DECEMBER 2012<br />
Our Stay Safe philosophy <strong>and</strong> objectives<br />
Health <strong>and</strong> safety continues to be integral to everything<br />
we do, from the Group Board right down to each<br />
colleague in every branch, store, warehouse <strong>and</strong><br />
office. We believe that all injuries are avoidable, but<br />
we appreciate that achieving a zero injury rate is a<br />
major challenge to a business of our size <strong>and</strong> variety.<br />
Nevertheless, we aim to be the leader in reducing <strong>and</strong><br />
eliminating workplace injuries in our industry, <strong>and</strong> this<br />
is embodied in our ‘Stay Safe’ ethos. This will require<br />
dedicated effort <strong>and</strong> perseverance before we can be even<br />
slightly satisfied with our performance. It is vital that, as<br />
an organisation, we recognise our room for improvement<br />
<strong>and</strong> remain open to challenge on new ideas, equipment<br />
<strong>and</strong> processes.<br />
Underpinning our Stay Safe philosophy is the<br />
importance of reporting; not just incidents that result<br />
in injury, but near miss occurrences that we can learn<br />
from <strong>and</strong> respond to with actions to prevent our people<br />
getting hurt in the future. As a result, we have improved<br />
both our online reporting tools <strong>and</strong> the subsequent<br />
analysis <strong>and</strong> review of all incidents <strong>and</strong> near miss<br />
occurrences. We have recently raised the bar in terms of<br />
what we now classify as a safe branch - we only regard a<br />
store or branch as a safe site if they report no incidents<br />
of injury, but also report near miss occurrences <strong>and</strong><br />
receive a ‘green’ audit score for safety.<br />
Background to our journey<br />
Our journey to Stay Safe started in 2008 following two<br />
very serious incidents in the previous two years.<br />
The transition to adopting Stay Safe<br />
1974: Health <strong>and</strong> Safety at Work Act<br />
1974-2007: Reactive <strong>and</strong> stay legal approach<br />
2006: Serious injury to one of our Keyline drivers<br />
2006-2007: Review risk assessments <strong>and</strong><br />
safe working procedures<br />
2007: Fatality of a building site labourer during a<br />
site delivery<br />
2008: Stay Safe vision <strong>and</strong> initiative created.<br />
Start of new journey<br />
Between 2008 <strong>and</strong> 2011: Significant reduction in<br />
accident frequency rate<br />
2012: Responsibility for Stay Safe<br />
devolved to our divisions<br />
Data trends<br />
Whilst there is no excuse for accidents, the Group faces<br />
many challenges: our 3,400 vehicles make 7.8 million<br />
deliveries every year, travelling in excess of 100 million<br />
miles. We would welcome any opportunity to refresh the<br />
contacts we have had historically with our immediate<br />
competitors <strong>and</strong> widen further this network in order to<br />
engage in meaningful exchanges in relation to safety<br />
best practice <strong>and</strong> innovations.<br />
Group accident frequency rates<br />
Our accident frequency rate (lost time injuries versus the<br />
hours worked) initially fell then plateaued from 2009 to<br />
2011. A slight rise in 2012 is not acceptable to us <strong>and</strong> so<br />
we have adopted a new approach to the way we manage<br />
safety throughout our Group.<br />
The Board reviewing a re-enactment of a serious accident.<br />
Trend in accident frequency rates<br />
All Stay Safe activity is reviewed by the Plc Stay Safe<br />
Committee, which comprises me as Chairman with<br />
Group Board members Ruth Anderson, John Carter <strong>and</strong><br />
Robert Walker. The Committee met with representatives<br />
of group management on three occasions during 2012<br />
to discuss Stay Safe progress, <strong>and</strong> also visited several<br />
sites, including one where we witnessed <strong>and</strong> reviewed a<br />
re-enactment of a serious accident.<br />
2009 2010 2011 2012<br />
Hours worked (m) Accident frequency rate<br />
50
T R A V I S P E R K I N S A N N U A L R E P O R T A N D A C C O U N T S 2 0 1 2<br />
Lost time injuries in 2012<br />
The type of lost time injuries we experienced has not<br />
changed from 2011, despite our prioritising training<br />
activity towards preventing the most frequently<br />
occurring types of injury:<br />
2012 Lost time injuries<br />
5%<br />
4%<br />
4% Injured while<br />
manual h<strong>and</strong>ling<br />
Hit by moving /<br />
30%<br />
falling object<br />
11%<br />
Slipped, tripped or<br />
fell on the same level<br />
Cuts <strong>and</strong> bruises<br />
23%<br />
Hit something fixed<br />
23%<br />
or stationary<br />
Fell from a height<br />
Other *<br />
*Other includes: hit by a moving vehicle, contact with machinery or<br />
material being machined, exposure to a harmful substance, injured by<br />
an animal or physically assaulted by a person.<br />
Non-colleague injuries during 2012<br />
789 injuries to people not employed by the Group were<br />
reported in 2012 (2011: 729) of which 64% occurred in<br />
our Consumer division. The majority were minor (slips,<br />
trips, falls <strong>and</strong> cuts), however two incidents resulted in<br />
major injuries <strong>and</strong> one tragically resulted in a death in<br />
one of our branches.<br />
All of these very regrettable incidents have, or are<br />
in the process of being thoroughly investigated; any<br />
lessons learned will be acted upon.<br />
Our organisation structure<br />
In 2011 we improved our Stay Safe performance,<br />
however we felt that next stage on our Stay Safe journey<br />
was increased ownership of safety at the business level.<br />
At the end of the first quarter of 2012, we reorganised<br />
our group safety team to ensure their focus mirrored our<br />
divisional structure <strong>and</strong> increase personal ownership<br />
<strong>and</strong> accountability for Stay Safe amongst regional <strong>and</strong><br />
branch management teams. This move allows each of<br />
our businesses to tailor health <strong>and</strong> safety actions to the<br />
specific issues they face.<br />
Support from our Stay Safe central team<br />
Our divisions can still draw on the support of an expert<br />
team of safety trainers within our operational training<br />
function. During 2012, they have trained more than<br />
1,000 managers in accident prevention <strong>and</strong> reporting,<br />
risk assessment <strong>and</strong> on-site traffic management, as<br />
well as promoting the adoption of a safety culture in<br />
our branches.<br />
A small central team provides expert health <strong>and</strong><br />
safety advice by telephone <strong>and</strong> online to more than<br />
2,000 managers. The team also analyse all entries in our<br />
online injury reporting system, identifying statistical<br />
trends that help our divisions pinpoint <strong>and</strong> tackle key<br />
safety issues.<br />
Over 40 senior managers are currently working<br />
on Stay Safe projects as part of our senior manager<br />
development programme, which is being run in<br />
conjunction with Ashridge.<br />
The strategy behind our approach<br />
Devolving responsibility <strong>and</strong> cultivating a more<br />
committed level of ownership is underpinned by:<br />
• Leadership – our business leaders demonstrate that<br />
they own <strong>and</strong> drive the Stay Safe message in their<br />
business;<br />
• Personal responsibility <strong>and</strong> belief – all colleagues<br />
believing that all injuries are preventable <strong>and</strong> acting<br />
accordingly;<br />
• Stay Safe behaviour – our systems <strong>and</strong> safe operating<br />
procedures being simple <strong>and</strong> realistic whilst being<br />
understood <strong>and</strong> followed by us all.<br />
We have worked hard to re-intone this philosophy in<br />
all our communications. For instance at our Group<br />
Conference in 2012, we presented all our business<br />
leaders with a two minute video entitled ‘I am not a<br />
number’, involving a large number of colleagues from<br />
across the business with the simple message: ‘Safety is<br />
not about numbers, but always about people’. The video<br />
can be viewed on YouTube.com<br />
Recent activities<br />
Colleague opinions about safety<br />
Our Stay Safe programme continues to yield high<br />
levels of awareness <strong>and</strong> ‘buy in’ from our colleagues. All<br />
our divisional colleague opinion surveys during 2012<br />
recorded that over 90% of our colleagues ‘feel safe at<br />
work’; that their manager genuinely cares about their<br />
safety at work <strong>and</strong> that they have received the Stay Safe<br />
training they need to do their jobs safely.<br />
Differences in Stay Safe performance<br />
across our divisions <strong>and</strong> br<strong>and</strong>s<br />
We recognise that when measured by their specific<br />
accident frequency <strong>and</strong> severity rates some divisions<br />
<strong>and</strong> br<strong>and</strong>s are further ahead in their Stay Safe change<br />
process than others. The main difference in many<br />
cases is that some have been more successful at<br />
engaging colleagues with the Stay Safe journey. Beyond<br />
those differences in culture, values <strong>and</strong> attitudes, the<br />
inconsistent approaches have been affected further by<br />
the varying challenges each business has faced this<br />
year in their trading patterns, resource levels, business<br />
change projects – even the weather! Whilst our reporting<br />
of, <strong>and</strong> learning from, actual accidents <strong>and</strong> from near<br />
misses across all of our business continues to improve it<br />
is frustrating that this is not translating into consistent<br />
performance improvements.<br />
We acknowledge that realising our Stay Safe Vision<br />
consistently across all divisions will not be easy <strong>and</strong> will<br />
dem<strong>and</strong> leadership, consistency of focus <strong>and</strong> attention<br />
to detail to instil the required behaviours, culture <strong>and</strong><br />
ways of working.<br />
REPORTS<br />
51
H E A L T H A N D S A F E T Y R E P O R T<br />
“Stay Safe<br />
is not about<br />
numbers, it’s<br />
always about<br />
people”<br />
Innovations in Stay Safe during the year<br />
We have introduced a number of Stay Safe innovations<br />
in 2012:<br />
• Our group transport team has introduced a number of<br />
initiatives to improve HGV vehicle safety including:<br />
• The introduction of bag nipping vehicle grabs on our<br />
delivery lorries which removes the need to work at<br />
height;<br />
• The trialling of CCTV in lorry cabs which we believe<br />
will have a positive impact on driver behaviour;<br />
• The trialling of proximity sensors on vehicles to help<br />
detect cyclists <strong>and</strong> more visible ‘yellow’ lorry wing<br />
mirrors;<br />
• Our ‘Full Stop’ initiative where all Supply Chain sites<br />
stopped work for an hour at 3 a.m. <strong>and</strong> 3 p.m. on the<br />
same day in August whilst members of the senior team<br />
walked around the site, discussing hazards;<br />
• Our Consumer division has introduced incident<br />
simulations to learn what can be done to prevent<br />
certain types of incidents;<br />
•<br />
Branch managers<br />
are being issued<br />
with a Stay Safe<br />
wall planner aimed<br />
at reminding them<br />
of the key practical<br />
things they should<br />
be doing to maintain<br />
a safe branch.<br />
Supplier safety initiative<br />
During the summer of 2012 we held our annual groupsuppliers’<br />
conference. This year it focused on our Stay<br />
Safe strategy in order to engage our suppliers in playing<br />
a proactive <strong>and</strong> collaborative role in our<br />
safety programmes. By making safety<br />
integral to our commercial relationship,<br />
our message to suppliers is that ‘Safe<br />
Suppliers are the Best Suppliers’. A simple<br />
but effective leaflet has also been produced<br />
for issue to all suppliers to help them make<br />
safe deliveries to our premises.<br />
Looking ahead to 2013<br />
We are encouraged that in 2012, 87% of our branches<br />
were free from any reported lost time injuries. In 2013<br />
we will encourage <strong>and</strong> recognise all such branches by<br />
creating a new Stay Safe ‘high st<strong>and</strong>ard’ performance<br />
measure, namely that of the ‘safe branch’.<br />
To be identified as a safe branch at the end of the<br />
year, that location has to satisfy three key criteria:<br />
• No lost time injuries have been reported;<br />
• Near miss incidents are being reported using our<br />
on-line reporting system;<br />
• The Group’s audit team has given its region a ‘green’<br />
(i.e. good) audit score specifically for its safety<br />
performance.<br />
In 2013 we will:<br />
• Continue our drive to win the hearts <strong>and</strong> minds of<br />
colleagues, managers <strong>and</strong> business leaders in support<br />
of our Stay Safe agenda;<br />
• Recognise safe behaviour wherever <strong>and</strong> whenever it<br />
occurs;<br />
• Simplify <strong>and</strong> improve our systems <strong>and</strong> procedures<br />
<strong>and</strong> make clear the outcomes of non compliance.<br />
We are embarking on further research that will<br />
explore the links between our colleague engagement<br />
survey data, safety metrics <strong>and</strong> business performance<br />
measures. We hope the findings will increase the focus<br />
of our business leaders <strong>and</strong> managers on the additional<br />
changes we need to adopt to deliver the improvements<br />
<strong>and</strong> consistency in safety performance we seek.<br />
Culture change <strong>and</strong> local empowerment approach<br />
Expert<br />
review<br />
Organisation<br />
cultural<br />
Predictors<br />
of accidents<br />
Safety<br />
culture<br />
change<br />
Organisation<br />
focus –<br />
systems<br />
Embedding<br />
safe behaviour<br />
by aligning<br />
‘systems’<br />
to support<br />
change<br />
journey at a<br />
local level<br />
Safety<br />
culture<br />
change<br />
Divisional<br />
focus –<br />
systems,<br />
values,<br />
beliefs, style<br />
<strong>and</strong> staff<br />
Specific<br />
change<br />
management<br />
journeys<br />
using ‘cultural<br />
predictors’ at a<br />
local level<br />
We need to keep focusing on those areas which show<br />
a strong link between organisational culture <strong>and</strong> injury<br />
rates <strong>and</strong> where possible action further improvements.<br />
With those in place, the resulting changes in behaviour<br />
<strong>and</strong> culture will mean that our employees <strong>and</strong><br />
customers go home safely at the end of every day.<br />
The business impact we are seeking will:<br />
• I ncrease employee engagement, morale <strong>and</strong><br />
performance, <strong>and</strong> not only in those areas linked to<br />
safety;<br />
• Increase our safety performance <strong>and</strong> enhance our<br />
reputation as a safe place to work, to buy from <strong>and</strong> to<br />
supply;<br />
• Reduce our long-term-injuries so we have fewer lost<br />
working days, which will improve customer service.<br />
Andrew Simon<br />
Chairman, Plc Board Health & Safety Committee<br />
Toolstation<br />
Northampton<br />
52
T R A V I S P E R K I N S A N N U A L R E P O R T A N D A C C O U N T S 2 0 1 2<br />
REPORTS<br />
53
Directors<br />
Robert Walker Geoff Cooper John Carter<br />
Paul Hampden Smith<br />
Chairman<br />
Robert Walker was appointed as a non-executive<br />
director in September 2009 <strong>and</strong> became Chairman in<br />
May 2010. He is chairman of Enterprise Inns plc <strong>and</strong><br />
Americana International Holdings Ltd, <strong>and</strong> a senior<br />
independent director of Tate & Lyle PLC He was<br />
previously chairman of W H Smith PLC, Williams Lea<br />
Group Ltd <strong>and</strong> BCA Europe <strong>and</strong> Group Chief Executive of<br />
Severn Trent Plc. He spent over 30 years with Procter &<br />
Gamble, McKinsey <strong>and</strong> PepsiCo <strong>and</strong> has also served as a<br />
non executive director on a number of FTSE 100 <strong>and</strong> 250<br />
boards. He is Chairman of the Nominations Committee<br />
<strong>and</strong> a member of the Remuneration <strong>and</strong> Health & Safety<br />
Committees.<br />
Chief Executive<br />
Geoff Cooper joined the Company in February 2005<br />
<strong>and</strong> was appointed Chief Executive in March that year.<br />
He is a chartered management accountant <strong>and</strong> had<br />
a career in management consultancy before joining<br />
Gateway as Finance Director in 1990. In 1994 he became<br />
Finance Director of UniChem plc, subsequently Alliance<br />
UniChem plc (which later became part of Alliance Boots<br />
plc), where he was appointed Deputy Chief Executive<br />
in 2001. He is non-executive Chairman of Dunelm<br />
Group Plc, <strong>and</strong> Chairman of the Construction Products<br />
Association. He is Chairman of the Executive Committee.<br />
Deputy Chief Executive<br />
John Carter joined S<strong>and</strong>ell Perkins as a management<br />
trainee in 1978. He held a number of regional<br />
management positions, before being appointed<br />
Managing Director, Operations in 1996, <strong>and</strong> a director<br />
of Travis Perkins plc in July 2001. He became Chief<br />
Operating Officer in February 2005 <strong>and</strong> was appointed<br />
Deputy Chief Executive in December 2011. He is a<br />
trustee of the Building Research Establishment. He is a<br />
member of the Health & Safety Committee.<br />
Finance Director<br />
Paul Hampden Smith served as Finance Director<br />
throughout 2012 <strong>and</strong> retired from the Board on<br />
28 February 2013.<br />
Tony Buffin is to be appointed as Finance Director<br />
on 8 April 2013. He is a chartered accountant <strong>and</strong> joins<br />
us from the Coles Group in Australia where he was Chief<br />
Financial Officer from 2009. He was formally Chief<br />
Financial Officer of the Loyalty Management Group.<br />
54
T R A V I S P E R K I N S A N N U A L R E P O R T A N D A C C O U N T S 2 0 1 2<br />
Ruth Anderson Chris Bunker John Coleman Philip Jansen Andrew Simon O.B.E.<br />
Ruth Anderson was appointed as a non-executive<br />
director in 2011. She is a chartered accountant <strong>and</strong> held<br />
a number of positions in KPMG (UK) from 1976 to 2009,<br />
being a member of its board from 1998 to 2004 <strong>and</strong> Vice<br />
Chair from 2005 to 2009. She is a non-executive director<br />
of Ocado plc. She is a member of the Audit <strong>and</strong> Health &<br />
Safety Committees.<br />
Chris Bunker was appointed as a non-executive director<br />
in 2004. He is a chartered management accountant<br />
<strong>and</strong> was Finance Director of Thames Water plc, from<br />
2000 until March 2004. He was previously Finance<br />
Director of Tarmac PLC <strong>and</strong> Westl<strong>and</strong> Group PLC. He is<br />
a non-executive director of D S Smith Plc <strong>and</strong> formerly<br />
was a non-executive director of John Mowlem & Co plc,<br />
Baltimore Technologies plc <strong>and</strong> Xansa PLC. He was the<br />
Senior Independent Director until January 2013 <strong>and</strong> is<br />
Chairman of the Audit Committee <strong>and</strong> a member of the<br />
Nominations <strong>and</strong> Remuneration Committees. He will be<br />
retiring from the Board in October 2013.<br />
John Coleman was appointed as a non-executive<br />
director in 2005. He is a chartered management<br />
accountant <strong>and</strong> Chairman of AGA Rangemaster Group<br />
plc. He has previously been Chairman of Holiday<br />
Break plc, Chief Executive of House of Fraser plc <strong>and</strong><br />
Chief Executive of Texas Homecare <strong>and</strong> of a number<br />
of businesses within Burton Group PLC. He succeeded<br />
Chris Bunker as Senior Independent Director in January<br />
2013, <strong>and</strong> is a member of the Remuneration, Audit <strong>and</strong><br />
Nominations Committees.<br />
Philip Jansen was appointed as a non-executive<br />
director in April 2009. He is Chairman of Brakes Group,<br />
Group Chief Executive of Worldpay <strong>and</strong> a senior advisor<br />
to Bain Capital,the private equity group. He is also a<br />
trustee of the charity, Wellbeing of Women. He has<br />
previously been Group Chief Operating Officer <strong>and</strong> Chief<br />
Executive of Europe for Sodexo, Chief Operating Officer<br />
of MyTravel plc <strong>and</strong> Managing Director, Consumer<br />
Division of Telewest Communications PLC. He has<br />
also held senior positions with Procter & Gamble<br />
<strong>and</strong> Dunlop Slazenger Group. He is a member of the<br />
Remuneration Committee. He will be retiring from the<br />
board in May 2013.<br />
Andrew Simon O.B.E. was appointed as a non-executive<br />
director in 2006. He is a non-executive director of<br />
Finning International Inc. (Canada), Management<br />
Consulting Group plc, SGL Carbon SE (Germany),<br />
Exova Group plc, Icon Infrastructure Management<br />
Limited (Guernsey) <strong>and</strong> British Car Auctions. He was<br />
previously Deputy Chairman of Dalkia plc, Chairman<br />
<strong>and</strong> / or Chief Executive of Evode Group plc <strong>and</strong> has<br />
also held non-executive directorships with Severn<br />
Trent Plc, Ibstock PLC, Laporte Plc, Associated British<br />
Ports Holdings PLC, <strong>and</strong> Brake Bros Holdings Ltd. He<br />
is chairman of the Remuneration <strong>and</strong> Health & Safety<br />
Committees.<br />
GOVERNANCE<br />
55
Corporate Responsibility Statement<br />
FOR THE YEAR ENDED 31 DECEMBER 2012<br />
The Company has not produced a separate corporate responsibility<br />
statement in the report <strong>and</strong> accounts since it believes these<br />
matters are sufficiently important to receive the personal attention<br />
of individual directors rather than risking less focus through the<br />
exercise of collective responsibility. Instead, full details of those areas<br />
normally covered by such a report are contained either in the reports<br />
of the directors responsible for such matters, or in a separate report,<br />
as explained below:<br />
Environment<br />
CEO, Geoff Cooper, responsibility - Environmental report on pages<br />
46 to 49.<br />
Health & safety<br />
NED, Andrew Simon, responsibility - Health & Safety report on pages<br />
50 to 52.<br />
Supply chain<br />
Deputy Chief Executive - John Carter’s review of the year.<br />
Employees<br />
Deputy Chief Executive, John Carter’s review of the year; <strong>and</strong><br />
Community relations<br />
Chief Executive, Geoff Cooper’s review of the year.<br />
The Board takes into account, environmental, social <strong>and</strong> governance<br />
matters in its conduct of the Company’s business. The Board believes<br />
that it has adequate information to identify <strong>and</strong> assess the major<br />
environmental, social <strong>and</strong> governance risks <strong>and</strong> as part of the system<br />
of internal control receives reports on the risks associated with these<br />
matters. The Board has received briefings on such matters during 2012.<br />
Robert Walker<br />
Chairman<br />
Committees <strong>and</strong> Professional Advisers<br />
Secretary:<br />
A. S. Pike<br />
Audit Committee:<br />
C. J. Bunker (Chairman), R. Anderson, J. Coleman<br />
Remuneration Committee:<br />
A. H. Simon (Chairman), C. J. Bunker, J. Coleman, P. Jansen, R. Walker<br />
Nominations Committee:<br />
R. Walker (Chairman), C. J. Bunker, J. Coleman<br />
Health & Safety Committee:<br />
A. H. Simon (Chairman), R. Anderson, J. P. Carter, R. Walker<br />
Executive Committee:<br />
G. I. Cooper (Chief Executive <strong>and</strong> Committee Chairman)<br />
J. P. Carter (Deputy Chief Executive)<br />
A. Buffin (Finance Director) (with effect from 8 April 2013)<br />
K. Appleton (Chairman, General Merchanting Division)<br />
N. G. Bell (Group Development Director)<br />
J. Bird (Chairman, Consumer Division)<br />
A. J. Davidson (Chairman, Specialist Merchanting Division)<br />
C. Kavanagh (Group HR Director)<br />
M. R. Meech (Group Property Director)<br />
A. S. Pike (Company Secretary & General Counsel)<br />
R. D. Proctor (Group Supply Chain Director)<br />
P. Tallentire (Chairman, Plumbing & Heating Division)<br />
J. J. Van Oosten (Chief Information Officer)<br />
Investment Bankers / Advisors:<br />
HSBC Bank plc. Nomura International plc<br />
Corporate Broker:<br />
Citibank, Credit Suisse<br />
Bankers:<br />
The Royal Bank of Scotl<strong>and</strong> plc. Barclays Bank plc<br />
Lloyds TSB Bank plc<br />
Solicitors:<br />
Linklaters LLP, London. Clifford Chance LLP, London<br />
Auditor:<br />
Deloitte LLP, London<br />
Registrars:<br />
Capita Registrars, Beckenham<br />
56
TRAVIS PERKINS ANNUAL REPORT AND ACCOUNTS 2012<br />
Corporate Governance<br />
FOR THE YEAR ENDED 31 December 2012<br />
UK corporate governance code<br />
We explain below how the Company has applied the principles <strong>and</strong><br />
provisions of the UK Corporate Governance Code (‘the Code’) in 2012.<br />
We do so by reference to the five main sections of the Code. Where<br />
practicable, we have complied early this year with changes to the<br />
Code, <strong>and</strong> with forthcoming regulations on executive remuneration<br />
reporting, which will not technically apply to the Company until next<br />
year’s annual report.<br />
1. Leadership<br />
The Company is governed by a board of directors, of which I am<br />
Chairman. In addition, there are three executive <strong>and</strong> five nonexecutive<br />
directors. Geoff Cooper is Chief Executive. Chris Bunker<br />
was the Senior Independent Director throughout 2012 <strong>and</strong> until<br />
succeeded in that role in January 2013 by John Coleman. Ruth<br />
Anderson, Philip Jansen <strong>and</strong> Andrew Simon are also independent<br />
non-executive directors.<br />
The Board has a schedule of matters reserved to it, which<br />
is reviewed annually. No changes were made in 2012. Its key<br />
responsibilities are for overall group strategy, policy on corporate<br />
governance, approval of expansion plans <strong>and</strong> major capital<br />
expenditure, consideration of significant financial <strong>and</strong> operational<br />
matters <strong>and</strong> the Company’s exposure to key risks. It also reviews<br />
the strategy of the individual businesses, their annual budgets <strong>and</strong><br />
progress towards the achievement of those budgets <strong>and</strong> longterm<br />
objectives. Legislative, environmental, health <strong>and</strong> safety <strong>and</strong><br />
employment issues are also considered. The Board has also approved<br />
a written statement of the division of key responsibilities between<br />
myself, as Chairman, <strong>and</strong> the Chief Executive; again, we review this<br />
annually <strong>and</strong> no changes were made in 2012.<br />
The Company maintains directors & officers’ insurance in respect<br />
of the risk of claims against directors. This is reviewed annually.<br />
All directors have direct access to the Company Secretary <strong>and</strong><br />
may take independent professional advice in the furtherance of their<br />
duties if necessary.<br />
Communication<br />
As Chairman, I take care to ensure that each director is able to make<br />
an effective contribution within an atmosphere of transparency<br />
<strong>and</strong> constructive debate. I agree the agenda for board meetings in<br />
conjunction with the Chief Executive <strong>and</strong> the Company Secretary.<br />
Agendas are based upon an annual plan but also include matters of<br />
particular interest or concern to the Board at any particular time.<br />
I discuss the meeting papers with any director who is unable to<br />
attend a meeting, to obtain that director’s view prior to the meeting.<br />
I also monitor the information provided to the Board to ensure it is<br />
sufficient, timely <strong>and</strong> clear, <strong>and</strong> the Board reviews the adequacy of this<br />
information as part of its annual evaluation process, described below.<br />
I make a habit of contacting all the non-executive directors in<br />
advance of Board meetings, to suggest the key issues for discussion<br />
during the meeting; this also helps the directors to prepare, during<br />
their reading of the papers in advance of the meeting.<br />
I maintain regular direct contact with the executive directors <strong>and</strong><br />
keep the non-executive directors informed of material developments<br />
between board meetings. I have regular, mostly weekly meetings with<br />
the Group Chief Executive <strong>and</strong> meet from time to time throughout<br />
the year with the Finance Director <strong>and</strong> Deputy Chief Executive. I held<br />
a number of meetings during the year with all the non-executive<br />
directors, without the executive directors being present.<br />
Board meetings<br />
We held twelve Board meetings in 2012 (two by conference call),<br />
One meeting was dedicated to consideration of the Company’s longterm<br />
strategy. Nine meetings included either visits to parts of the<br />
Company’s operations, presentations by senior executives on their<br />
areas of responsibility or, in one case, a visit to the factory of a major<br />
supplier. The latter visit was prompted by a recommendation in the<br />
previous year’s externally-conducted performance evaluation, in<br />
which it was suggested the Board have more contact with its wider,<br />
external partners. Non-executive directors also made individual visits<br />
to operational sites. In addition to the regular board meetings, key<br />
financial information is circulated to directors outside of meetings.<br />
The number of board <strong>and</strong> committee meetings attended by each<br />
director (in whole or in part) during the year is detailed in the table<br />
below. The larger number of Remuneration Committee meetings is<br />
unusual <strong>and</strong> was prompted by the need to give full consideration to<br />
the Group’s proposed new replacement deferred share bonus plan<br />
(see Remuneration <strong>Report</strong>, page 65).<br />
GOVERNANCE<br />
PLC Board Audit Remuneration Nomination Health & Safety Executive<br />
No. No. No. No. No. No.<br />
Number of meetings 12 4 9 5 3 12<br />
Attendances:<br />
R. Anderson 11 4 - 5 3 -<br />
c. J. Bunker 12 4 9 5 - -<br />
J. P. Carter 12 - - - 3 11<br />
J. Coleman 12 4 9 5 - -<br />
G. I. Cooper 12 - 9 3 - 12<br />
P. N. Hampden Smith 11 4 2 - - 12<br />
P. Jansen 12 - 8 5 - -<br />
A. H. Simon 12 - 9 5 3 -<br />
R. Walker 12 4 9 5 3 -<br />
57
Corporate Governance<br />
Board committees<br />
We have five board committees: the Audit Committee, the<br />
Remuneration Committee, the Nominations Committee, the Health<br />
& Safety Committee <strong>and</strong> the Executive Committee, which operate<br />
within defined terms of reference, which we review annually. These<br />
are available on the Company’s website or may be obtained from<br />
the Company Secretary. The minutes of committee meetings are<br />
circulated to all the Directors.<br />
The Executive Committee is chaired by the Group CEO <strong>and</strong> its<br />
members are listed on page 56. Other executives are invited to attend<br />
from time to time in relation to specific matters. The main purpose of<br />
this Committee is to assist the executive directors in the performance<br />
of their duties in relation in particular to:<br />
• Strategy, operational plans, policies, procedures <strong>and</strong> budgets;<br />
• The monitoring of operational <strong>and</strong> financial performance;<br />
• The assessment <strong>and</strong> control of risk;<br />
• The prioritisation <strong>and</strong> allocation of resources.<br />
This committee is in the process of establishing a number of subcommittees<br />
to carry out more detailed review in areas such as trading<br />
performance or financial control, which will allow the committee to<br />
focus on key strategic issues.<br />
2. Effectiveness<br />
The Board is satisfied that I <strong>and</strong> the five non-executive directors are<br />
all independent. In particular, none of the specific circumstances<br />
set out in Code provision B.1.1 apply. Appointments of new directors<br />
are made by the Board on the recommendation of the Nominations<br />
Committee. I chair that Committee <strong>and</strong> all the other members are<br />
independent non-executive directors. A report of the Committee’s<br />
work in 2012 is on page 75.<br />
Appointments<br />
With regard to the appointment of non-executive directors, our policy<br />
is to recruit people of the highest calibre, with a breadth of skills<br />
<strong>and</strong> experience appropriate for the Company’s business. We support<br />
the principles of the Davies Review <strong>and</strong> the need for a diverse range<br />
of attributes among board members, although we do not intend to<br />
commit to specific quotas. We use search firms who have committed<br />
to abide by the voluntary code of conduct which followed the Davies<br />
Review. We will establish a diversity policy during 2013 as required<br />
by the Code. We will report on this next year.<br />
Non-executive directors are appointed for a period of three years,<br />
at the end of which the appointment may be renewed by mutual<br />
agreement. It is the Board’s policy that non-executive directors should<br />
generally serve for six years (two three-year terms) <strong>and</strong> that any<br />
term beyond this should be subject to a rigorous review. This review<br />
takes into account the need for progressive refreshing of the Board,<br />
maintenance of a balance of skills <strong>and</strong> experience <strong>and</strong> the particular<br />
requirements of the Company at the time of the possible extension.<br />
Non-executive directors do not have a service contract, but each has<br />
received a letter of appointment. These appointments expire on the<br />
following dates, <strong>and</strong> the length of service at that date is also shown.<br />
Ruth Anderson<br />
Chris Bunker<br />
John Coleman<br />
Philip Jansen<br />
Andrew Simon<br />
Robert Walker<br />
October 2014 (3 years)<br />
October 2013 (9 years, 9 months)<br />
February 2014 (9 years)<br />
April 2015 (6 years)<br />
February 2015 (9 years)<br />
September 2015 (6 years)<br />
The letters of appointment will be available for inspection at the<br />
<strong>Annual</strong> General Meeting.<br />
Chris Bunker has now served on the Board for over 9 years. However,<br />
with the arrival of a new Finance Director in April 2013, <strong>and</strong> as the<br />
Board will be conducting a key strategic review in the Autumn of this<br />
year, it was agreed that the Board would greatly benefit from retaining<br />
Chris’ skills <strong>and</strong> experience for a few more months. He will therefore,<br />
now retire from the Board in October 2013. The Chairman consulted<br />
with major shareholders who were supportive of this extension.<br />
Regrettably, because of the extent of his other executive<br />
commitments, Philip Jansen has also decided to retire from the Board<br />
with effect from the end of the <strong>Annual</strong> General Meeting in May 2013.<br />
Induction<br />
We have an induction process for new directors, which is facilitated<br />
by the Company Secretary. In particular, this includes a programme<br />
of meetings with senior management in both operations <strong>and</strong> central<br />
functions, <strong>and</strong> visits to a range of branches <strong>and</strong> stores. I ensure that<br />
all directors receive appropriate training on appointment <strong>and</strong> then<br />
subsequently as required, taking into account the need to update<br />
their skills <strong>and</strong> their knowledge of the Company’s business. Nonexecutive<br />
directors are also regularly provided with information on<br />
forthcoming legal <strong>and</strong> regulatory changes <strong>and</strong> corporate governance<br />
developments, <strong>and</strong> briefings on the key risks facing the Company,<br />
including those identified in the Corporate Responsibility statement<br />
on page 56.<br />
Executive mentoring by NEDs<br />
Since 2011, <strong>and</strong> conscious of the potential impact of the Group’s<br />
growth on communication between the Board <strong>and</strong> senior<br />
management, we have adopted a new approach to involving our<br />
non-executive directors (including myself) more closely with the<br />
individual businesses. Each non-executive director is allocated to<br />
one or more of the Group’s businesses <strong>and</strong> one of the Group’s central<br />
functions to mentor during the year. The precise process is left to<br />
each non-executive director to decide, but involves a programme of<br />
contact <strong>and</strong> meetings with the management of those businesses or<br />
functions, <strong>and</strong> a number of site visits. The intention is to give the<br />
non-executive directors a better underst<strong>and</strong>ing of our businesses<br />
<strong>and</strong> functions, their people <strong>and</strong> strategies, while allowing them<br />
to use their skills <strong>and</strong> experience to bring a fresh, independent,<br />
viewpoint to those parts of the Group. This mentoring arrangement<br />
will continue in 2013.<br />
58
TRAVIS PERKINS ANNUAL REPORT AND ACCOUNTS 2012<br />
Evaluation of performance<br />
During the year, the Board undertook an evaluation of its<br />
performance <strong>and</strong> the performance of its committees <strong>and</strong> the<br />
individual directors. The Board’s policy is to engage an external<br />
facilitator to assist this process every three years, while recognising<br />
the difficulty in finding fully capable expertise in this area. It<br />
is a fact of life that new government regulations often spawn<br />
new businesses <strong>and</strong> it has been Board members’ experience<br />
that individuals who set out to provide this service in the past<br />
were simply not fit for purpose. Previously, the Board has very<br />
successfully utilised the service of Egon Zehnder, one of the largest<br />
providers of board evaluation services in the UK, since there has<br />
been no conflict of interest. Going forward, we are encouraged to see<br />
the emergence in the past year or so of more professionally qualified<br />
evaluation service providers<br />
Having appointed an external facilitator in 2011, in 2012 the Board<br />
carried out an internal review of its performance. This entailed each<br />
director <strong>and</strong> the company secretary completing a questionnaire<br />
about the performance of the Board <strong>and</strong> its committees, which<br />
was followed by interviews with the Chairman, who subsequently<br />
prepared a report, which was presented to the Board in December.<br />
Chris Bunker, as senior independent director also conducted a review<br />
of the performance of the Chairman on which he reported separately<br />
to the other directors. Having considered the outcome of these<br />
reports, the Board believes that it has operated effectively during<br />
the year but it will focus on a number of areas in 2013 where it may<br />
further improve its performance. Those areas are:<br />
• Succession planning, including among non-executive directors;<br />
• Support for the further development of management development<br />
programmes;<br />
• The development of financial reporting to the Board;<br />
• Receiving independent views from external sources, whether<br />
through discussions or site visits, to gain greater insight in to best<br />
practice in a number of areas.<br />
In 2013, the Board will conduct an internal review of its performance.<br />
Re-election<br />
At the AGM, all directors (except Philip Jansen) will submit<br />
themselves for re-election. As a result of the board evaluation exercise,<br />
as Chairman I am satisfied that each director continues to show the<br />
necessary level of commitment to the Group, <strong>and</strong> has sufficient time<br />
available to fulfil his or her duties, to justify their re-election. The<br />
other directors, in a process led by the Senior Independent Director,<br />
have reached a similar view in regard to my own re-election, <strong>and</strong> in<br />
particular have recognised that my appointment as chairman of<br />
Enterprise Inns during 2012 has not affected my commitment to <strong>and</strong><br />
time available for my role at Travis Perkins.<br />
The Board believes that there is presently a blend of skills <strong>and</strong><br />
experience among the non-executive directors, which is appropriate<br />
for the Group. The skills required for our Board, include experience<br />
in the merchanting <strong>and</strong> retail sectors, capital project <strong>and</strong> M&A<br />
evaluation <strong>and</strong> experience of international markets, as well as<br />
the essential underst<strong>and</strong>ing of financial controls <strong>and</strong> accounting<br />
background. An underst<strong>and</strong>ing of information technology will<br />
become increasingly important.<br />
3. Accountability<br />
A review of the performance of the Group’s businesses <strong>and</strong> the<br />
financial position of the Group is included in the reports of the Chief<br />
Executive, the Deputy Chief Executive <strong>and</strong> Finance Director set out<br />
on pages 20 to 43. The Board uses them, together with my statement<br />
on pages 18 <strong>and</strong> 19 to present a full assessment of the Company’s<br />
position <strong>and</strong> prospects, its business model, <strong>and</strong> its strategy for<br />
delivering that model. The Directors’ responsibilities for the financial<br />
statements are described on page 80. Their consideration of the<br />
Group as a going concern is dealt with in the Finance Director’s report<br />
on page 43.<br />
Internal control<br />
The Board is responsible for the Group’s system of internal control<br />
<strong>and</strong> for reviewing its effectiveness. In the design of the system of<br />
internal control, consideration has been given to the significant risks<br />
to the business, the probability of these risks manifesting themselves<br />
<strong>and</strong> the most cost effective means of controlling them. The threat<br />
posed by those risks, <strong>and</strong> any perceived change in that threat, is<br />
reviewed quarterly by both the Executive Committee <strong>and</strong> the Board.<br />
The system manages rather than eliminates risk <strong>and</strong> therefore can<br />
only provide reasonable, <strong>and</strong> not absolute, assurance against material<br />
misstatement or loss.<br />
The day-to-day operation of the system of internal control is<br />
delegated to executive directors <strong>and</strong> senior management, but the<br />
effectiveness of the system is regularly reviewed by the Audit<br />
Committee <strong>and</strong> the Board in a process that accords with the<br />
Turnbull Guidance.<br />
Risk assessment<br />
The Board <strong>and</strong> the Executive Committee receive reports on specific<br />
areas of risk at each meeting, in accordance with a rolling timetable.<br />
They also receive reports of Internal Audit reviews. If appropriate,<br />
these reports include recommendations for improvement in controls<br />
or for the management of those risks. Measures to integrate risk<br />
management processes into the Group’s operations, to extend<br />
awareness of the importance of risk management <strong>and</strong> to ensure<br />
that recommended improvements are implemented, are regularly<br />
reviewed <strong>and</strong> refreshed. Senior executives are asked, each year,<br />
to confirm the adequacy of internal controls in their areas of<br />
responsibility, identify any control weaknesses, <strong>and</strong> to confirm the<br />
accuracy <strong>and</strong> completeness of information given to the directors <strong>and</strong><br />
to the external auditors. This process was extended further through<br />
the management structure in 2012.<br />
In conjunction with the Audit Committee, the Board has carried out<br />
an annual review of the overall effectiveness of the system of internal<br />
control <strong>and</strong> risk management, during the year <strong>and</strong> up until the date of<br />
approval of this <strong>Annual</strong> <strong>Report</strong>.<br />
GOVERNANCE<br />
59
Corporate Governance<br />
Audit committee <strong>and</strong> auditors<br />
The Board has established an Audit Committee consisting of three<br />
independent non-executive directors. Its key responsibilities <strong>and</strong> a<br />
description of its work in 2012 are contained in its report, which is set<br />
out on pages 61 to 63.<br />
4. Remuneration<br />
The Board has established a Remuneration Committee consisting<br />
of the Chairman <strong>and</strong> four independent non-executive directors.<br />
Its responsibilities include remuneration policy, a review of the<br />
performance of executive directors prior to determining their<br />
remuneration <strong>and</strong> the approval of incentive arrangements, including<br />
performance criteria. The remuneration of the non-executive<br />
directors is determined by the Board as a whole, except that the<br />
Remuneration Committee makes a recommendation in respect of the<br />
Chairman’s fee. No director plays a part in the discussion about his<br />
own remuneration.<br />
The Committee’s key responsibilities <strong>and</strong> a description of its work in<br />
2012 are contained in its report, which is set out on pages 64 <strong>and</strong> 74.<br />
5. Relations with shareholders<br />
The Company encourages two-way communication with both its<br />
institutional <strong>and</strong> private investors <strong>and</strong> responds promptly to all<br />
enquiries received. In 2012, the Chairman, the Senior Independent<br />
Director <strong>and</strong> the executive directors, either separately or together,<br />
attended a large number of meetings with analysts, <strong>and</strong> with<br />
shareholders representing about 55% of the issued share capital. In<br />
particular, three strategy presentations (including site visits), were<br />
held for analysts <strong>and</strong> investors during the year. We also make it clear<br />
that the Senior Independent Director is available as a direct contact<br />
for shareholders, if they wish. The Chairman <strong>and</strong> executive directors<br />
report to the Board on any meetings with shareholders or analysts. In<br />
addition, written reports about the Company by analysts or brokers<br />
are circulated to all directors.<br />
As regards governance issues, the Chairman aims to meet<br />
with major shareholders shortly after the previous year’s annual<br />
shareholders meeting. These meetings are deliberately timed early in<br />
the year so that the Board can consider <strong>and</strong> respond to shareholder<br />
concerns well in advance of the following year’s annual report <strong>and</strong><br />
shareholder meeting. I normally contact our 20 largest shareholders<br />
to ensure the widest consultation possible <strong>and</strong> particularly, given<br />
market volatility, to ensure that the views of a shareholder who<br />
substantially increases its stake during the year have been fully<br />
taken into account.<br />
As well as sending the annual report to shareholders, during the<br />
year, the Company published its interim results on its website,<br />
issued two interim management statements, <strong>and</strong> one further trading<br />
update. Shareholders receive at least twenty working days notice<br />
of the <strong>Annual</strong> General Meeting at which all directors are available<br />
for questions <strong>and</strong> a short business presentation takes place. Each<br />
substantive issue is the subject of a separate resolution. I announce<br />
the numbers of proxy votes for <strong>and</strong> against each resolution at the<br />
meeting, after the voting has taken place, <strong>and</strong> these numbers are<br />
subsequently published on the Company’s website.<br />
Corporate governance compliance statement<br />
I am pleased to report that the Company has complied throughout the<br />
year ended 31 December 2012 with the provisions set out in the Code.<br />
Robert Walker<br />
Chairman<br />
60
TRAVIS PERKINS ANNUAL REPORT AND ACCOUNTS 2012<br />
Audit Committee <strong>Report</strong><br />
FOR THE YEAR ENDED 31 December 2012<br />
As Chairman of the Audit Committee, I am pleased to report below on<br />
the Committee’s activities in 2012.<br />
Role of the audit committee<br />
The Committee is primarily responsible for:<br />
• The integrity of the financial statements of the Company <strong>and</strong><br />
any formal announcements relating to the Company’s financial<br />
performance, <strong>and</strong> reviewing significant financial reporting<br />
judgments contained therein;<br />
• Reviewing the Company’s internal financial controls <strong>and</strong> its<br />
internal control <strong>and</strong> risk management systems;<br />
• Monitoring <strong>and</strong> reviewing the effectiveness of the Company’s<br />
internal audit function;<br />
• Reviewing the audit plans of the external auditors <strong>and</strong> for<br />
monitoring the conduct of the audit;<br />
• Reviewing the external auditor’s independence <strong>and</strong> objectivity <strong>and</strong><br />
the effectiveness of the audit process, taking into consideration<br />
relevant UK professional <strong>and</strong> regulatory requirements;<br />
• Reviewing <strong>and</strong> implementing the Company’s policy on the<br />
engagement of the external auditors to supply non-audit services,<br />
taking into account relevant guidance regarding the provision of<br />
non-audit services by an external audit firm;<br />
• Conducting any tender process for the provision of the external<br />
audit, <strong>and</strong> making recommendations to the Board, for a resolution<br />
to be put to the shareholders in relation to the appointment <strong>and</strong><br />
remuneration of the external auditors.<br />
Shortly after each meeting, I report to the Board on the work of the<br />
Committee, identifying any matters where it considers that action or<br />
improvement is needed, <strong>and</strong> make recommendations as to the steps<br />
to be taken.<br />
The Committee’s full terms of reference are available on the<br />
Company’s website, or on request to the Company Secretary.<br />
Composition of the audit committee<br />
I was Chairman, <strong>and</strong> Ruth Anderson <strong>and</strong> John Coleman were<br />
members, of the Committee throughout 2012. All members of the<br />
Committee are considered to be independent <strong>and</strong> have considerable<br />
financial <strong>and</strong> commercial experience from a variety of corporate <strong>and</strong><br />
professional backgrounds. In particular, the Board considers that<br />
both I <strong>and</strong> Ruth Anderson have the recent <strong>and</strong> relevant financial<br />
experience required by the UK Corporate Governance Code (see also<br />
the board profiles on pages 54 <strong>and</strong> 55). The Company Secretary is<br />
secretary to the Committee.<br />
Meetings <strong>and</strong> attendance<br />
The Committee held four meetings during 2012, <strong>and</strong> attendance at<br />
the meetings is shown on page 57. I also invited the Group Chairman,<br />
the Chief Executive, the Finance Director, the Deputy Chief Executive,<br />
the Group Financial Controller, the Director of Business Risk <strong>and</strong><br />
Assurance <strong>and</strong> the external auditor to attend the meetings. At each<br />
meeting I gave the external auditor <strong>and</strong> the Director of Business<br />
Risk <strong>and</strong> Assurance the opportunity to discuss with the Committee,<br />
any matters which they wished to raise without the presence<br />
of management. In addition, during the year, I held a number of<br />
meetings with the Director of Business Risk <strong>and</strong> Assurance <strong>and</strong><br />
with the external auditors, without management being present.<br />
Committee members meet regularly with operational <strong>and</strong> functional<br />
staff throughout the year <strong>and</strong> participate in relevant technical update<br />
programmes. I am satisfied that the Committee received sufficient,<br />
reliable <strong>and</strong> timely information from management to enable it to<br />
fulfil its responsibilities during the year.<br />
Main activities of the committee during the year<br />
At our meeting in February, the Committee reviewed the annual<br />
financial statements of the Company. It took into account regular<br />
management accounting information, a report from the internal<br />
auditors on internal control matters <strong>and</strong> the external auditors’ report<br />
on the conduct of their audit, their review of accounting policies <strong>and</strong><br />
areas of judgment in the financial statements <strong>and</strong> their comments on<br />
statements concerning risk <strong>and</strong> internal control. A similar review was<br />
undertaken at the July meeting when the interim statements were<br />
considered. During the year the Committee also reviewed:<br />
• Lessons learned from the process to integrate the BSS Group’s<br />
financial systems, the costs of that integration, <strong>and</strong> the associated<br />
exceptional items;<br />
• The impairment testing of goodwill <strong>and</strong> other non-monetary assets<br />
<strong>and</strong> the accounting processes <strong>and</strong> disclosures related thereto;<br />
• The accounting treatment of the acquisition of the remaining share<br />
capital in Toolstation in January 2012;<br />
• The progress of training on the Bribery Act;<br />
• The Company’s tax management <strong>and</strong> its compliance with<br />
tax legislation, the tax impact of significant projects, <strong>and</strong> the<br />
relationship with HMRC;<br />
• An evaluation of the Committee’s work carried out as part of the<br />
Board evaluation process referred to on pages 58 <strong>and</strong> 59.<br />
I subsequently reported to the Board on this evaluation;<br />
• The Committee’s terms of reference; changes were recommended<br />
to the Board in the light of changes to the UK Corporate Governance<br />
Code;<br />
• Comments received on its 2011 report from institutional investor<br />
bodies;<br />
• The effectiveness of the system of internal financial control <strong>and</strong><br />
the system for monitoring <strong>and</strong> reporting on risks faced by the<br />
Group; the Committee considered these systems to have been<br />
effective during the year;<br />
• The terms of reference, strategy, staffing, processes <strong>and</strong><br />
effectiveness of the internal audit department, taking into account<br />
the results of an exercise to benchmark its performance against<br />
other companies;<br />
• The status of actions taken in response to recommendations<br />
arising from internal <strong>and</strong> external audit work;<br />
• The effectiveness of the Group’s ‘whistleblowing’ policy;<br />
• The policy on engagement of the external auditor for non-audit<br />
work, as referred to below, <strong>and</strong> the policy on the employment of<br />
anyone previously employed by the external auditor;<br />
• The plans presented by the external auditor for conduct of the<br />
year-end audit <strong>and</strong> half-year review including the related risk<br />
analyses, terms of engagement, fees <strong>and</strong> letters of representation;<br />
GOVERNANCE<br />
61
Audit Committee <strong>Report</strong><br />
• The effectiveness, independence, <strong>and</strong> objectivity of the external<br />
auditor, taking into account information <strong>and</strong> written assurances<br />
provided by Deloitte LLP, on its quality <strong>and</strong> independence controls,<br />
<strong>and</strong> its ethical st<strong>and</strong>ards, <strong>and</strong> reports of the FRC Audit Inspection<br />
Unit;<br />
• The security of the Group’s information technology systems;<br />
• The Group’s systems for ensuring the eligibility of employees to<br />
work in the UK;<br />
• The Group’s accounting policies, forthcoming changes to<br />
International Financial <strong>Report</strong>ing St<strong>and</strong>ards <strong>and</strong> other regulations,<br />
<strong>and</strong> the Financial <strong>Report</strong>ing Council’s 2012 report <strong>and</strong> guidance<br />
notes;<br />
• The effectiveness of the Group’s policies <strong>and</strong> processes for fraud<br />
prevention.<br />
No matters of material significance were identified by the auditors<br />
during the year <strong>and</strong> there were no material audit-related matters that<br />
were discussed with investors. Two members of the Committee are<br />
also members of the Remuneration Committee. The Audit Committee<br />
is satisfied that the Group’s remuneration policies are compatible<br />
with a robust control environment <strong>and</strong> good stewardship.<br />
The key areas of risk <strong>and</strong> sensitivity, the major accounting<br />
policies, <strong>and</strong> the principal assumptions with regard to fair values<br />
are described in the <strong>Annual</strong> <strong>Report</strong> <strong>and</strong> notes to the accounts. The<br />
Committee reviewed these during the year <strong>and</strong> after taking into<br />
account discussions with the Financial <strong>Report</strong>ing Council’s Conduct<br />
Committee about impairment calculations <strong>and</strong> disclosures (see note<br />
13 to the annual report <strong>and</strong> accounts), <strong>and</strong> after including some<br />
additional disclosures in the Group’s 2012 annual report <strong>and</strong> accounts<br />
the Committee was satisfied that they were appropriate.<br />
External auditor<br />
We place great importance on the effectiveness <strong>and</strong> independence<br />
of the external auditor <strong>and</strong>, together with them, are careful to ensure<br />
their objectivity is not compromised. At our October meeting, the<br />
auditors presented their plans for the forthcoming audit together with<br />
their proposed fees <strong>and</strong> information on how they ensure that their<br />
objectivity <strong>and</strong> independence are not compromised. Deloitte LLP (or<br />
its predecessor firms) is a leading international audit partnership,<br />
<strong>and</strong> was first appointed as auditor to group companies more than 30<br />
years ago. There are no contractual restrictions on the Group with<br />
regard to their appointment. In accordance with current professional<br />
st<strong>and</strong>ards, the partner responsible for the audit changes every 5<br />
years; the last change occurred in 2010.<br />
The Committee considers that Deloitte provide a high quality,<br />
efficient <strong>and</strong> cost effective audit service. Accordingly, following our<br />
February 2013 meeting at which we reviewed the 2012 audit process,<br />
the Committee recommended to the Board that resolutions be put to<br />
shareholders at the <strong>Annual</strong> General Meeting for the re-appointment<br />
of the external auditor, <strong>and</strong> to authorise the Directors to fix their<br />
remuneration. It is the Group’s intention to put the audit out to tender<br />
at least every 10 years, in accordance with the recent change to the<br />
UK Corporate Governance Code, <strong>and</strong> to do so in 2014, the last year<br />
before the Deloitte audit partner is due to change. The tender process<br />
will be completed in time for the 2015 year-end.<br />
One of the Committee’s responsibilities is to ensure compliance<br />
with the Board’s policy in respect of services provided by, <strong>and</strong> fees<br />
paid to, the auditor. Audit fees, which are regularly compared with peer<br />
companies by the Committee, are initially negotiated by the Finance<br />
Director, but are then approved by the Committee. The policy in<br />
relation to other services that could be provided by the external auditor,<br />
which has been approved by the Board, can be summarised as follows:<br />
General principles<br />
There is a presumption against the external auditor providing nonaudit<br />
services <strong>and</strong> they should only be chosen to carry out such work<br />
where its nature makes it more cost effective <strong>and</strong> efficient to select<br />
advisors who have a good underst<strong>and</strong>ing of the Group or the work is of<br />
a particularly confidential or specialist nature. The external auditors<br />
should not provide non-audit services where either the nature of the<br />
work or the extent of such services might impair their independence<br />
or objectivity in carrying out the audit. Any engagement of the<br />
external auditor for non-audit work with a fee over £25,000 requires<br />
my approval.<br />
Areas of work<br />
Our policy sets out certain non-audit services where it would be usual<br />
to engage the external auditor because they are best placed to advise<br />
the Group <strong>and</strong> their independence would not be compromised <strong>and</strong><br />
those where their engagement is not permitted. I am consulted in<br />
relation to any proposed work not covered by the list below.<br />
Permitted work<br />
Prohibited work<br />
Audit related<br />
Activities required by<br />
law or legislation to<br />
be undertaken by the<br />
Auditors;<br />
Reviews of interim<br />
financial information;<br />
Managed service reports<br />
to housing associations<br />
<strong>and</strong> local authorities.<br />
Non-audit related<br />
Tax compliance services;<br />
Tax advisory services;<br />
Public reporting on investment<br />
circulars <strong>and</strong> similar documents;<br />
Private reporting to sponsors <strong>and</strong><br />
similar parties in connection with<br />
investment circulars <strong>and</strong> similar<br />
documents;<br />
Employee benefit plan audits.<br />
Book-keeping <strong>and</strong> work related to the preparation of accounting records;<br />
Financial information system design or implementation;<br />
Appraisal <strong>and</strong> valuation services;<br />
Internal audit services;<br />
Actuarial services;<br />
Forensic work;<br />
Recruitment services;<br />
Secondment of staff to a supervisory or management position;<br />
Provision of investment advice, broking or legal services.<br />
62
TRAVIS PERKINS ANNUAL REPORT AND ACCOUNTS 2012<br />
Value of work<br />
Non-audit services require approval as follows:<br />
• Up to £5,000 – no formal approval is required provided the work is<br />
permitted under the list referred to on the previous page;<br />
• £5,000 to £25,000 – Finance Director;<br />
• £25,000 to £50,000 – Finance Director <strong>and</strong> Committee Chairman;<br />
• £50,000 <strong>and</strong> above – Finance Director <strong>and</strong> Committee Chairman<br />
following a competitive tender.<br />
Formal approval by the Committee is also required if the aggregated<br />
level of forecast fees for non-audit services exceeds 50% of the<br />
statutory audit fee.<br />
<strong>Report</strong>ing<br />
The Finance Director reports twice yearly to the Committee on fees<br />
for non-audit services payable to the auditors.<br />
As shown in note 5 to the accounts, during the year the Auditors were<br />
paid £431k (2011; £401k) for audit-related work, <strong>and</strong> £129k (2011:<br />
£299k) for non-audit work.<br />
The principal items of non-audit fees related to reviewing the<br />
Group’s interim announcement to shareholders <strong>and</strong> sundry tax<br />
advice. In view of Deloitte’s detailed underst<strong>and</strong>ing of the Group’s<br />
operations <strong>and</strong> accounting policies, <strong>and</strong> being mindful of future<br />
Auditor reporting obligations, the Audit Committee decided that it<br />
was appropriate for Deloitte to undertake this work. In addition, £347k<br />
(2011: £119k) of fees was paid to other accounting firms for non-audit<br />
work, including advice to the Remuneration Committee.<br />
The Committee underst<strong>and</strong>s that the total fees paid by the Group<br />
to Deloitte in 2012 amount to less than, 0.03% of Deloitte’s UK fee<br />
income <strong>and</strong> considers that the Auditors independence has not been<br />
impaired by the non-audit fees paid in 2012.<br />
Internal audit<br />
As well as its reviews of the internal audit department’s strategy<br />
<strong>and</strong> processes, as described above, during its meetings in 2012, the<br />
Committee received presentations from the Director of Business<br />
Risk <strong>and</strong> Assurance, about the results of work undertaken by the<br />
department, <strong>and</strong> approved its risk-based plans for work in 2013. The<br />
Committee was satisfied with the overall effectiveness of the internal<br />
audit function.<br />
Overview<br />
As a result of our work during the year, <strong>and</strong> taking into account the<br />
result of the Board <strong>and</strong> Committee evaluation process described on<br />
page 59, the Committee considers that it has acted in accordance<br />
with its terms of reference <strong>and</strong> has ensured the independence,<br />
objectivity <strong>and</strong> effectiveness of the external <strong>and</strong> internal auditors.<br />
The Committee has also concluded that the Group’s internal control<br />
<strong>and</strong> risk management systems were effective during the year.<br />
I will be available at the <strong>Annual</strong> General Meeting to answer any<br />
questions about the work of the Committee.<br />
Chris Bunker<br />
Chairman, Audit Committee<br />
GOVERNANCE<br />
63
Directors’ Remuneration <strong>Report</strong><br />
FOR THE YEAR ENDED 31 December 2012<br />
Introduction<br />
This report sets out the Group’s remuneration policies for its directors<br />
<strong>and</strong> senior executives <strong>and</strong> describes how those policies are applied in<br />
practice.<br />
Unaudited information<br />
Remuneration committee chairman’s statement<br />
Dear Shareholder,<br />
As an introduction to our remuneration report, I want to highlight the<br />
key features of our remuneration policy <strong>and</strong> describe how these relate<br />
to the strategic achievements of the Group. This executive summary<br />
will fall into three parts; the context of our remuneration approach,<br />
including strategic goals; pay <strong>and</strong> incentive challenges <strong>and</strong> outcomes<br />
in the year; <strong>and</strong> future priorities.<br />
Context<br />
We remain committed to a remuneration policy that provides value for<br />
shareholders whilst retaining <strong>and</strong> motivating top quality executives:<br />
• Remuneration should be competitive <strong>and</strong> contribute to the delivery<br />
of short <strong>and</strong> long-term shareholder value;<br />
• Remuneration should contain significant performance related<br />
incentive elements;<br />
• All colleagues should be able to share in the success of the Group<br />
through participation in both annual bonus schemes <strong>and</strong> longer<br />
term share plans.<br />
The key strategic achievements which have driven the share price<br />
from around £2.23 on 5 December 2008 to £12.52 at the time of<br />
writing this report were:<br />
• Decisive <strong>and</strong> robust implementation of an emergency plan to<br />
manage costs <strong>and</strong> trading margins through the worst downturn in<br />
construction in living memory;<br />
• Transformation of the Group, through acquisitions <strong>and</strong> superior<br />
organic growth, to become the largest UK distributor <strong>and</strong> retailer<br />
of building materials from its previous number 3 position in the<br />
market;<br />
• Development of a balanced business model, selling all main<br />
material types to all main customer types, reducing segment risk;<br />
• Creation of market leading propositions in our trading businesses,<br />
leading to market outperformance <strong>and</strong> providing a platform for<br />
growth through network expansion;<br />
• Development of online trading capabilities through acquisition <strong>and</strong><br />
expansion of the fastest growing national lightside multi-channel<br />
business, <strong>and</strong> use of this model to accelerate the multi-channel<br />
propositions of core businesses;<br />
• Creation of value adding shared central functions that support<br />
our trading businesses, capturing synergies across category<br />
management, buying, finance, supply chain <strong>and</strong> technology;<br />
• Strengthening management capabilities through the recruitment<br />
<strong>and</strong> development of members of the Group’s Executive Committee<br />
<strong>and</strong> middle management;<br />
• Adjusted EPS growth of 2.1%;<br />
• Free Cash flow generation of £242m.<br />
Our short <strong>and</strong> long term incentive performance measures are<br />
directly linked to driving <strong>and</strong> rewarding strategic growth initiatives<br />
<strong>and</strong> include the following; EPS, TSR, Cashflow, ROCE, <strong>and</strong> broader<br />
goals such as market share <strong>and</strong> health & safety.<br />
During the past 5 years, the basic salary increase of the executive<br />
committee <strong>and</strong> executive directors (other than through promotion )<br />
has averaged 2% p.a, in line with all other colleagues in the business.<br />
Over the same period only 37% of variable pay potential has been<br />
triggered, despite our management team’s superior performance<br />
relative to competitors, which reflects the depressed state of the<br />
construction market.<br />
Pay <strong>and</strong> incentive challenges <strong>and</strong> outcomes<br />
2012 was a very busy year for the Remuneration Committee. The<br />
full review of executive remuneration I mentioned in my statement<br />
last year was completed. As a result a number of changes were<br />
contemplated <strong>and</strong> we undertook an extensive consultation exercise<br />
with all our major shareholders. Further information on these<br />
proposals is attached in the separate letter from our Chairman. In<br />
addition, the Remuneration Committee needed to consider <strong>and</strong><br />
determine the appropriate salary increase to reflect the promotion<br />
of John Carter to Deputy Chief Executive as well as remuneration<br />
arrangements for Tony Buffin, our new Group Finance Director who<br />
joins in 2013, replacing Paul Hampden Smith who will retire from<br />
the Group in September 2013. Again, we consulted with our major<br />
shareholders on both matters <strong>and</strong> the outcomes are described below.<br />
Deputy Chief Executive Officer<br />
As indicated in last year’s report, we commissioned specific external<br />
benchmarking work to assist us in determining an appropriate<br />
remuneration package for John Carter’s new role. The Committee<br />
considered a number of factors including external market data from<br />
independent experts <strong>and</strong> agreed that his base salary should increase<br />
to £500,000 per annum with effect from the date of his appointment.<br />
The structure of his total remuneration package will remain<br />
unchanged. We consulted with our major shareholders on this matter<br />
<strong>and</strong> again, we were pleased that a majority supported this decision.<br />
New Group Finance Director<br />
Tony Buffin is due to join the company on 8 April 2013 as Group<br />
Finance Director. He was previously employed by a company in<br />
Australia <strong>and</strong> had significant awards of earned, but deferred, cash<br />
compensation which he forfeited when he resigned.<br />
The structure of his remuneration package with Travis Perkins<br />
will be the same as other executive directors. The only addition<br />
will be a special, one-off award of deferred shares granted to him<br />
because they were vital in securing his services. He will be required<br />
to invest from his own resources £500,000 in the Company’s shares<br />
<strong>and</strong> will, in return, receive a share award on a 2:1 basis, half of which<br />
will vest after 1 year from the award date <strong>and</strong> the balance vesting 2<br />
years from the award date, subject to continuing employment <strong>and</strong><br />
performance targets in relation to his function being met. Other<br />
terms of the award, which will be granted pursuant to the authority<br />
contained in Listing Rule 9.4.2 R(2), will reflect the terms of the<br />
2007 Share Matching Scheme. Full details of the award, as required<br />
by Listing Rule 9.4.3, will be disclosed in the next year’s Directors’<br />
Remuneration <strong>Report</strong>.<br />
It is important to note that this one-off award only partially<br />
compensates Mr. Buffin for the awards he has forfeited. Major<br />
64
TRAVIS PERKINS ANNUAL REPORT AND ACCOUNTS 2012<br />
shareholders consulted on this matter were generally very<br />
supportive of this arrangement.<br />
Other<br />
In line with all other colleagues at management grades in the group,<br />
Executive Directors were not awarded an increase in basic pay in<br />
January 2013. This means that for the sixth successive year the same<br />
basic salary increase percentage has been applied to all management<br />
levels. The Remuneration Committee has agreed to review the<br />
position again in July 2013, when all management may become<br />
entitled to an increase of 1.5%, being the award given to colleagues<br />
below management grades in January 2013. Any increase made<br />
during the year will not be backdated.<br />
The Committee is delighted that more than 1,300 colleagues<br />
benefited from another pay-out under the Group’s Sharesave Scheme.<br />
In addition to this, executives benefited from the partial vesting of<br />
awards under the Performance Share Plan (‘PSP’) <strong>and</strong>, for the first<br />
time, full vesting of awards under the Share Matching Scheme (‘SMS’).<br />
Our executive directors are entitled to awards of up to 27% of their<br />
maximum opportunity under the <strong>Annual</strong> Bonus Plan as a result<br />
of the Group partially meeting the targets set for 2012 (which are<br />
described in more detail later in this report). These targets were set at<br />
a more stretching level in 2012, evaluated by considering the likely<br />
value of risks <strong>and</strong> opportunities pertaining to the Group’s annual<br />
budget. In 2012, the net risks were valued at the outset of the year at<br />
a higher level than in previous years. In 2013, the level of stretch has<br />
increased yet further.<br />
• <strong>Annual</strong> bonuses for Executive Directors are linked to performance<br />
on EPS, ROCE <strong>and</strong> strategic developments. The relevant strategic<br />
achievements during 2012 were: Successful delivery against plans<br />
for the second year of integration of the BSS businesses, including<br />
over achievement of synergy targets <strong>and</strong> design <strong>and</strong> initial<br />
implementation of new IT systems based on Travis Perkins’ proven<br />
merchanting technology;<br />
• Continued growth <strong>and</strong> roll out of the Toolstation business <strong>and</strong><br />
branch network following acquisition of the remaining 70% of<br />
Toolstation’s equity in January 2012;<br />
• Further growth <strong>and</strong> deployment of Category Management, Global<br />
Sourcing <strong>and</strong> Supply Chain activities, achieving gross margin<br />
benefits ahead of plan, offsetting some margin pressure from an<br />
increasingly tough trading environment as the year progressed;<br />
• Development of strategic partnerships <strong>and</strong> investment in activities<br />
to position the Group strongly as a provider of sustainable building<br />
retrofit solutions ahead of the launch of the ‘Green Deal’;<br />
• Successfully trialling <strong>and</strong> launching a pilot for co-ordinated national,<br />
regional <strong>and</strong> area distribution facilities to support the phased<br />
introduction of multi-channel trading for all Group businesses.<br />
A proportion (20% of total bonus opportunity) of Executive Directors’<br />
<strong>and</strong> other senior managers’ bonuses are based on achievement<br />
of quantified targets on a balanced scorecard covering financial<br />
metrics, relative performance on sales, market share <strong>and</strong> returns,<br />
potential for growth, business capabilities <strong>and</strong> business quality. This<br />
scorecard identifies annual targets that lead to a five-year ambition<br />
for development <strong>and</strong> performance of the business. The Remuneration<br />
Committee judged that management achieved performance on<br />
this scorecard at 60% of potential, with particular shortfalls against<br />
stretching targets on metrics for health <strong>and</strong> safety, <strong>and</strong> cash flow<br />
return on invested capital. Executives are awarded a bonus within the<br />
range determined by the Remuneration Committee, with the position<br />
in the range determined by the behaviour <strong>and</strong> attitude displayed by<br />
each individual, as assessed by their superior <strong>and</strong> reviewed by the<br />
CEO, Deputy CEO <strong>and</strong> Group HR Director.<br />
Future priorities<br />
We intend to maintain a strong correlation between the strategic<br />
drivers for shareholder value creation <strong>and</strong> the metrics used for long<br />
term <strong>and</strong> short term incentive schemes. We will continuously seek<br />
to improve our communication with shareholders both through<br />
learnings <strong>and</strong> guidance from the final BIS proposals as well as the<br />
open dialogue with shareholders which has been very helpful in<br />
shaping our thinking over the last 12 months.<br />
Following the successful integration of the BSS group of<br />
companies, it was necessary to plan for the next stage of our<br />
development to ensure that remuneration continues to support<br />
our aim to build sustainable shareholder value <strong>and</strong> give our senior<br />
managers opportunities to share in our success.<br />
After a period of extensive consultation both internally <strong>and</strong><br />
externally with our major shareholders, the eventual proposal was<br />
as follows:<br />
“One change is proposed for variable pay. We plan to replace<br />
the current <strong>Annual</strong> Deferred Bonus Plan with a revised plan which<br />
does not increase the level of cash bonus potential, but provides an<br />
opportunity for an increased deferred share bonus. A material further<br />
condition that would be applied is that if the total shareholder return<br />
fails to meet future targets, that part of the bonus being delivered as a<br />
deferred share award would be subject to forfeiture conditions.<br />
Under our proposal, the executives cannot benefit from this<br />
element of annual bonus unless shareholders have the opportunity to<br />
benefit at the same time. We believe that these proposals represent a<br />
significantly more stringent <strong>and</strong> shareholder-oriented approach than<br />
found elsewhere.<br />
The remainder of the remuneration package will remain<br />
unchanged, although a significantly increased shareholding<br />
requirement for the executive directors is proposed of two times basic<br />
salary up from the current one times salary policy.”<br />
The full remuneration package is detailed in the policy table shown<br />
on pages 66 <strong>and</strong> 67.<br />
The Committee believes that the proposals, outlined above <strong>and</strong><br />
in full detail in the separate Chairman’s letter, will support the<br />
Company achieving its goals <strong>and</strong> we are pleased that a majority of the<br />
shareholders we consulted gave their support.<br />
In all, we had 30 discussions (either in person or teleconference)<br />
with 14 major shareholders <strong>and</strong> representative bodies.<br />
Our remuneration policy<br />
Our Remuneration Policy is first <strong>and</strong> foremost designed to support<br />
the group goal of creating shareholder value through consistently<br />
outperforming in our markets. With this in mind, we continue to<br />
focus our efforts on achieving the right blend of fixed <strong>and</strong> variable<br />
remuneration <strong>and</strong> ensuring that our senior executives are paid at<br />
a level appropriate to the size of our group. We are mindful of our<br />
responsibilities to other stakeholders, especially employees, <strong>and</strong><br />
GOVERNANCE<br />
65
Directors’ Remuneration <strong>Report</strong><br />
take into account remuneration elsewhere in the Group when setting<br />
pay for senior executives. A key principle applied for directors <strong>and</strong><br />
colleagues throughout the Group is that base salaries should be<br />
competitive <strong>and</strong> set at the median for the relevant comparator group.<br />
Appropriate levels of incentives are just as important. External<br />
guidance received indicates that over the longer term, more than 50%<br />
of total remuneration should be performance related. The framework<br />
we now have in place means that if all incentives vested at their<br />
maximum, 80% of total remuneration would be performance related.<br />
In determining our policy, all associated risks are considered, so that<br />
the overall remuneration structure <strong>and</strong> targets in incentive schemes<br />
do not give rise to any undue risk taking.<br />
We believe that it is important for all our most senior executives<br />
to build up a shareholding in the Company <strong>and</strong> so going forward we<br />
are increasing this requirement for Executive Directors to two times<br />
basic salary. Participation in our long term incentive schemes will be<br />
restricted or withdrawn if the required shareholding is not acquired<br />
<strong>and</strong> maintained. At 31 December 2012 all senior executives had<br />
exceeded their target level of holdings.<br />
We take into account a number of factors when setting targets for<br />
our incentive schemes. Taken together, they represent a balance that<br />
means executives should not be unduly rewarded for one-off, short<br />
term factors. Instead, performance over <strong>and</strong> above stretching targets<br />
should result in greater shareholder value <strong>and</strong>, in turn, higher rewards<br />
for executives.<br />
Remuneration elsewhere in the Group<br />
The Committee takes into account remuneration packages available<br />
to all colleagues when considering executive pay. As with many<br />
companies, senior management participate in a wider rage of<br />
incentives than the majority of colleagues. We recognise that we have<br />
to operate on this basis to attract <strong>and</strong> retain high-quality managers.<br />
All colleagues are entitled to a competitive remuneration package<br />
that includes basic pay, bonus, pension, Sharesave, Buy as You<br />
Earn shares, colleague discount, a range of ‘voluntary benefits’, taxefficient<br />
childcare vouchers <strong>and</strong> paid annual leave. We have recently<br />
taken steps to ensure that all colleagues will have life insurance<br />
cover in 2013.<br />
The Group operates a number of pension schemes <strong>and</strong> is in the<br />
process of streamlining these arrangements as pensions autoenrolment<br />
approaches. Over 10,000 colleagues are active members<br />
of a Group pension scheme. Contribution rates made by the Group<br />
range from 1% to 20% of salary under the defined contribution<br />
scheme whilst over 2,400 colleagues are active members of a defined<br />
benefit scheme where company contribution rates will be 10.3%<br />
for the BSS Group scheme <strong>and</strong> 13.1% for the Travis Perkins scheme.<br />
None of the executive directors are active members of a company<br />
pension scheme, primarily as a consequence of recent changes in<br />
tax rules. Instead, the Company pays a gross cash allowance at 25%<br />
of salary. As this allowance is fully taxed, unlike the contributions to<br />
an approved pension scheme, the equivalent net benefit for executive<br />
directors is currently 12% of salary.<br />
Key elements of remuneration<br />
Purpose <strong>and</strong><br />
link to strategy Operation Performance metrics<br />
Base salary<br />
Core element of<br />
total package,<br />
essential to support<br />
recruitment <strong>and</strong><br />
retention of top<br />
quality executives.<br />
Reviewed annually as at 1 January. Factors influencing<br />
decisions include:<br />
· Role, experience <strong>and</strong> individual performance;<br />
· Total group salary budgets;<br />
· Pay awards elsewhere in the Group;<br />
· External market;<br />
· General economic environment.<br />
Benchmarked against FTSE 75-125 companies <strong>and</strong> sector.<br />
None.<br />
Benefits<br />
Maintain<br />
competitive<br />
package with range<br />
of benefits for the<br />
director <strong>and</strong> their<br />
family<br />
Directors are entitled to:<br />
· Private medical insurance ;<br />
· Income protection;<br />
· <strong>Annual</strong> leave – 28 days;<br />
· Fully expensed company car, or cash alternative;<br />
· Life insurance at 5 times salary.<br />
None.<br />
Pension<br />
Help executives<br />
provide for<br />
retirement. Aids<br />
retention.<br />
No director actively participates in a defined benefit<br />
pension scheme. A cash allowance at 25% (gross) of base<br />
salary is paid to each director. This is subject to statutory<br />
deductions <strong>and</strong> results in a net benefit of 12% of salary.<br />
None.<br />
66
TRAVIS PERKINS ANNUAL REPORT AND ACCOUNTS 2012<br />
Purpose <strong>and</strong><br />
link to strategy Operation Performance metrics<br />
Deferred share bonus plan<br />
Rewards<br />
achievement of<br />
annual financial<br />
<strong>and</strong> key business<br />
strategy objectives.<br />
Rewards personal<br />
performance<br />
measured against<br />
key objectives.<br />
Deferred element<br />
encourages longer<br />
term shareholding.<br />
Clawback <strong>and</strong><br />
forfeiture provisions<br />
discourage excessive<br />
risk taking <strong>and</strong><br />
short term outlook<br />
ensuring that<br />
executive <strong>and</strong><br />
shareholder interests<br />
are aligned.<br />
Targets are set annually in line with the<br />
performance metrics (see aside).<br />
Relative weighting of metrics subject to<br />
discretion of Committee annually.<br />
Total bonus level is determined after the year<br />
end, based on achievement of targets.<br />
50% of the total bonus will be paid in cash within<br />
4 months of the year end.<br />
Remainder of total bonus deferred in share bonus<br />
bank. No withdrawals from bonus bank until<br />
after year 2.<br />
From year 3, annual withdrawal of 50% of shares<br />
held in bonus bank.<br />
Shares in bonus bank subject to clawback <strong>and</strong><br />
forfeiture.<br />
For 2013 the maximum opportunity will be<br />
CEO 180%<br />
DCEO 150%<br />
GFD 150%<br />
There will be no increases to these percentages in<br />
future years without prior shareholder approval.<br />
Bonus measures <strong>and</strong> weightings:<br />
EPS 50%<br />
ROCE 30%<br />
Business strategy 20%<br />
Financial targets based on group <strong>Annual</strong> Operating Plan<br />
(‘AOP’) with no bonus paid if outcome is less than 95% of AOP.<br />
The target bonus levels are 50% of the maximum.<br />
Shares held in the bonus bank are subject to forfeiture if target<br />
share prices are not achieved. Target share prices are based<br />
upon the average share price during the bonus year inclusive<br />
of a compounded long-term equity rate of return (currently<br />
8%).<br />
The banked shares are split into two equal tranches. Tranche<br />
1 vests if after one year, by comparison to the highest 30 day<br />
average share price during the period, the target share price<br />
is met. If the target share price is not met 50% of tranche 1 is<br />
forfeited.<br />
Tranche 2 vests if after two years, by comparison to the<br />
highest 30 day average share price during the period, the<br />
target share price is met. If the target share price is not met at<br />
the end of two years 50% of tranche 2 is forfeited.<br />
In determining achievement of target share prices dividends<br />
paid per share during the period will be added.<br />
Performance share plan<br />
Incentivises<br />
participants to<br />
deliver key financial<br />
targets over a longer<br />
term.<br />
Helps retain top<br />
quality executives.<br />
Share matching scheme<br />
Awards, in the form of nil-cost options, are made<br />
annually to participants.<br />
Awards vest after 3 years subject to achievement<br />
of performance measures (see aside).<br />
Participants will only participate if they meet the<br />
shareholding requirements set by the Committee.<br />
The maximum annual award for all executive<br />
directors is 150% of salary.<br />
Performance measures <strong>and</strong> weightings are:<br />
EPS growth 40%<br />
Aggregate cashflow 40%<br />
Relative TSR 20%<br />
Cashflow targets are set for each award based on the Group’s<br />
projections for the next 3 years.<br />
From 2013 TSR awards made will be measured against the<br />
FTSE 50 to 150 index better reflecting the position of the<br />
business.<br />
EPS growth has to be a minimum of 3% p.a. in addition to RPI<br />
over 3 years with full vesting at 10% p.a. plus RPI.<br />
GOVERNANCE<br />
Encourages<br />
participants to build<br />
up a shareholding in<br />
the company.<br />
Incentivises<br />
participants to<br />
deliver key financial<br />
targets over a longer<br />
term.<br />
Helps retain top<br />
quality executives.<br />
Participants are invited to participate annually.<br />
Each participant buys shares from their own<br />
resources with a value of up 50% of their post-tax<br />
base salary.<br />
Matching share award on a 2:1 basis made to<br />
each participant.<br />
Matching share award is in the form a nil-cost<br />
option which will vest after 3 years subject to<br />
achievement of performance target (see aside).<br />
Performance target is Cash Return on Capital Employed<br />
(CROCE).<br />
Vesting range is based on company’s projections for next 3<br />
years.<br />
Shareholding requirements<br />
Aligns the interests<br />
of executives <strong>and</strong><br />
shareholders.<br />
Formal requirements (not voluntary guidelines)<br />
apply to directors <strong>and</strong> senior executives.<br />
Participation in long-term incentives will be<br />
scaled back, or withheld, if the requirements are<br />
not met <strong>and</strong> maintained.<br />
From 2013, executive directors are required to hold<br />
shares valued at two times salary within 5 years.<br />
None.<br />
67
Directors’ Remuneration <strong>Report</strong><br />
Remuneration in 2012<br />
<strong>Annual</strong> bonus<br />
The performance measures were the same as for 2011. The targets <strong>and</strong> results are as follows:<br />
Measure Weighting Target range Achieved<br />
EPS 50% 95% - 105% 15%<br />
ROCE 30% 95% - 105% Nil<br />
Personal objectives * 20% 0% - 20% 12%<br />
*<br />
The evaluation of personal objectives involved the Remuneration Committee considering personal development <strong>and</strong> performance by the Executive<br />
Directors on a balanced scorecard of measures, including the following main topics:<br />
• Market outperformance;<br />
• Risk monitoring;<br />
• Health <strong>and</strong> safety;<br />
• Integration of BSS;<br />
• Global sourcing initiatives;<br />
• Category management capability;<br />
• Supply chain optimisation;<br />
• Succession.<br />
The Remuneration Committee assessed the specific achievements against these objectives by reviewing the detailed measures attached to each<br />
one as well as reviewing the performance of each director overall. More detail on the specific achievements <strong>and</strong> shortfalls was described earlier in<br />
the Remuneration <strong>Report</strong>. The annual bonus for each of the executive directors is as follows:<br />
% bonus Full bonus cash bonus Deferred in shares<br />
John Carter 27% £135,000 £101,250 33,750<br />
Geoff Cooper 32.4% £211,312 £158,484 52,828<br />
Paul Hampden-Smith 27% £105,867 £79,400 26,467<br />
Long term incentives<br />
This is the first time for five years where all employees participating in share plans have been able to share in the Group’s success through<br />
achieving stretching performance targets <strong>and</strong> delivering increased shareholder value.<br />
Performance share plan<br />
The targets set in 2009 were met partially <strong>and</strong> 80.0% of the awards vested in 2012. This is the first time such awards have vested in the last five<br />
years.<br />
Share matching scheme<br />
There was full vesting of the awards made in 2009. This is the first full vesting of these awards in the last five years.<br />
All employee share plans<br />
Over 1,300 colleagues shared a pay-out of approximately £6m under the Sharesave scheme. None of the executive directors received this benefit<br />
as their savings <strong>and</strong> share options under the scheme do not mature until December 2013.<br />
Remuneration for 2013<br />
As described above, the only significant change to the remuneration structure is the Replacement Deferred Share Bonus Plan. Full details of the<br />
new scheme are set out in a separate resolution 14.<br />
Basic salaries<br />
Basic salaries are reviewed annually for each director <strong>and</strong> are normally set with reference to individual performance, experience <strong>and</strong> contribution<br />
together with developments in the relevant employment market, internal relativities <strong>and</strong> reference to the general economic environment; it is this<br />
last point which has outweighed all others in determining pay awards for 2013.<br />
68
TRAVIS PERKINS ANNUAL REPORT AND ACCOUNTS 2012<br />
From 1 January 2013, the executive directors’ salaries remain unchanged from 2012:<br />
• John Carter £500,000;<br />
• Geoff Cooper £652,200;<br />
• Paul Hampden Smith £392,100.<br />
As described in the introduction to this report, the position will be reviewed in July 2013, but any increase at that time will not exceed 1.5% <strong>and</strong><br />
will not be backdated.<br />
<strong>Annual</strong> bonus<br />
As described in detail above, the executive directors will participate in the Replacement Deferred Share Bonus Plan. The maximum award will<br />
be 180% for the CEO <strong>and</strong> 150% for the other executive directors. 50% of the full bonus will be paid in cash after the year end <strong>and</strong> the remainder<br />
will be held in shares deferred for at least 2 years <strong>and</strong> subject to a total shareholder return target. The new plan will be extended to the Executive<br />
Committee members in 2014.<br />
Performance share plan<br />
The maximum award levels will be 150% of basic salary for each of the executive directors. The performance targets will again be Aggregate<br />
Cashflow, Relative Total Shareholder Return (‘TSR’) <strong>and</strong> adjusted Earnings per Share (‘EPS’) with the same relative weighting as last year.<br />
Measure Rationale Weighting<br />
EPS growth<br />
A reasonable <strong>and</strong> well understood proxy for an increase in shareholder value<br />
for the benefit of all shareholders, provided undue leverage is controlled. 40%<br />
Aggregate cashflow Reinforces importance of cash generation at a time when the Group<br />
wishes to reduce the financial leverage taken on in respect of acquisitions. 40%<br />
Relative TSR External measure of shareholder value. 20%<br />
Measure Target Detail Range<br />
EPS growth RPI + 3% p.a. 30% vests<br />
RPI + 10% p.a.<br />
100% vests<br />
Straight-line between these points<br />
Aggregate cashflow over Three aggregate cash flow targets £766.7m - £847.4m<br />
three years up to 2015 No vesting below lower target<br />
Straight line increase until full vesting at upper target<br />
Company TSR relative to Upper (top 50%) 30% vests<br />
FTSE 50 - 150 Index Upper quartile (top 25%) 100% vests<br />
Straight-line between these points<br />
GOVERNANCE<br />
The earnings per share targets are calculated on a compound annual basis <strong>and</strong> include the increase in the Retail Prices Index (‘RPI’). Increases in<br />
RPI have been well above 3% in recent years <strong>and</strong> the outlook remains uncertain. If RPI reduces to average 3% over the next 3 years, the aggregate<br />
EPS growth will have to be 44% in 3 years time for this part of the award to vest in full. Given the current economic climate, this would represent<br />
an outst<strong>and</strong>ing achievement.<br />
The three-year targets for aggregate cash flow <strong>and</strong> CROCE below reflect a poorer market outlook for construction than the prior year. However,<br />
the targets require a more stretching performance when taken into account as part of the 3 year rolling forecast targets.<br />
Share matching scheme<br />
Once again the maximum investment will be 50% of post-tax salary <strong>and</strong> the other features of the scheme will also be unchanged. The performance<br />
target will be Cash Return on Capital Employed (‘CROCE’).<br />
Measure Rationale Range matching ratio<br />
CROCE Reinforces importance of cash generation <strong>and</strong> 0.6 for 1<br />
Return on capital employed 8.68% - 9.60% 2 for 1<br />
Straight-line between the two<br />
69
Directors’ Remuneration <strong>Report</strong><br />
Expected value of total remuneration package<br />
The following charts show the split between fixed <strong>and</strong> variable remuneration excluding benefits in kind for ‘on-target’ performance <strong>and</strong><br />
‘maximum’ performance.<br />
Fixed cash Bonus LTIPs<br />
CEO – target 28% 13% 59%<br />
CEO – maximum 19% 17% 64%<br />
DCEO/FD – target 30% 11% 59%<br />
DCEO/FD – max 20% 15% 65%<br />
Non-executive directors<br />
The remuneration of the non-executive directors is determined by the Board (in the case of the Chairman, on the recommendation of the<br />
Remuneration Committee). Each non-executive director receives an annual fee. In addition, Chris Bunker receives additional fees for chairing the<br />
Audit Committee <strong>and</strong> until 8th January 2013 for the role of Senior Independent Director in which he was succeeded by John Coleman. Andrew<br />
Simon also receives fees for chairing the Remuneration <strong>and</strong> Health & Safety Committees. The fees were last reviewed in 2011 <strong>and</strong> were set as:<br />
• Base fee – £50,000 p.a.<br />
• Additional fee for Senior Independent Director – £7,000 p.a.<br />
• Additional fee for committee chairmanship – £10,000 p.a.<br />
• Additional fee for second committee chairmanship – £4,000 p.a.<br />
We plan to review non-executive directors’ fees during 2013.<br />
Non-executive directors do not receive any other benefits (other than a staff discount card for purchasing products) <strong>and</strong> are not eligible to join<br />
a company pension scheme. No compensation is payable on termination of their employment, which may be without notice from the Company.<br />
They cannot participate in any of the Company’s share schemes.<br />
Who attends remuneration committee meetings<br />
During the year the Committee comprised Andrew Simon (Chairman), Chris Bunker, John Coleman, Philip Jansen <strong>and</strong> Robert Walker all of whom<br />
are independent non-executive directors.<br />
The Committee met 9 times in 2012. Attendance at the meetings is shown on page 57.<br />
The Committee is responsible for the broad policy on directors’ <strong>and</strong> senior executives’ remuneration. It determines all aspects of the remuneration<br />
packages of the executive directors <strong>and</strong> reviews, with the Chief Executive, the remuneration packages of other senior executives. It also oversees the<br />
administration of the share schemes. The Committee’s terms of reference are available on our website or from the Company Secretary.<br />
PwC LLP was appointed by the Committee to provide it with advice during the year on executive remuneration. A different specialist area of PwC<br />
LLP provided advice in connection with the Toolstation br<strong>and</strong> valuation. In addition, Geoff Cooper (Chief Executive), Paul Hampden Smith (Finance<br />
Director), Andrew Pike (Group Company Secretary), Carol Kavanagh (Group Human Resources Director) <strong>and</strong> Stella Girvin (Deputy Company<br />
Secretary) have assisted the Committee in its work, but never in respect of their own remuneration. The Committee keeps itself fully informed of<br />
relevant developments <strong>and</strong> best practice in remuneration matter <strong>and</strong> seeks advice where appropriate from external advisors.<br />
Total shareholder return<br />
150%<br />
100%<br />
50%<br />
Travis Perkins plc FTSE 250<br />
0%<br />
2007 2008 2009 2010<br />
2011 2012<br />
Audited information<br />
Contracts of executive directors<br />
Each of the executive directors has a service contract, the date of which is shown below, which will be available for inspection at the <strong>Annual</strong><br />
General Meeting. These contracts provide for six month’s notice from the directors <strong>and</strong> 12 month’s notice from the Company. They do not specify<br />
any particular level of compensation in the event of termination or change of control.<br />
John Carter 6 August 2001<br />
Geoff Cooper 1 February 2005<br />
Paul Hampden Smith 8 October 1996 (retired on 28 February 2013)<br />
70
TRAVIS PERKINS ANNUAL REPORT AND ACCOUNTS 2012<br />
In addition, Tony Buffin has a service contract which will take effect from 8 April 2013.<br />
It is the Company’s policy to allow each executive director to hold one non-executive directorship in another company (<strong>and</strong> to retain the fee<br />
payable).<br />
Amount of directors’ emoluments<br />
Part of each executive director’s remuneration may consist of benefits in kind not payable in cash, such as the provision of a company car, a fuel<br />
card, <strong>and</strong> private healthcare insurance. No director receives an expense allowance, which is chargeable to tax. Details of directors’ remuneration<br />
are set out in the table below.<br />
B basic salary <strong>Annual</strong> bonus Benefits in kind Total remuneration<br />
2012 2012 2012 2012 2011<br />
£’000 £’000 £’000 £’000 £’000<br />
Executive<br />
Geoff Cooper 1 652 211 164 1,027 1,389<br />
Paul Hampden Smith 2 392 106 116 614 756<br />
John Carter 3 500 135 159 794 807<br />
Non-executive<br />
Ruth Anderson 50 - - 50 9<br />
Chris Bunker 67 - - 67 67<br />
John Coleman 50 - - 50 50<br />
Philip Jansen 50 - - 50 50<br />
Andrew Simon 64 - - 64 64<br />
Robert Walker 200 - - 200 200<br />
2,025 452 439 2,916 3,392<br />
Notes:<br />
1. Highest paid director - Benefits include a cash allowance of £163,050 (2011: £159,851) in lieu of pension accrual. This does not count when calculating annual bonus <strong>and</strong><br />
granting share incentives. Geoff Cooper also received, <strong>and</strong> retained, in 2012, £100,000 (2011: £100,000) in respect of his non-executive chairmanship of Dunelm Group Plc.<br />
2. Benefits include a £16,000 ‘cash for car’ allowance, a £1,500 fuel allowance <strong>and</strong> £98,025 cash allowance in lieu of pension accrual, which do not count when calculating<br />
annual bonus <strong>and</strong> granting share incentives. Paul Hampden Smith also received, <strong>and</strong> retained, in 2012, £41,250 (2011: £45,000) in respect of his non-executive directorship<br />
of Redrow plc.<br />
3. Benefits include a cash allowance of £125,000 in lieu of pension accrual which does not count when calculating annual bonus <strong>and</strong> granting share incentives.<br />
4. Gains on options exercised during 2012 were: Paul Hampden Smith £210,328.05, John Carter £177,787.51. Gains on options exercised during 2011 were: Paul Hampden<br />
Smith £277,140.72, John Carter £77,430.00, Geoff Cooper £135,504.36.<br />
Directors’ pension entitlements<br />
Pension entitlements of the executive directors during the year were as follows:<br />
John Carter Paul Hampden Smith Geoff Cooper<br />
Age at 31 December 2012 51 52 58<br />
GOVERNANCE<br />
£’000 £’000 £’000<br />
Accrued pension at 31 December 2011 including revaluation if applicable 258 83 5<br />
Accrued pension at 31 December 2012 including revaluation if applicable 264 87 5<br />
Increase in accrued pension in 2012 6 4 -<br />
Real increase in accrued pension in 2012 - - -<br />
Transfer value of the real increase in accrued pension net of member’s contributions - - -<br />
Value of increase in accrued benefit - - 5<br />
Member’s contributions towards pension - - -<br />
Increase in transfer value net of member’s contributions 49 17 9<br />
Transfer value of benefits accrued at 31 December 2011 5,089 1,642 135<br />
Transfer value of benefits accrued at 31 December 2012 5,138 1,659 144<br />
Notes:<br />
1. Geoff Cooper ceased future accrual on 5 April 2006, but benefits up to that date retain a link to current salary.<br />
2. John Carter ceased future accrual on 31 December 2010. Benefits on leaving were calculated using a 3 year averaging of pensionable salaries.<br />
3. Paul Hampden Smith ceased future accrual on 31 March 2011. Benefits on leaving were calculated using a 3 year averaging of pensionable salaries.<br />
4. Any pensions paid on early retirement are subject to abatement.<br />
71
Directors’ Remuneration <strong>Report</strong><br />
Travis Perkins’ share price information<br />
2012 2011<br />
Mid-market price at the year end 1,088p 796p<br />
Highest mid-market price during the year 1,149p 1,127p<br />
Average mid-market price during the year 1,024p 928p<br />
Lowest mid-market price during the year 794p 711p<br />
Directors’ shareholdings<br />
The Directors’ holdings of ordinary 10p shares of Travis Perkins plc at 27 March 2013, 31 December 2012 <strong>and</strong> 31 December 2011 were as follows:<br />
2013 2012 2011<br />
27 March * 31 December 31 December<br />
Director Interest No. No. No.<br />
Ruth Anderson beneficial owner 1,000 1,000 -<br />
Chris Bunker beneficial owner 11,900 11,900 11,900<br />
John Carter beneficial owner 73,837 73,436 61,918<br />
John Coleman beneficial owner 2,465 2,465 2,465<br />
Geoff Cooper beneficial owner 120,570 132,190 195,053<br />
Paul Hampden Smith beneficial owner 53,916 99,944 283,933<br />
Philip Jansen beneficial owner - - -<br />
Andrew Simon beneficial owner 3,400 3,400 3,400<br />
Robert Walker beneficial owner 82,333 82,333 80,595<br />
*<br />
The figures for P. Hampden Smith are as at 28 February 2013, the date of his resignation as a director.<br />
Share matching scheme<br />
Participation by directors in investment matching shares is as follows:<br />
Outst<strong>and</strong>ing Granted Outst<strong>and</strong>ing Vested<br />
1 January 2012 during year 31 December 2012 during year<br />
Grant date No. No. No. No.<br />
Geoff Cooper<br />
1 April 2008 53,033 - 53,033 -<br />
19 May 2009 157,785 - 157,785 157,785<br />
16 March 2010 71,853 - 71,853 -<br />
15 March 2011 65,580 - 65,580 -<br />
14 March 2012 - 60,536 60,536 -<br />
Paul Hampden Smith<br />
1 April 2008 37,121 - 37,121 -<br />
19 May 2009 110,450 - 110,450 110,450<br />
16 March 2010 50,296 - 50,296 -<br />
15 March 2011 39,424 - 39,424 -<br />
14 March 2012 - 36,396 36,396 -<br />
John Carter<br />
19 May 2009 63,974 - 63,974 63,974<br />
16 March 2010 50,296 - 50,296 -<br />
15 March 2011 39,424 - 39,424 -<br />
14 March 2012 - 36,396 36,396 -<br />
4 December 2012 - 9,676 9,676 -<br />
Notes:<br />
1. Vesting is on the third anniversary of the grant date.<br />
2. Award/purchase prices (restated for the rights issue as appropriate) are: 19 May 2009, 553p, 16 March 2010, 740p, 15 March 2011, 968p, 14 March 2012 1,069p<br />
3. Performance criteria apply. For the share matching shares granted in 2009, which vested during 2012, minimum vesting required CROCE of 6.45%, <strong>and</strong> full vesting required<br />
8.82%. The Award vested in full. For investment matching shares granted in 2010, 2011 <strong>and</strong> 2012 a condition based on a three-year average of cash return on capital<br />
employed (‘CROCE’) applies as described on page 69. For 2010 the target range was 7.5% - 9.0%, for 2011 the target range was 10.75% to 11.89% <strong>and</strong> for 2012 the target<br />
range was 9.53% to 10.53%.<br />
4. The 4 December 2012 grant in respect of John Carter related to the backdated pay increase as described on page 64.<br />
72
TRAVIS PERKINS ANNUAL REPORT AND ACCOUNTS 2012<br />
Performance share plan<br />
Participation by directors is as follows:<br />
Outst<strong>and</strong>ing Granted Lapsed Outst<strong>and</strong>ing Vested<br />
Grant date 1 January 2012 during year during year 31 December 2012 during year<br />
No. No. No. No. No.<br />
Geoff Cooper<br />
23 June 2009 131,289 - (26,258) 105,031 105,031<br />
5 March 2010 92,437 - - 92,437 -<br />
4 March 2011 75,224 - - 75,224 -<br />
4 April 2011 18,605 - - 18,605 -<br />
2 March 2012 - 90,082 - 90,082 -<br />
Paul Hampden Smith<br />
23 June 2009 76,585 - (15,317) 61,268 61,268<br />
5 March 2010 53,921 - - 53,921 -<br />
4 March 2011 37,686 - - 37,686 -<br />
4 April 2011 18,642 - - 18,642 -<br />
2 March 2012 - 54,157 - 54,157 -<br />
John Carter<br />
23 June 2009 76,585 - (15,317) 61,268 61,268<br />
5 March 2010 53,921 - - 53,921 -<br />
4 March 2011 37,686 - - 37,686 -<br />
4 April 2011 18,642 - - 18,642 -<br />
2 March 2012 - 54,157 - 54,157 -<br />
4 December 2012 - 14,548 - 14,548 -<br />
Notes:<br />
1. Vesting is on the third anniversary of the grant date.<br />
2. Award prices (restated for the 2009 rights issue as appropriate) are: 23 June 2009, 473p, 5 March 2010, 695.5p, 4 March 2011, 1,020p, 4 April 2011, 1,031p. 2 March 2012,<br />
1,085p, 4 December 2012, 1,121p<br />
3. Performance criteria apply. For performance shares granted in 2009, vesting was at 80%. Performance conditions for the 2010 award are: vesting is at 30% if EPS exceeds<br />
inflation by 3% a year, TSR is in the top 50% of the FTSE 250 <strong>and</strong> Aggregate Cashflow is at least £470m, vesting is at 100% if EPS exceeds inflation by 10% a year, TSR is in<br />
the top 25% <strong>and</strong> Aggregate cash flow is at least £520m. There is a straight-line vesting between these points. Conditions for the 2011 <strong>and</strong> 2012 award performance were the<br />
same as 2010 except the range for Aggregate cash flow is £844m to £977m for 2011 <strong>and</strong> £761m to £841m for 2012.<br />
4. The 4 December 2012 grant in respect of John Carter related to the backdated pay increase as described on page 64.<br />
Deferred share bonus plan<br />
Participation by directors is as follows:<br />
Outst<strong>and</strong>ing Granted Outst<strong>and</strong>ing<br />
1 Jan 2012 During year 31 Dec 2012<br />
No. No. No.<br />
GOVERNANCE<br />
Geoff Cooper<br />
3 March 2010 19,862 - 19,862<br />
2 March 2011 16,729 - 16,729<br />
2 March 2012 - 18,180 18,180<br />
Paul Hampden Smith<br />
3 March 2010 11,586 - 11,586<br />
2 March 2011 9,496 - 9,496<br />
2 March 2012 - 8,626 8,626<br />
John Carter<br />
3 March 2010 11,586 - 11,586<br />
2 March 2011 9,496 - 9,496<br />
2 March 2012 - 9,106 9,106<br />
Notes:<br />
1. Vesting is on the third anniversary of the grant date.<br />
2. The award price for the 3 March 2010 grant was 801.1667p,for the 2 March 2011 grant was 987.3p <strong>and</strong> for the 2012 grant was 800.9737p.<br />
73
Directors’ Remuneration <strong>Report</strong><br />
Executive share options<br />
Participation by directors in the 2001 Executive Share Option Scheme is as follows:<br />
Outst<strong>and</strong>ing Exercised Outst<strong>and</strong>ing<br />
. 1 Jan 2012 during year 31 Dec 2012<br />
No. No. No. Exercise price Exercise period<br />
Geoff Cooper 17,980 - 17,980 1,320p Anytime until 31/3/15<br />
Paul Hampden Smith 39,368 (39,368) - 845p<br />
51,994 (51,994) - 841p<br />
23,787 - 23,787 1,033p Anytime until 15/3/14<br />
10,489 - 10,489 1,320p Anytime until 31/3/15<br />
John Carter 37,296 (37,296) - 845p<br />
41,594 (41,594) - 841p<br />
22,058 - 22,058 1,033p Anytime until 15/3/14<br />
10,487 - 10,487 1,320p Anytime until 31/3/15<br />
Share award for John Carter<br />
Grant date<br />
Outst<strong>and</strong>ing 1 Jan <strong>and</strong> 31 Dec 2012<br />
No.<br />
10 November 2009 47,612<br />
Notes:<br />
1. The one off Award structured as a nil cost share option was made following consultation with principal shareholders in 2009.<br />
2. The Award vests in equal tranches after completion of years four, five <strong>and</strong> six, the first year being 2009.<br />
3. The performance conditions are linked to procurement improvement initiatives agreed annually by the Remuneration Committee together with delivery of John Carter’s<br />
objectives as part of Travis Perkins’ strategic plan.<br />
Sharesave options<br />
Participation by directors in the 2002 Travis Perkins’ Sharesave Scheme is as follows:<br />
Outst<strong>and</strong>ing 1 Jan <strong>and</strong> 31 Dec 2012<br />
No.<br />
Geoff Cooper 3,670<br />
Paul Hampden Smith 3,670<br />
John Carter 3,670<br />
Notes:<br />
1. No performance conditions apply.<br />
2. All options are exercisable from 1 December 2013 to 31 May 2014 at a price of 442p (restated for the 2009 rights issue).<br />
Share dilution<br />
At 31 December 2012, shares under grant for executive share schemes over a 10 year period represented 2.82% of issued share capital <strong>and</strong> shares<br />
under grant for all employee share schemes over the previous 10 years represented 5.37%. There were 5,024,649 (2.05% of issued share capital)<br />
unallocated shares <strong>and</strong> 289,142 allocated shares (0.12%) held in the employee trust.<br />
Shareholders’ approval<br />
The directors confirm that this report has been drawn up in accordance with the requirements of the Companies Act 2006 <strong>and</strong> the UK Corporate<br />
Governance Code.<br />
The shareholders will be invited to approve the remuneration policy set out in this report at the <strong>Annual</strong> General Meeting, at which the<br />
Chairman of the Committee will be available to answer any questions.<br />
Approved by the Board <strong>and</strong> signed on its behalf by:<br />
Andrew Simon<br />
Chairman Remuneration Committee<br />
74
TRAVIS PERKINS ANNUAL REPORT AND ACCOUNTS 2012<br />
Nominations Committee <strong>Report</strong><br />
FOR THE YEAR ENDED 31 December 2012<br />
Just as the Audit Committee is responsible for monitoring the<br />
performance <strong>and</strong> condition of the Group’s financial <strong>and</strong> physical<br />
assets, so the Nominations Committee is responsible for monitoring<br />
the performance, appropriateness <strong>and</strong> future succession of the<br />
Group’s executive <strong>and</strong> Board talent. Reflecting this importance, the<br />
Nominations Committee has met as frequently as the Board’s other<br />
major committees over the past two years. The Committee met five<br />
times in 2012 <strong>and</strong> comprises myself as Chair, Chris Bunker <strong>and</strong> John<br />
Coleman, although all the other Non-Executive Directors also came<br />
to the meetings. Frequent attendees at the meetings were the Group’s<br />
Chief Executive <strong>and</strong> Group HR Director, depending on the relevance of<br />
the issues under discussion.<br />
The principal role of the Nominations Committee is to identify,<br />
<strong>and</strong> nominate for Board approval, c<strong>and</strong>idates to fill Board vacancies<br />
as <strong>and</strong> when they arise. Of course, these days it is more <strong>and</strong> more<br />
important to plan for Board <strong>and</strong> executive succession well in advance,<br />
in order to ensure smooth succession <strong>and</strong> ensure that the Group’s<br />
Board <strong>and</strong> executive leadership skills are fully aligned to the Group’s<br />
long term strategy.<br />
In planning these appointments, the Nominations Committee will:<br />
• Prepare a full description of the role, skills <strong>and</strong> capabilities<br />
required;<br />
• Appoint external search firms, each time reviewing alternative<br />
options, <strong>and</strong> ensuring that the chosen firm has signed up to the<br />
relevant industry codes, for example, on diversity;<br />
• Engage with the Group’s major shareholders on future skill<br />
requirements <strong>and</strong> ideas for potential c<strong>and</strong>idates.<br />
A further important role for the Committee is to ensure that there<br />
is a continuous pipeline of high performing <strong>and</strong> executive talent<br />
at the two levels below executive director. These discussions<br />
would normally take place at least once a year. In this sense, the<br />
Nominations Committee has a broader HR function.<br />
The focus of the Committee’s work in 2012 was on four topics:<br />
• The search for a high calibre c<strong>and</strong>idate to succeed Paul Hampden<br />
Smith as Group CFO, given his intention to retire. Russell Reynolds<br />
was chosen, after considering a number of alternatives, to<br />
conduct the search <strong>and</strong> was given a wide remit <strong>and</strong> dem<strong>and</strong>ing<br />
specification, covering both the UK <strong>and</strong> international markets,<br />
private equity as well as plc companies. We were delighted to<br />
announce the appointment of Tony Buffin, who will join the Group<br />
on April 8 2013; Tony was previously Group CFO at the £20bn<br />
revenue Coles Group in Australia;<br />
• Detailed plans for the further personal development of John<br />
Carter, following his appointment as Deputy Chief Executive.<br />
All our Non Executive Directors were individually <strong>and</strong><br />
collectively involved in contributing to John’s development,<br />
as well as specifically tailored courses;<br />
• A performance review of new hires <strong>and</strong> new appointments to the<br />
Group below executive director level <strong>and</strong> the available pipeline of<br />
internal talent feeding into those management levels;<br />
• Approval for future use of new service contracts that take into<br />
account recent legal <strong>and</strong> corporate governance developments.<br />
In the coming year, the focus of the Committee’s work will switch to<br />
planning the future Non Executive membership of the Board. This<br />
is because three of our current NEDs are due for retirement in the<br />
next three years <strong>and</strong> in addition, Philip Jansen has decided to retire<br />
from the Board after the <strong>Annual</strong> General Meeting because of his<br />
other executive commitments. We plan to conduct a comprehensive<br />
assessment of the Board’s skills, given our long-term strategy, to<br />
ensure that our future NEDs are fully able to complement <strong>and</strong><br />
support the executive leadership. In leading this process on the<br />
Nominations Committee, I will be discussing this skills assessment<br />
with each of our major investors, seeking their input <strong>and</strong> where<br />
possible their suggestions as to possible nominees.<br />
Importantly, we will also continue the development work<br />
undertaken in 2012 on preparing for future senior executive<br />
succession.<br />
As Chairman of the Committee, I will be available at the <strong>Annual</strong><br />
General Meeting to answer any questions about the Committee’s work.<br />
Robert Walker<br />
Chairman<br />
GOVERNANCE<br />
75
Directors’ <strong>Report</strong><br />
FOR THE YEAR ENDED 31 December 2012<br />
The Directors present their annual report <strong>and</strong> audited accounts<br />
for the year ended 31 December 2012. The Corporate Governance<br />
statement on pages 57 to 60 forms part of the Directors’ report.<br />
Principal activities<br />
Travis Perkins is one of the largest builder’s merchants <strong>and</strong> home<br />
improvement retailers in the UK. The principal activities of the Group<br />
are the sale of timber, building materials, <strong>and</strong> plumbing <strong>and</strong> heating<br />
products, <strong>and</strong> the hiring of tools, to the building trade, industry<br />
generally <strong>and</strong> the general public, within the United Kingdom. The<br />
Directors are not aware, at the date of this report, of any likely major<br />
changes in the Group’s activities in the next year.<br />
Business review<br />
A review of the Group’s position, developments <strong>and</strong> future prospects<br />
is contained in the Chairman’s statement on pages 18 <strong>and</strong> 19, the<br />
Chief Executive’s review of the year on pages 20 to 28, the Deputy<br />
Chief Executive’s review of the year on pages 30 to 36 <strong>and</strong> the Finance<br />
Director’s review of the year on pages 38 to 43. A review of the Group’s<br />
environmental performance is on pages 46 to 49.<br />
Results <strong>and</strong> dividends<br />
The Group results for the year ended 31 December 2012 <strong>and</strong> dividends<br />
for the year ending 31 December 2012 are set out on page 82. If<br />
approved, the final dividend will be paid on 30 May 2013 to those<br />
shareholders on the register at the close of business on 3 May 2013.<br />
Balance sheet <strong>and</strong> post balance sheet events<br />
The balance sheet on pages 84 <strong>and</strong> 85 shows the Group’s financial<br />
position. No significant events have occurred since the balance<br />
sheet date.<br />
Principal risks <strong>and</strong> uncertainties<br />
A review of the Group’s principal risks <strong>and</strong> uncertainties are on pages<br />
44 <strong>and</strong> 45.<br />
Financial risk management<br />
Details of the Group’s approach to capital management <strong>and</strong> the<br />
alleviation of risk through the use of financial instruments are<br />
given in the Finance Director’s Review of the Year on pages 38 to<br />
43. Specific quantitative information on borrowings <strong>and</strong> financial<br />
instruments is given in notes 23 <strong>and</strong> 24 on pages 112 to 118 of the<br />
annual financial statements.<br />
Directors <strong>and</strong> their interests<br />
In accordance with the Company’s Articles of Association, Tony<br />
Buffin will be st<strong>and</strong>ing for election by shareholders at the <strong>Annual</strong><br />
General Meeting, having been appointed to the Board since the last<br />
<strong>Annual</strong> General Meeting. The Board believes that Tony Buffin’s<br />
exceptionally strong track record in financial management, corporate<br />
finance <strong>and</strong> in creating <strong>and</strong> achieving organic growth strategies will<br />
greatly benefit the Company, complement the skills of the other<br />
Board members, <strong>and</strong> make him an excellent choice as Group Finance<br />
Director. His biographical details are set out on page 54.<br />
The UK Corporate Governance Code (‘the Code’) requires that<br />
all directors of FTSE 350 companies are subject to re-election at<br />
the Company’s <strong>Annual</strong> General Meeting each year, <strong>and</strong> therefore<br />
executive directors, Geoff Cooper <strong>and</strong> John Carter, <strong>and</strong> non executive<br />
directors Robert Walker, Chris Bunker, John Coleman, Andrew<br />
Simon <strong>and</strong> Ruth Anderson will all seek re-election at the <strong>Annual</strong><br />
General Meeting. Philip Jansen will not seek re-election because as<br />
explained on page 58 he will be retiring from the Board at the end of<br />
the meeting.<br />
After 22 years in senior finance roles, including the last 17 years<br />
as the Company’s Group Financial Director, Paul Hampden Smith<br />
resigned as a director on 28 February 2013. He has agreed to continue<br />
in our employment until September 2013, to ensure a smooth <strong>and</strong><br />
complete h<strong>and</strong>over to his successor, Tony Buffin.<br />
The names of the Directors at 31 December 2012, together with<br />
their biographical details are set out on pages 54 <strong>and</strong> 55. All of these<br />
Directors held office throughout the year. Tony Buffin was appointed<br />
with effect from 8 April 2013. The executive directors have rolling 12<br />
month notice periods in their contracts. The non executive directors<br />
do not have service contracts. In the light of the formal evaluation of<br />
their performances as a result of the process described on page 58,<br />
Robert Walker, Chairman, confirms on behalf of the Board that all<br />
directors continue to be effective in, <strong>and</strong> committed to, their roles.<br />
Directors <strong>and</strong> officers of the Company are entitled to be<br />
indemnified out of the assets of the Company in respect of any<br />
liability incurred in relation to the affairs of the Company, or any<br />
associate company, to the extent the law allows. In this regard,<br />
the Company is required to disclose that under article 140 of the<br />
Company’s Articles of Association, the Directors have the benefit of<br />
an indemnity, to the extent permitted by the Companies Act 2006<br />
against liabilities incurred by them in the execution of their duties<br />
<strong>and</strong> exercise of their powers. This indemnity is currently in force. In<br />
addition, if proceedings against directors are instituted subsequent<br />
to any person acquiring control of the Company, the Company has<br />
agreed with each of the Directors that pursuant to article 140(D) of<br />
the Company’s Articles of Association, the Company shall provide<br />
a Director with funds (subject to certain restrictions) to meet<br />
expenditure incurred by that Director in defending any criminal or<br />
civil proceedings.<br />
A copy of the Company’s Articles of Association (which contains<br />
this indemnity) is available for inspection at the Company’s<br />
registered office during normal business hours <strong>and</strong> will be available<br />
for inspection at (<strong>and</strong> during the period of 30 minutes prior to) the<br />
Company’s forthcoming <strong>Annual</strong> General Meeting.<br />
None of the Directors had an interest in any contract to which the<br />
Company or any of its subsidiaries was a party during the year.<br />
The Company has undertaken to comply with the best practice<br />
on approval of directors’ conflicts of interests in accordance with the<br />
Company’s Articles of Association. These provisions have operated<br />
effectively. Under the Companies Act 2006, a director must avoid a<br />
situation where he has, or can have, a direct or indirect interest that<br />
conflicts, or possibly may conflict, with the Company’s interests.<br />
The disclosable interests of Directors at 31 December 2012,<br />
including holdings, if any, of spouses <strong>and</strong> of children aged under 18,<br />
were as detailed in the Directors’ Remuneration <strong>Report</strong> on pages 72<br />
to 74.<br />
76
TRAVIS PERKINS ANNUAL REPORT AND ACCOUNTS 2012<br />
Substantial shareholdings<br />
As at 31 December 2012, the Company had been notified of the<br />
following interests amounting to 3% or more of the voting rights in<br />
the issued ordinary share capital of the Company.<br />
Number %<br />
Scottish Widows Investment Partnership Ltd 14,858,234 6.08%<br />
Sprucegrove Investment Management Ltd 13,506,856 5.53%<br />
Pzena Investment Management LLC 10,080,127 4.13%<br />
Investec Ltd. 9,159,663 3.75%<br />
Dimensional Fund Advisors LP 9,022,439 3.69%<br />
S<strong>and</strong>erson Asset Management Ltd 8,926,940 3.65%<br />
Legal & General Investment<br />
Management Ltd (UK) 8,735,399 3.57%<br />
St<strong>and</strong>ard Life Investments Ltd 7,891,153 3.23%<br />
AXA Investment Managers UK 7,559,946 3.09%<br />
As at 27 March 2013, the Company had been notified of the<br />
following interests amounting to 3% or more of the voting rights in<br />
the issued ordinary share capital of the Company.<br />
Number %<br />
Nominations Committee report. The Company has an equal<br />
opportunities policy aimed at ensuring that employment decisions<br />
are based on ability <strong>and</strong> potential regardless of gender, race, colour,<br />
ethnic origin, sexual orientation, age or disability. In particular,<br />
applications for employment by disabled persons are always fully<br />
considered, bearing in mind the aptitudes of the person concerned.<br />
In the event of a member of staff becoming disabled, every effort is<br />
made to ensure that their employment with the Group continues<br />
<strong>and</strong> that appropriate training is arranged. It is the policy of the<br />
Company that the training, career development <strong>and</strong> promotion of<br />
disabled persons should, as far as possible, be identical to that of<br />
other employees.<br />
The Group’s policies <strong>and</strong> practices have been designed to<br />
keep employees informed on matters relevant to them as<br />
employees through regular meetings <strong>and</strong> newsletters. Employee<br />
representatives are consulted regularly on a wide range of matters<br />
affecting their interests. All employees with more than three months’<br />
service are eligible to participate in the Company’s Sharesave<br />
<strong>and</strong> Buy As You Earn plans. Details are provided in the Directors’<br />
Remuneration <strong>Report</strong>.<br />
Political donations<br />
The Group did not give any money for political purposes nor did it<br />
make any donations to political organisations or incur any political<br />
expenditure during the year.<br />
Scottish Widows Investment Partnership Ltd 16,068,747 6.56%<br />
Sprucegrove Investment Management Ltd 13,413,946 5.48%<br />
TIAA Group 10,058,410 4.11%<br />
Pzena Investment Management LLC 9,298,675 3.80%<br />
Dimensional Fund Advisors LP 9,097,983 3.71%<br />
S<strong>and</strong>erson Asset Management Ltd 8,949,207 3.65%<br />
Legal & General Investment<br />
Management Ltd (UK) 8,569,743 3.50%<br />
AXA S.A. 8,404,654 3.43%<br />
Investec Ltd 7,751,263 3.16%<br />
Morgan Stanley & Co Inc 7,435,324 3.04%<br />
Close company status<br />
The close company provisions of the Income <strong>and</strong> Corporation Taxes<br />
Act 1988 do not apply to the Company.<br />
Employees <strong>and</strong> charitable donations<br />
Statements on these matters are contained in the Chief Executive’s<br />
review of the year on pages 20 to 28 <strong>and</strong> in the Deputy Chief<br />
Executive’s review of the year on page 35.<br />
Details of the number of employees <strong>and</strong> related costs can be found<br />
in note 7 to the financial statements.<br />
The Company is committed to equality of opportunity <strong>and</strong><br />
recognises the benefit of diversity within its workforce. Its approach<br />
to the matter of diversity on company boards is set out in the<br />
Supplier payment policy<br />
The Group’s policy is to pay all of its suppliers in accordance with<br />
established terms. Group trade creditors at 31 December 2012<br />
represented 53 days (31 December 2011: 57 days) of average<br />
purchases of goods <strong>and</strong> services. The Company’s trade creditors at 31<br />
December 2012 represented 30 days (2011: 30 days).<br />
Auditor<br />
Resolutions to re-appoint Deloitte LLP as the Company’s auditor <strong>and</strong><br />
to authorise the Directors to fix the auditor’s remuneration will be<br />
proposed at the <strong>Annual</strong> General Meeting.<br />
Statement on disclosure of information to the auditor<br />
Each of the persons who is a director at the date of approval of this<br />
report confirms that:<br />
• So far as the director is aware, there is no relevant audit<br />
information of which the Company’s auditor is unaware; <strong>and</strong><br />
• The director has taken all reasonable steps that he ought to have<br />
taken as a director in order to make himself aware of any relevant<br />
audit information <strong>and</strong> to establish that the Company’s auditor is<br />
aware of that information.<br />
This confirmation is given <strong>and</strong> should be interpreted in accordance<br />
with the provisions of section 418 of the Companies Act 2006.<br />
Share capital <strong>and</strong> change of control<br />
As at 31 December 2012 the Company had an allotted <strong>and</strong> fully paid<br />
share capital of 244,853,057 ordinary shares of 10 pence each, with<br />
an aggregate nominal value of £24,485,306 (including shares owned<br />
by the employee share ownership trust). The ordinary shares are<br />
GOVERNANCE<br />
77
Directors’ <strong>Report</strong><br />
listed on the London Stock Exchange. All the shares rank pari passu.<br />
The rights <strong>and</strong> obligations attaching to the shares are set out in the<br />
Company’s Articles of Association. Fully paid shares in the Company<br />
are freely transferable. There are no persons that hold securities<br />
carrying special rights with regard to the control of the Company.<br />
Details of the structure of the Company’s share capital <strong>and</strong> changes<br />
in the share capital during the year are also included in note 20 to the<br />
financial statements.<br />
As at 31 December 2012 The Travis Perkins Employee Share<br />
Ownership Trust owned 5,313,791 shares in the Company (2.17%<br />
of issued share capital) for use in connection with the Company’s<br />
share schemes. Any voting or other similar decisions relating to those<br />
shares would be taken by the trustees, who may take account of any<br />
recommendation of the Company.<br />
There are no restrictions on voting rights attaching to the<br />
Company’s ordinary shares. The Company is not aware of any<br />
agreements between holders of securities that may result in<br />
restrictions on the transfer of securities or on voting rights.<br />
The rules governing the appointment <strong>and</strong> replacement of board<br />
members <strong>and</strong> changes to the Articles of Association accord with<br />
usual English company law provisions. The powers of the Company’s<br />
Directors are set out in the Company’s Articles of Association. In<br />
particular, the Board has the power to issue shares <strong>and</strong> to purchase its<br />
own shares <strong>and</strong> is seeking renewal of these powers at the forthcoming<br />
<strong>Annual</strong> General Meeting in accordance with the restrictions <strong>and</strong><br />
within the limits set out in the notice of that meeting.<br />
There are a number of agreements to which the Company is<br />
a party that may take effect, alter or terminate upon a change<br />
of control following a takeover bid. None of these agreements is<br />
considered significant in the context of the Company as a whole.<br />
There are no agreements providing for compensation for Directors<br />
or employees on change of control. As set out in the Directors<br />
Remuneration <strong>Report</strong> on page 70, service contracts for executive<br />
directors do not specify any particular level of compensation in the<br />
event of termination following change of control of the Company. As<br />
noted above, the Company has agreed with each of the Directors that<br />
it shall provide a director with funds (subject to certain restrictions)<br />
to meet expenditure incurred in defending any criminal or civil<br />
proceedings if such proceedings are instituted subsequent to any<br />
person acquiring control of the Company.<br />
<strong>Annual</strong> general meeting<br />
The <strong>Annual</strong> General Meeting of the Company will be held at<br />
Northampton Rugby Football Club, Franklin’s Gardens, Weedon<br />
Road, Northampton, NN5 5BG on Thursday 23 May 2013 at 12.00<br />
noon. A buffet lunch will be available. In addition to the resolutions<br />
to approve the receipt of the Company’s annual accounts, the<br />
declaration of a final dividend, the appointment <strong>and</strong> re-appointment<br />
of the Company’s directors, the re-appointment of the Company’s<br />
auditor <strong>and</strong> to give the directors authority to fix the auditor’s<br />
remuneration, the following items are to be proposed at the<br />
forthcoming <strong>Annual</strong> General Meeting. The Board considers that all of<br />
the resolutions proposed are in the best interests of the company <strong>and</strong><br />
of its shareholders as a whole <strong>and</strong> unanimously recommends that<br />
shareholders vote in favour of all resolutions put before the <strong>Annual</strong><br />
General Meeting.<br />
Resolution 13:<br />
Directors’ remuneration report<br />
In accordance with the section 439 of the Companies Act 2006,<br />
this resolution seeks shareholders’ approval of the Directors’<br />
Remuneration <strong>Report</strong> as set out on pages 64 to 74. This vote is<br />
advisory <strong>and</strong> the directors’ entitlement to receive remuneration is not<br />
conditional on it<br />
Resolution 14:<br />
Replacement deferred share bonus plan amendments<br />
This resolution seeks shareholder approval of the replacement<br />
Deferred Share Bonus Plan (amending the existing Plan following the<br />
review of executive remuneration referred to on page 65). A description<br />
of the Plan is set out in the Chairman’s letter which has been sent to<br />
shareholders with the notice of the <strong>Annual</strong> General Meeting.<br />
Resolution 15:<br />
Renewal of authority to allot shares<br />
Paragraph (a) of this resolution would give the Directors the authority<br />
to allot ordinary shares up to an aggregate nominal amount equal<br />
to £8,166,764 (representing 81,667,644 ordinary shares of 10 pence<br />
each). This amount represents approximately one-third of the issued<br />
ordinary share capital of the Company as at 27 March 2013, the latest<br />
practicable date prior to publication of this Notice.<br />
In line with guidance issued by the Association of British Insurers<br />
(the ‘ABI’), paragraph (b) of this resolution would give the Directors<br />
authority to allot ordinary shares in connection with a rights issue<br />
in favour of ordinary shareholders up to an aggregate nominal<br />
amount equal to £16,333,529 (representing 163,335,288 ordinary<br />
shares of 10p each), as reduced by the nominal amount of any shares<br />
issued under paragraph (a) of this resolution. This amount (before<br />
any reduction) represents approximately two-thirds of the issued<br />
ordinary share capital of the Company as at 27 March 2013, the latest<br />
practicable date prior to publication of this Notice. The authorities<br />
sought under paragraphs (a) <strong>and</strong> (b) of this resolution will expire at<br />
the earlier of 30 June 2014 (the last date by which the Company must<br />
hold an annual general meeting in 2014) <strong>and</strong> the conclusion of the<br />
annual general meeting of the Company held in 2014. If this authority<br />
is exercised, the Directors intend to follow ABI guidance issued from<br />
time to time, including as to the re-election of directors. It is now our<br />
practice to propose all directors for annual re-election at each <strong>Annual</strong><br />
General Meeting in accordance with the Code.<br />
The Directors have no present intention to exercise either of the<br />
authorities sought under this resolution, except, under paragraph (a), to<br />
satisfy options under the Company’s employee share option schemes.<br />
78
TRAVIS PERKINS ANNUAL REPORT AND ACCOUNTS 2012<br />
Resolution 16:<br />
Limited authority to allot shares for cash<br />
This resolution would give the Directors the authority to allot<br />
ordinary shares (or sell any ordinary shares which the Company<br />
elects to hold in treasury) for cash without first offering them to<br />
existing shareholders in proportion to their existing shareholdings.<br />
Except as provided in the next paragraph, this authority would be<br />
limited to allotments or sales in connection with pre-emptive offers<br />
<strong>and</strong> offers to holders of other equity securities if required by the<br />
rights of those shares or as the board otherwise considers necessary,<br />
or otherwise up to an aggregate nominal amount of £1,225,015<br />
(representing 12,250,147 ordinary shares). This aggregate nominal<br />
amount represents approximately 5% of the issued ordinary share<br />
capital of the Company as at 27 March 2013, the latest practicable<br />
date prior to publication of this Notice. In respect of this aggregate<br />
nominal amount, the Directors confirm their intention to follow<br />
the provisions of the Pre-Emption Group’s Statement of Principles<br />
regarding cumulative usage of authorities within a rolling 3-year<br />
period where the Principles provide that usage in excess of 7.5%<br />
should not take place without prior consultation with shareholders.<br />
Allotments made under the authorisation in paragraph (b) of<br />
resolution 15 would be limited to allotments by way of a rights<br />
issue only (subject to the right of the board to impose necessary<br />
or appropriate limitations to deal with, for example, fractional<br />
entitlements <strong>and</strong> regulatory matters).<br />
The authority will expire at the earlier of 30 June 2014 (the last<br />
date by which the Company must hold an <strong>Annual</strong> General Meeting<br />
in 2014) <strong>and</strong> the conclusion of the <strong>Annual</strong> General Meeting of the<br />
Company held in 2014. Any issue of shares for cash will, however, still<br />
be subject to the requirements of the UK Listing Authority.<br />
Resolution 17:<br />
Notice of meetings<br />
The Companies Act 2006 requires that the notice period for general<br />
meetings of a company is 21 days unless certain requirements are<br />
satisfied, including that shareholders approve a shorter notice period,<br />
which cannot be less than 14 clear days. At the <strong>Annual</strong> General<br />
Meeting held in 2012, shareholders approved a notice period for<br />
general meetings (other than AGMs) of not less than 14 clear days<br />
effective until the AGM to be held in 2013. This resolution is proposed<br />
to allow the Company to continue to call general meetings (other<br />
than AGMs) on 14 clear days notice. The Directors believe it is in the<br />
best interests of the shareholders of the Company to preserve the<br />
shorter notice period <strong>and</strong> accordingly are putting this resolution,<br />
to be proposed as a special resolution to the meeting. The shorter<br />
notice period would not be used as a matter of routine for general<br />
meetings, but only where the flexibility is merited by the business<br />
of the meeting <strong>and</strong> is thought to be to the advantage of shareholders<br />
as a whole. Examples of when it might be appropriate to call a<br />
general meeting at 14 days notice include when emergency capital<br />
raising proposals or other price sensitive transactions are being put<br />
to shareholders for approval. The approval will be effective until the<br />
Company’s <strong>Annual</strong> General Meeting in 2014, when it is expected that<br />
a similar resolution will be proposed. Under the Companies Act 2006<br />
in order to be able to call a general meeting on less than 21 clear<br />
days notice, the Company must make a means of electronic voting<br />
available to all shareholders.<br />
Resolution 18:<br />
Authority to purchase own shares<br />
The authority for the Company to purchase its own shares of 10<br />
pence each granted at last year’s <strong>Annual</strong> General Meeting will<br />
expire on the date of the forthcoming <strong>Annual</strong> General Meeting. The<br />
Directors wish to renew this authority <strong>and</strong> a special resolution, which<br />
is set out in full in the Notice of <strong>Annual</strong> General Meeting on page<br />
132, will be proposed at the forthcoming <strong>Annual</strong> General Meeting<br />
to give the Company the authority to purchase its own ordinary<br />
shares in the market as permitted by the Companies Act 2006. The<br />
authority limits the number of shares that could be purchased to a<br />
maximum of 24,500,293 (representing 10% of the issued ordinary<br />
share capital of the Company as at 27 March 2013) <strong>and</strong> sets<br />
minimum <strong>and</strong> maximum prices. This authority will expire no later<br />
than 30 June 2014.<br />
The Directors consider that it is in the best interests of<br />
the Company to have available this authorisation, in case of<br />
circumstances when it would be appropriate to use it. They would<br />
only use it after consideration of the effect on earnings per share <strong>and</strong><br />
the longer-term benefit for the Company <strong>and</strong> shareholders generally.<br />
The fact that such authorisation is being sought should not be taken<br />
to imply that shares would be purchased at any particular price<br />
or indeed at all. Any ordinary shares purchased pursuant to this<br />
authority may either be held as treasury shares or cancelled by the<br />
Company, depending on which course of action is considered by the<br />
Directors to be in the best interests of shareholders at the time.<br />
As at 27 March 2013, there were options over 12,485,868 ordinary<br />
shares in the capital of the Company, which represent 5.1% of the<br />
Company’s issued ordinary share capital (excluding any treasury<br />
shares). If the authority to purchase the Company’s ordinary shares<br />
were exercised in full, these options would represent 5.66% of the<br />
Company’s issued ordinary share capital (excluding any treasury<br />
shares). As at 27 March 2013, the Company did not hold any treasury<br />
shares in the Company <strong>and</strong> no warrants over ordinary shares in the<br />
capital of the Company existed.<br />
By order of the Board,<br />
Andrew Pike<br />
Company Secretary<br />
3 April 2013<br />
GOVERNANCE<br />
79
Statement of Directors’ Responsibilities<br />
FOR THE YEAR ENDED 31 December 2012<br />
The Directors are responsible for preparing the <strong>Annual</strong> <strong>Report</strong> <strong>and</strong><br />
the financial statements in accordance with applicable law <strong>and</strong><br />
regulations.<br />
Company law requires the Directors to prepare such financial<br />
statements for each financial year. Under that law the Directors are<br />
required to prepare the group financial statements in accordance<br />
with International Financial <strong>Report</strong>ing St<strong>and</strong>ards (IFRSs) as adopted<br />
by the European Union <strong>and</strong> Article 4 of the IAS Regulation <strong>and</strong> have<br />
also chosen to prepare the parent company financial statements<br />
under IFRSs as adopted by the European Union. Under company<br />
law the Directors must not approve the accounts unless they are<br />
satisfied that they give a true <strong>and</strong> fair view of the state of affairs of the<br />
Company <strong>and</strong> of the profit or loss of the Company for that period.<br />
In preparing these financial statements, International Accounting<br />
St<strong>and</strong>ard 1 requires that directors:<br />
• Properly select <strong>and</strong> apply accounting policies;<br />
• Present information, including accounting policies, in a manner<br />
that provides relevant, reliable, comparable <strong>and</strong> underst<strong>and</strong>able<br />
information;<br />
• Provide additional disclosures when compliance with the<br />
specific requirements in IFRSs are insufficient to enable users to<br />
underst<strong>and</strong> the impact of particular transactions, other events<br />
<strong>and</strong> conditions on the entity’s financial position <strong>and</strong> financial<br />
performance; <strong>and</strong><br />
• Make an assessment of the Company’s ability to continue as a<br />
going concern.<br />
The Directors are responsible for keeping adequate accounting<br />
records that are sufficient to show <strong>and</strong> explain the Company’s<br />
transactions <strong>and</strong> disclose with reasonable accuracy at any time the<br />
financial position of the Company <strong>and</strong> enable them to ensure that<br />
the financial statements comply with the Companies Act 2006. They<br />
are also responsible for safeguarding the assets of the Company <strong>and</strong><br />
hence for taking reasonable steps for the prevention <strong>and</strong> detection of<br />
fraud <strong>and</strong> other irregularities.<br />
The Directors are responsible for the maintenance <strong>and</strong> integrity of<br />
the corporate <strong>and</strong> financial information included on the Company’s<br />
website. Legislation in the United Kingdom governing the preparation<br />
<strong>and</strong> dissemination of financial statements may differ from legislation<br />
in other jurisdictions.<br />
Directors’ responsibility statement<br />
We confirm that to the best of our knowledge:<br />
1. The financial statements, prepared in accordance with<br />
International Financial <strong>Report</strong>ing St<strong>and</strong>ards as adopted by the EU,<br />
give a true <strong>and</strong> fair view of the assets, liabilities, financial position<br />
<strong>and</strong> profit or loss of the Company <strong>and</strong> the undertakings included in<br />
the consolidation taken as a whole; <strong>and</strong><br />
2.. The management report, which is incorporated into the Directors’<br />
report, includes a fair review of the development <strong>and</strong> performance<br />
of the business <strong>and</strong> the position of the Company <strong>and</strong> the<br />
undertakings included in the consolidation taken as a whole,<br />
together with a description of the principal risks <strong>and</strong> uncertainties<br />
that they face.<br />
By order of the Board<br />
Geoff Cooper<br />
Chief Executive<br />
John Carter<br />
Deputy Chief Executive<br />
80
TRAVIS PERKINS ANNUAL REPORT AND ACCOUNTS 2012<br />
Independent Auditor’s <strong>Report</strong> to the Members of Travis Perkins plc<br />
FOR THE YEAR ENDED 31 December 2012<br />
We have audited the financial statements of Travis Perkins plc<br />
for the year ended 31 December 2012 which comprise Group<br />
<strong>and</strong> Parent Company Income Statements, the Group <strong>and</strong> Parent<br />
Company Statements of Comprehensive Income, the Group <strong>and</strong><br />
Parent Company Balance Sheets, the Group <strong>and</strong> Parent Company<br />
Statements of Changes in Equity, the Group <strong>and</strong> Parent Company<br />
Cash Flow Statements <strong>and</strong> the related notes 1 to 37. The financial<br />
reporting framework that has been applied in their preparation is<br />
applicable law <strong>and</strong> International Financial <strong>Report</strong>ing St<strong>and</strong>ards<br />
(‘IFRSs’) as adopted by the European Union.<br />
This report is made solely to the Company’s members, as a body,<br />
in accordance with Chapter 3 of Part 16 of the Companies Act 2006.<br />
Our audit work has been undertaken so that we might state to the<br />
Company’s members those matters we are required to state to them<br />
in an auditor’s report <strong>and</strong> for no other purpose. To the fullest extent<br />
permitted by law, we do not accept or assume responsibility to anyone<br />
other than the Company <strong>and</strong> the Company’s members as a body, for<br />
our audit work, for this report, or for the opinions we have formed.<br />
Respective responsibilities of directors <strong>and</strong> auditor<br />
As explained more fully in the Directors’ Responsibilities Statement,<br />
the Directors are responsible for the preparation of the financial<br />
statements <strong>and</strong> for being satisfied that they give a true <strong>and</strong> fair view.<br />
Our responsibility is to audit <strong>and</strong> express an opinion on the financial<br />
statements in accordance with applicable law <strong>and</strong> International<br />
St<strong>and</strong>ards on Auditing (UK <strong>and</strong> Irel<strong>and</strong>). Those st<strong>and</strong>ards require us<br />
to comply with the Auditing Practices Board’s Ethical St<strong>and</strong>ards for<br />
Auditors.<br />
Scope of the audit of the financial statements<br />
An audit involves obtaining evidence about the amounts <strong>and</strong><br />
disclosures in the financial statements sufficient to give reasonable<br />
assurance that the financial statements are free from material<br />
misstatement, whether caused by fraud or error. This includes an<br />
assessment of: whether the accounting policies are appropriate to<br />
the Group’s <strong>and</strong> the Parent Company’s circumstances <strong>and</strong> have been<br />
consistently applied <strong>and</strong> adequately disclosed; the reasonableness<br />
of significant accounting estimates made by the Directors; <strong>and</strong><br />
the overall presentation of the financial statements. In addition,<br />
we read all the financial <strong>and</strong> non-financial information in the<br />
annual report to identify material inconsistencies with the audited<br />
financial statements. If we become aware of any apparent material<br />
misstatements or inconsistencies we consider the implications for<br />
our report.<br />
• The financial statements have been prepared in accordance with<br />
the requirements of the Companies Act 2006 <strong>and</strong>, as regards the<br />
Group financial statements, Article 4 of the IAS Regulation.<br />
Separate opinion in relation to IFRSs as issued by the IASB<br />
As explained in note 1 to the group financial statements, the Group<br />
in addition to complying with its legal obligation to apply IFRSs as<br />
adopted by the European Union, has also applied IFRSs as issued by<br />
the International Accounting St<strong>and</strong>ards Board (IASB).<br />
In our opinion the group financial statements comply with IFRSs<br />
as issued by the IASB.<br />
Opinion on other matters prescribed by the Companies Act 2006<br />
In our opinion:<br />
• The part of the Directors’ Remuneration <strong>Report</strong> to be audited has<br />
been properly prepared in accordance with the Companies Act<br />
2006; <strong>and</strong><br />
• The information given in the Directors’ <strong>Report</strong> for the financial year<br />
for which the financial statements are prepared is consistent with<br />
the financial statements.<br />
Matters on which we are required to report by exception<br />
We have nothing to report in respect of the following:<br />
Under the Companies Act 2006 we are required to report to you if,<br />
in our opinion:<br />
• Adequate accounting records have not been kept by the Parent<br />
Company, or returns adequate for our audit have not been received<br />
from branches not visited by us; or<br />
• The Parent Company financial statements <strong>and</strong> the part of the<br />
Directors’ Remuneration <strong>Report</strong> to be audited are not in agreement<br />
with the accounting records <strong>and</strong> returns; or<br />
• Certain disclosures of directors’ remuneration specified by law are<br />
not made; or<br />
• We have not received all the information <strong>and</strong> explanations we<br />
require for our audit.<br />
Under the Listing Rules we are required to review:<br />
• The Directors’ statement, contained within the Finance Director’s<br />
review of the year, in relation to going concern;<br />
• The part of the Corporate Governance Statement relating to<br />
the Company’s compliance with the nine provisions of the UK<br />
Corporate Governance Code specified for our review; <strong>and</strong><br />
• Certain elements of the report to shareholders by the Board on<br />
directors’ remuneration.<br />
GOVERNANCE<br />
Opinion on financial statements<br />
In our opinion:<br />
• The financial statements give a true <strong>and</strong> fair view of the state of<br />
the Group’s <strong>and</strong> of the Parent Company’s affairs as at 31 December<br />
2012 <strong>and</strong> of the Group’s <strong>and</strong> the Parent Company’s profit for the<br />
year then ended;<br />
• The financial statements have been properly prepared in<br />
accordance with IFRSs as adopted by the European Union; <strong>and</strong><br />
Colin Hudson FCA (Senior statutory auditor)<br />
for <strong>and</strong> on behalf of Deloitte LLP<br />
Chartered Accountants <strong>and</strong> Statutory Auditor<br />
London, United Kingdom<br />
3 April 2013<br />
81
Income Statements<br />
FOR THE YEAR ENDED 31 December 2012<br />
The Group<br />
–––––––––––––––––––––––––––––––––––––––––––––––––––––––––––––––––––––––––––––––––––––––––––––––––––––––––––––––<br />
2012 2011<br />
–––––––––––––––––––––––––––––––––––––––––––––––––––– ––––––––––––––––––––––––––––––––––––––––––––––––––––<br />
Pre-exceptional Exceptional Pre-exceptional Exceptional<br />
items items Total items items Total<br />
Notes £m £m £m £m £m £m<br />
Revenue 4 4,844.9 - 4,844.9 4,779.1 - 4,779.1<br />
Operating profit before amortisation 5 326.6 (8.7) 317.9 313.2 (9.8) 303.4<br />
Amortisation of intangible assets (17.4) - (17.4) (12.9) - (12.9)<br />
Operating profit 309.2 (8.7) 300.5 300.3 (9.8) 290.5<br />
Exceptional investment income 5 - 39.5 39.5 - - -<br />
Finance income 9 13.8 - 13.8 22.4 - 22.4<br />
Finance costs 9 (40.5) - (40.5) (38.9) (4.4) (43.3)<br />
Profit before tax 282.5 30.8 313.3 283.8 (14.2) 269.6<br />
Tax 10 (69.2) 15.5 (53.7) (74.5) 17.3 (57.2)<br />
Profit for the year 213.3 46.3 259.6 209.3 3.1 212.4<br />
Earnings per ordinary share 11<br />
Basic 108.9p 90.3p<br />
Diluted 105.0p 87.3p<br />
Total dividend declared<br />
per ordinary share 12 25.0p 20.0p<br />
All results relate to continuing operations. Details of exceptional items are given in notes 5, 9 <strong>and</strong> 10.<br />
The Company<br />
–––––––––––––––––––––––––––<br />
2012 2011<br />
Notes £m £m<br />
Revenue 4 82.1 86.0<br />
Operating profit 5 62.3 68.9<br />
Exceptional investment income 5 37.4 -<br />
Finance income 9 3.7 19.5<br />
Finance costs 9 (50.8) (39.8)<br />
Profit before tax 52.6 48.6<br />
Tax 10 13.2 10.1<br />
Profit for the year 65.8 58.7<br />
All results relate to continuing operations.<br />
82
TRAVIS PERKINS ANNUAL REPORT AND ACCOUNTS 2012<br />
Statements of Comprehensive Income<br />
FOR THE YEAR ENDED 31 December 2012<br />
The Group<br />
The Company<br />
–––––––––––––––––––––––––– –––––––––––––––––––––––––––<br />
2012 2011 2012 2011<br />
Notes £m £m £m £m<br />
Profit for the year 259.6 212.4 65.8 58.7<br />
Items that will not be reclassified subsequently to profit <strong>and</strong> loss<br />
Actuarial losses on defined benefit pension schemes 28 (45.8) (49.8) - -<br />
Deferred tax rate change 10 (5.5) (4.9) - -<br />
Income tax relating to items not reclassified 10 10.4 12.6 - -<br />
Items that may be reclassified subsequently to profit <strong>and</strong> loss<br />
Cash flow hedges:<br />
(40.9) (42.1) - -<br />
Losses arising during the year (8.5) (4.6) (8.5) (4.6)<br />
Reclassification adjustments for losses included in profit 8.8 2.8 8.8 2.8<br />
Movement on cash flow hedge cancellation payment 4.1 4.2 4.1 4.2<br />
Income tax relating to items that may be reclassified 10 (0.9) (0.6) (0.9) (0.6)<br />
3.5 1.8 3.5 1.8<br />
Other comprehensive income for the year net of tax (37.4) (40.3) 3.5 1.8<br />
Total comprehensive income for the year 222.2 172.1 69.3 60.5<br />
FINANCIAL<br />
STATEMENTS<br />
83
Balance Sheets<br />
As at 31 December 2012<br />
Assets<br />
The Group<br />
The Company<br />
––––––––––––––––––––––––––––– –––––––––––––––––––––––––––––<br />
2012 2011 2012 2011<br />
Notes £m £m £m £m<br />
NON-CURRENT ASSETS<br />
Goodwill 13 1,807.5 1,706.2 - -<br />
Other intangible assets 14 424.8 388.9 - -<br />
Property, plant <strong>and</strong> equipment 15 578.4 562.6 0.2 0.2<br />
Derivative financial instruments 24 12.8 40.3 12.8 40.3<br />
Investment property 16 0.4 0.4 - -<br />
Interest in associates 17 6.7 51.3 6.2 58.5<br />
Investment in subsidiaries 17 - - 3,572.9 2,872.8<br />
Available-for-sale investments 17 2.4 1.5 - -<br />
Retirement benefit asset 28 1.6 19.3 - -<br />
Deferred tax asset 26 - - 14.2 9.9<br />
Total non-current assets 2,834.6 2,770.5 3,606.3 2,981.7<br />
CURRENT ASSETS<br />
Inventories 637.1 596.0 - -<br />
Trade <strong>and</strong> other receivables 18 733.7 743.0 180.7 214.1<br />
Derivative financial instruments 24 12.7 3.1 12.7 3.1<br />
Cash <strong>and</strong> cash equivalents 19 139.1 78.6 74.0 -<br />
Total current assets 1,522.6 1,420.7 267.4 217.2<br />
Total assets 4,357.2 4,191.2 3,873.7 3,198.9<br />
84
TRAVIS PERKINS ANNUAL REPORT AND ACCOUNTS 2012<br />
Equity <strong>and</strong> liabilities<br />
The Group<br />
The Company<br />
––––––––––––––––––––––––––––– –––––––––––––––––––––––––––––<br />
2012 2011 2012 2011<br />
Notes £m £m £m £m<br />
Capital <strong>and</strong> reserves<br />
Issued capital 20 24.5 24.4 24.5 24.4<br />
Share premium account 22 487.2 480.8 486.1 479.7<br />
Merger reserve 22 326.5 326.5 326.5 326.5<br />
Revaluation reserve 22 20.1 20.8 - -<br />
Hedging reserve 22 (1.6) (5.1) (1.6) (5.1)<br />
Own shares 22 (62.4) (75.2) (62.4) (75.2)<br />
Accumulated profits 22 1,513.8 1,335.6 204.0 192.5<br />
Total equity 2,308.1 2,107.8 977.1 942.8<br />
Non-current liabilities<br />
Interest bearing loans <strong>and</strong> borrowings 23 195.2 598.2 134.9 592.8<br />
Derivative financial instruments 24 4.9 5.9 4.9 5.9<br />
Retirement benefit obligations 28 59.1 65.0 - -<br />
Long-term provisions 25 20.0 28.9 - -<br />
Long term other payables 29 47.0 - 47.0 -<br />
Amounts due to subsidiaries - - 2,243.4 1,563.5<br />
Deferred tax liabilities 26 85.0 97.4 - -<br />
Total non-current liabilities 411.2 795.4 2,430.2 2,162.2<br />
Current liabilities<br />
Interest bearing loans <strong>and</strong> borrowings 23 396.1 63.6 444.9 74.9<br />
Trade <strong>and</strong> other payables 27 1,107.6 1,088.3 18.9 19.0<br />
Derivative financial instruments 24 2.6 - 2.6 -<br />
Tax liabilities 74.8 75.9 - -<br />
Short-term provisions 25 56.8 60.2 - -<br />
Total current liabilities 1,637.9 1,288.0 466.4 93.9<br />
Total liabilities 2,049.1 2,083.4 2,896.6 2,256.1<br />
Total equity <strong>and</strong> liabilities 4,357.2 4,191.2 3,873.7 3,198.9<br />
FINANCIAL<br />
STATEMENTS<br />
The financial statements of Travis Perkins plc, registered number 824821, were approved by the Board of Directors on 3 April 2013 <strong>and</strong><br />
signed on its behalf by:<br />
Geoff Cooper<br />
Chief Executive<br />
John Carter<br />
Deputy Chief Executive<br />
85
Consolidated Statement of Changes in Equity<br />
FOR THE YEAR ENDED 31 December 2012<br />
THE GROUP<br />
–––––––––––––––––––––––––––––––––––––––––––––––––––––––––––––––––––––––––––––––––––––––––––––––––––––––––––––––––––––––––––––––––––––––––––––––––––––––––––––––<br />
Issued Share<br />
share premium Merger Revaluation Hedging Own Retained Total<br />
capital account reserve reserve reserve shares earnings equity<br />
£m £m £m £m £m £m £m £m<br />
At 1 January 2011 24.2 471.5 325.9 21.3 (6.9) (83.4) 1,199.2 1,951.8<br />
Profit for the year - - - - - - 212.4 212.4<br />
Other comprehensive income<br />
for the period net of tax - - - - 1.8 - (42.1) (40.3)<br />
Total comprehensive income for the year - - - - 1.8 - 170.3 172.1<br />
Dividends - - - - - - (38.8) (38.8)<br />
Issue of share capital 0.2 9.3 0.6 - - 8.2 (7.1) 11.2<br />
Realisation of revaluation reserve in<br />
respect of property disposals - - - (1.1) - - 1.1 -<br />
Difference between depreciation of assets on<br />
a historical basis <strong>and</strong> on a revaluation basis - - - (0.3) - - 0.3 -<br />
Deferred tax rate change - - - 0.9 - - - 0.9<br />
Foreign exchange differences - - - - - - (0.1) (0.1)<br />
Tax on share based payments (note 10) - - - - - - (3.2) (3.2)<br />
Credit for equity-settled share based payments - - - - - - 13.9 13.9<br />
At 31 December 2011 24.4 480.8 326.5 20.8 (5.1) (75.2) 1,335.6 2,107.8<br />
Profit for the year - - - - - - 259.6 259.6<br />
Other comprehensive income for the<br />
period net of tax - - - - 3.5 - (40.9) (37.4)<br />
Total comprehensive income for the year - - - - 3.5 - 218.7 222.2<br />
Dividends - - - - - - (51.2) (51.2)<br />
Issue of share capital 0.1 6.4 - - - 12.8 (10.4) 8.9<br />
Realisation of revaluation reserve in<br />
respect of property disposals - - - (1.4) - - 1.4 -<br />
Difference between depreciation of assets on<br />
a historical basis <strong>and</strong> on a revaluation basis - - - (0.2) - - 0.2 -<br />
Deferred tax rate change - - - 0.9 - - - 0.9<br />
Tax on share based payments (note 10) - - - - - - 4.3 4.3<br />
Credit for equity-settled share based payments - - - - - - 15.2 15.2<br />
At 31 December 2012 24.5 487.2 326.5 20.1 (1.6) (62.4) 1,513.8 2,308.1<br />
86
TRAVIS PERKINS ANNUAL REPORT AND ACCOUNTS 2012<br />
Statement of Changes in Equity<br />
FOR THE YEAR ENDED 31 December 2012<br />
THE COMPANY<br />
–––––––––––––––––––––––––––––––––––––––––––––––––––––––––––––––––––––––––––––––––––––––––––––––––––––––––––––––––––––––––––––––––––––––––––<br />
Issued Share<br />
share premium Merger Hedging Own Retained Total<br />
capital account reserve reserve shares earnings equity<br />
£m £m £m £m £m £m £m<br />
At I January 2011 24.2 470.4 325.9 (6.9) (83.4) 178.7 908.9<br />
Profit for the year - - - - - 58.7 58.7<br />
Other comprehensive income for the period net of tax - - - 1.8 - - 1.8<br />
Total comprehensive income for the year - - - 1.8 - 58.7 60.5<br />
Dividends - - - - - (38.8) (38.8)<br />
Issue of share capital 0.2 9.3 0.6 - 8.2 (7.1) 11.2<br />
Tax on share based payments (note 10) - - - - - (4.1) (4.1)<br />
Credit for equity-settled share based payments - - - - - 5.1 5.1<br />
At 31 December 2011 24.4 479.7 326.5 (5.1) (75.2) 192.5 942.8<br />
Profit for the year - - - - - 65.8 65.8<br />
Other comprehensive income for the period net of tax - - - 3.5 - - 3.5<br />
Total comprehensive income for the year - - - 3.5 - 65.8 69.3<br />
Dividends - - - - - (51.2) (51.2)<br />
Issue of share capital 0.1 6.4 - - 12.8 (10.4) 8.9<br />
Tax on share based payments (note 10) - - - - - 3.0 3.0<br />
Credit for equity-settled share based payments - - - - - 4.3 4.3<br />
At 31 December 2012 24.5 486.1 326.5 (1.6) (62.4) 204.0 977.1<br />
FINANCIAL<br />
STATEMENTS<br />
87
Cash Flow Statements<br />
FOR THE YEAR ENDED 31 December 2012<br />
The Group<br />
The Company<br />
––––––––––––––––––––––––––––– –––––––––––––––––––––––––––––<br />
2012 2011 2012 2011<br />
£m £m £m £m<br />
Operating profit before amortisation <strong>and</strong> exceptional items 326.6 313.2 62.3 68.9<br />
Adjustments for:<br />
Depreciation of property, plant <strong>and</strong> equipment 69.4 63.9 - -<br />
Other non cash movements 15.2 13.9 4.3 5.1<br />
Losses of associate 0.3 0.6 - -<br />
Gain on disposal of property, plant, equipment <strong>and</strong> investments (17.1) (17.6) - -<br />
Operating cash flows before movements in working capital 394.4 374.0 66.6 74.0<br />
Increase in inventories (19.2) (36.1) - -<br />
Decrease / (increase) in receivables 5.1 (62.0) 81.8 1.5<br />
(Decrease) / increase in payables (25.0) 107.1 682.8 231.9<br />
Payments on exceptional items (4.7) (17.8) - (5.4)<br />
Pension payments in excess of the charge to profits (23.0) (20.1) - -<br />
Cash generated from operations 327.6 345.1 831.2 302.0<br />
Interest paid (27.4) (24.2) (41.2) (29.2)<br />
Income taxes paid (64.5) (26.3) - -<br />
Net cash from operating activities 235.7 294.6 790.0 272.8<br />
Cash flows from investing activities<br />
Interest received 0.1 0.7 0.1 11.6<br />
Proceeds on disposal of property, plant, equipment <strong>and</strong> investments 32.6 15.0 - -<br />
Purchases of property, plant <strong>and</strong> equipment (82.3) (109.2) - (0.1)<br />
Interest in associate (2.9) (2.3) (2.2) (2.3)<br />
Disposal of business - 26.9 - -<br />
Investments in subsidiaries - - (600.6) -<br />
Provision of funding to subsidiary undertaking - - - (168.2)<br />
Acquisition of businesses net of cash acquired (24.5) (9.9) - (1.6)<br />
Net cash used in investing activities (77.0) (78.8) (602.7) (160.6)<br />
Financing activities<br />
Net proceeds from the issue of share capital 8.9 10.6 8.9 10.6<br />
Bank facility fees paid - (6.1) - (6.1)<br />
Net movement in finance lease liabilities 5.7 (1.6) - -<br />
Decrease in loans (61.6) (152.2) (70.0) (90.0)<br />
Dividends paid (51.2) (38.8) (51.2) (38.8)<br />
Net cash from financing activities (98.2) (188.1) (112.3) (124.3)<br />
Net increase / (decrease) in cash <strong>and</strong> cash equivalents 60.5 27.7 75.0 (12.1)<br />
Cash <strong>and</strong> cash equivalents at beginning of year 78.6 50.9 (1.6) 10.5<br />
Cash <strong>and</strong> cash equivalents at end of year (note 19) 139.1 78.6 73.4 (1.6)<br />
88
TRAVIS PERKINS ANNUAL REPORT AND ACCOUNTS 2012<br />
Notes to the Financial Statements<br />
FOR THE YEAR ENDED 31 December 2012<br />
1. General information<br />
Overview<br />
Travis Perkins plc is a company incorporated in the United Kingdom<br />
under the Companies Act 2006. The address of the registered office is<br />
given on page 137. The nature of the Group’s operations <strong>and</strong> its principal<br />
activities are set out in the Chief Executive’s review of the year, the<br />
Deputy Chief Executive’s review of the year <strong>and</strong> the Finance Director’s<br />
review of the year on pages 38 to 43.<br />
These financial statements are presented in pounds sterling, the<br />
currency of the primary economic environment in which the Group<br />
operates.<br />
Basis of accounting<br />
The financial statements have been prepared in accordance with<br />
International Financial <strong>Report</strong>ing St<strong>and</strong>ards (‘IFRS’) issued by the<br />
International Accounting St<strong>and</strong>ards Board. The financial statements have<br />
also been prepared in accordance with IFRS adopted by the European<br />
Union <strong>and</strong> therefore the Group financial statements comply with Article 4<br />
of the EU IAS Regulations.<br />
Basis of preparation<br />
The financial statements have been prepared on the historic cost basis,<br />
except that derivative financial instruments are stated at their fair value.<br />
The consolidated financial statements include the accounts of the<br />
Company <strong>and</strong> all entities controlled by the Company (its subsidiaries)<br />
(together referred to as ‘the Group’) from the date control commences<br />
until the date that control ceases. Control is achieved where the Company<br />
has the power to govern the financial <strong>and</strong> operating policies of an<br />
investee entity to obtain benefits from its activities. As such, the results<br />
of subsidiaries acquired during the year are included in the consolidated<br />
income statement from the effective date of acquisition.<br />
In the current financial year, the Group has adopted the following,<br />
which did not have a material impact:<br />
• IAS 1 amendments Presentation of financial statements<br />
At the date of authorisation of these financial statements, the following<br />
St<strong>and</strong>ards <strong>and</strong> Interpretations, which have not yet been applied in these<br />
financial statements, were in issue, but not yet effective:<br />
• IAS 19 (revised) Employee benefits;<br />
• IAS 27 (revised) Separate Financial Statements;<br />
• IAS 28 (revised)Investments in Associates <strong>and</strong> Joint Ventures (2011);<br />
• IAS 32 (amended) Offsetting Financial Assets <strong>and</strong> Liabilities;<br />
• IFRS 9 Financial Instruments (2009);<br />
• IFRS 10 Consolidated Financial Statements;<br />
• IFRS 11 Joint Arrangements;<br />
• IFRS 12 Disclosure of Interests in Other Entities;<br />
• IFRS 13 Fair Value Measurement.<br />
The Directors anticipate that adoption of these St<strong>and</strong>ards <strong>and</strong><br />
Interpretations in future periods will have no material impact on the<br />
financial statements of the Group except as follows:<br />
As the Group has always recognised actuarial gains <strong>and</strong> losses<br />
immediately, there will be no effect on the defined benefit obligation of all<br />
defined benefit schemes <strong>and</strong> consequently no effect on the balance sheet<br />
disclosures. IAS 19 revised requires interest cost <strong>and</strong> return on scheme<br />
assets calculated under the previous version of IAS 19 to be replaced with<br />
a net interest amount calculated by applying a discount rate to the net<br />
defined liability or asset. The impact of this revision on profit before tax in<br />
2012 would be to lower profit before tax by approximately £12m.<br />
Management is currently of the opinion that the Group’s forecasts<br />
<strong>and</strong> projections, show that the Group should be able to operate within<br />
its current facilities <strong>and</strong> comply with its banking covenants. The Group<br />
is, however, exposed to a number of significant risks <strong>and</strong> uncertainties,<br />
which could affect the Group’s ability to meet management’s forecast <strong>and</strong><br />
projections <strong>and</strong> hence its ability to meet its banking covenants.<br />
The Directors believe that the Group has the flexibility to react to<br />
changing market conditions <strong>and</strong> is adequately placed to manage its<br />
business risks successfully despite the current uncertain economic<br />
outlook <strong>and</strong> challenging macro economic conditions.<br />
A detailed consideration of going concern, risks <strong>and</strong> uncertainties is<br />
provided in the Finance Director’s review of the year on pages 38 to 43.<br />
After making enquiries, the Directors have formed a judgement at the<br />
time of approving the financial statements, that there is a reasonable<br />
expectation that the Company <strong>and</strong> the Group have adequate resources<br />
to continue in operational existence for the foreseeable future. For this<br />
reason, they continue to adopt the going concern basis in preparing the<br />
financial statements.<br />
2. Significant accounting policies<br />
The principal accounting policies adopted in preparing the financial<br />
statements are set out below.<br />
Revenue recognition<br />
Revenue is recognised when goods or services are received by the<br />
customer <strong>and</strong> the risks <strong>and</strong> rewards of ownership have passed to them.<br />
Revenue is measured at the fair value of consideration received or<br />
receivable <strong>and</strong> represents amounts receivable for goods <strong>and</strong> services<br />
provided in the normal course of business, net of discounts <strong>and</strong> value<br />
added tax. For the Parent Company, revenue comprises management<br />
charges receivable <strong>and</strong> dividend income received.<br />
Exceptional items<br />
Exceptional items are those items of income <strong>and</strong> expenditure that<br />
by reference to the Group are material in size or unusual in nature or<br />
incidence, that in the judgement of the Directors, should be disclosed<br />
separately on the face of the financial statements (or in the notes in<br />
the case of a segment) to ensure both that the reader has a proper<br />
underst<strong>and</strong>ing of the Group’s financial performance <strong>and</strong> that there is<br />
comparability of financial performance between periods.<br />
Items of income or expense that are considered by the Directors<br />
for designation as exceptional items include, but are not limited to,<br />
significant restructurings, onerous contracts, write-downs or impairments<br />
of current <strong>and</strong> non-current assets, the costs of acquiring <strong>and</strong> integrating<br />
businesses, gains or losses on disposals of businesses <strong>and</strong> investments,<br />
re-measurement gains or losses arising from changes in the fair value of<br />
derivative financial instruments to the extent that hedge accounting is<br />
not achieved or is not effective <strong>and</strong> pension scheme curtailment gains.<br />
Business combinations <strong>and</strong> goodwill<br />
All business combinations are accounted for using the acquisition<br />
method. The cost of an acquisition represents the cash value of the<br />
consideration <strong>and</strong>/or the fair value of the shares issued on the date the<br />
offer became unconditional. The acquiree’s identifiable assets, liabilities<br />
<strong>and</strong> contingent liabilities that meet the conditions for recognition under<br />
IFRS 3 (2008) are recognised at their fair value at the acquisition date<br />
except that:<br />
• Deferred tax assets or liabilities <strong>and</strong> liabilities or assets related to<br />
employee benefit arrangements are recognised <strong>and</strong> measured in<br />
accordance with IAS 12 Income Taxes <strong>and</strong> IAS 19 Employee Benefits<br />
respectively;<br />
• Liabilities or equity instruments related to the replacement by the<br />
Group of an acquiree’s share-based payment awards are measured in<br />
accordance with IFRS 2 Share-based Payment;<br />
FINANCIAL<br />
STATEMENTS<br />
89
NOTES TO THE FINANCIAL STATEMENTS<br />
• Assets (or disposal groups) that are classified as held for sale in<br />
accordance with IFRS 5 Non-current Assets Held for Sale <strong>and</strong><br />
Discontinued Operations are measured in accordance with that<br />
St<strong>and</strong>ard<br />
Where a business combination is achieved in stages, the Group’s<br />
previously held interests in the acquired entity are remeasured to fair<br />
value at the acquisition date <strong>and</strong> the resulting gain or loss, if any, is<br />
recognised in the income statement.<br />
Goodwill arising on acquisition represents the excess of the cost of<br />
acquisition over the share of the aggregate fair value of identifiable net<br />
assets (including intangible assets) of a business or a subsidiary at<br />
the date of acquisition. All material intangible fixed assets obtained on<br />
acquisition have been recognised separately in the financial statements.<br />
Goodwill is initially recognised as an asset <strong>and</strong> allocated to cash<br />
generating units or groups of cash generating units that are expected to<br />
benefit from the synergies of the combination, then at least annually, is<br />
reviewed for impairment. Any impairment is recognised immediately in<br />
the income statement <strong>and</strong> is not subsequently reversed, as such, goodwill<br />
is stated in the balance sheet at cost less any provisions for impairment<br />
in value.<br />
Goodwill arising on acquisitions before the date of transition to IFRS<br />
(1 January 2004) has been retained at the previous UK GAAP amounts<br />
subject to being tested for impairment at that date. Goodwill written off to<br />
reserves under UK GAAP prior to 1998 has not been reinstated <strong>and</strong> is not<br />
included in determining any subsequent profit or loss on disposal.<br />
Liabilities for contingent consideration are classified as fair value<br />
through profit <strong>and</strong> loss.<br />
Investments in associates<br />
An associate is an entity over which the Group has significant influence,<br />
but not control or joint control through participation in the financial<br />
<strong>and</strong> operating policy decisions of the investee. The results, assets, <strong>and</strong><br />
liabilities of associates are incorporated in these financial statements<br />
using the equity method of accounting. Investments in associates are<br />
carried in the balance sheet at cost as adjusted by post acquisition<br />
changes in the Group’s share of the net assets of the associate, less any<br />
impairment in the value of individual investments.<br />
Intangible assets<br />
Intangible assets identified as part of the assets of an acquired business<br />
are capitalised separately from goodwill if the fair value can be measured<br />
reliably on initial recognition. Intangible assets are amortised to the<br />
income statement on a straight-line basis over a maximum of 20 years<br />
except where they are considered to have an indefinite useful life. In the<br />
latter instance, they are reviewed annually for impairment.<br />
Investment properties<br />
Investment properties, which are held to earn rental income or for capital<br />
appreciation or for both, are stated at deemed cost less depreciation.<br />
Properties are depreciated to their estimated residual value on a straightline<br />
basis over their estimated useful lives, up to a maximum of 50 years.<br />
Rental income from investment property is recognised in the income<br />
statement on a straight-line basis over the term of the lease.<br />
Assets held for sale<br />
Assets held for sale are measured at the lower of carrying amount <strong>and</strong> fair<br />
value less costs to sell. Assets are held for sale if their carrying amount<br />
will be recovered through a sale transaction rather than continuing use.<br />
This condition is regarded as met only when the sale is highly probable<br />
<strong>and</strong> the asset is available for sale in its present condition.<br />
Property, plant <strong>and</strong> equipment<br />
Property, plant <strong>and</strong> equipment is stated at cost or deemed cost less<br />
accumulated depreciation <strong>and</strong> any impairment in value. Assets are<br />
depreciated to their estimated residual value on a straight-line basis over<br />
their estimated useful lives as follows:<br />
• Buildings - 50 years or if lower, the estimated useful life of the building<br />
or the life of the lease;<br />
• Plant <strong>and</strong> equipment - 4 to 10 years;<br />
• Freehold l<strong>and</strong> is not depreciated.<br />
Assets held under finance leases are depreciated over their expected<br />
useful lives on the same basis as owned assets, or where shorter, the term<br />
of the relevant lease.<br />
The gain or loss arising on the disposal or retirement of an asset is<br />
determined as the difference between the sale proceeds net of expenses<br />
<strong>and</strong> the carrying amount of the asset in the balance sheet <strong>and</strong> is<br />
recognised in the income statement. Where appropriate, the attributable<br />
revaluation reserve remaining in respect of properties revalued prior to<br />
the adoption of IFRS is transferred directly to accumulated profits.<br />
Leases<br />
Finance leases, which transfer to the Group substantially all the risks<br />
<strong>and</strong> benefits incidental to ownership of the leased item, are capitalised at<br />
the inception of the lease at the fair value of the leased asset or, if lower,<br />
at the present value of the minimum lease payments. Lease payments<br />
are apportioned between the finance charges <strong>and</strong> reduction of the lease<br />
liability to achieve a constant rate of interest on the remaining balance<br />
of the liability. Finance charges are charged directly against income.<br />
Capitalised leased assets are depreciated over the shorter of the estimated<br />
useful life of the asset or the lease term. Leases where the lessor retains<br />
substantially all the risks <strong>and</strong> benefits of ownership of the asset are<br />
classified as operating leases.<br />
Operating lease rental payments are recognised as an expense in the<br />
income statement on a straight-line basis over the lease term.<br />
Reverse lease premia <strong>and</strong> other incentives receivable for entering into a<br />
lease agreement are recognised in the income statement on a straight line<br />
basis over the life of the lease.<br />
Impairment of tangible <strong>and</strong> intangible assets excluding goodwill<br />
The carrying amounts of the Group’s tangible <strong>and</strong> intangible assets<br />
are reviewed at each balance sheet date to determine whether there is<br />
any indication of impairment. If such an indication exists, the asset’s<br />
recoverable amount is estimated <strong>and</strong> compared to its carrying value.<br />
Where the asset does not generate cash flows that are independent from<br />
other assets, the Group estimates the recoverable amount of the cashgenerating<br />
unit (‘CGU’) to which the asset belongs. Where the carrying<br />
value exceeds the recoverable amount a provision for the impairment loss<br />
is established with a charge being made to the income statement.<br />
For intangible assets that have an indefinite useful life the recoverable<br />
amount is estimated at each annual balance sheet date.<br />
Impairment losses recognised in respect of a CGU are allocated first<br />
to reduce the carrying amount of any goodwill allocated to the CGU <strong>and</strong><br />
then to reduce the carrying amount of the other assets in the unit on a<br />
pro-rata basis.<br />
Inventories<br />
Inventories, which consist of goods for resale, are stated at the lower of<br />
average weighted cost <strong>and</strong> net realisable value. Cost comprises direct<br />
materials <strong>and</strong>, where applicable, direct labour costs <strong>and</strong> those overheads<br />
that have been incurred in bringing the inventories to their present<br />
location <strong>and</strong> condition. Net realisable value is the estimated selling price<br />
less the estimated costs of disposal.<br />
90
TRAVIS PERKINS ANNUAL REPORT AND ACCOUNTS 2012<br />
Financial instruments<br />
Financial assets <strong>and</strong> liabilities are recognised in the balance sheet<br />
when the Group becomes a party to the contractual provisions of the<br />
instrument.<br />
Trade receivables<br />
Trade receivables are measured at amortised cost, which is carrying<br />
amount less provision for irrecoverable amounts. Allowances for the<br />
estimated irrecoverable amounts are made in the income statement when<br />
the receivable is considered to be uncollectible.<br />
Impairment of financial assets<br />
Financial assets are treated as impaired when in the opinion of the<br />
Directors, the likelihood of full recovery is diminished by either events or<br />
change of circumstance.<br />
Cash <strong>and</strong> cash equivalents<br />
Cash <strong>and</strong> cash equivalents comprise cash balances <strong>and</strong> call deposits with<br />
an original maturity of three months or less.<br />
Bank <strong>and</strong> other borrowings<br />
Interest bearing bank loans <strong>and</strong> overdrafts, loan notes <strong>and</strong> other loans<br />
are recognised in the balance sheet at amortised cost. Finance charges<br />
associated with arranging a bank facility are recognised in the income<br />
statement over the life of the facility. All other borrowing costs are<br />
recognised in the income statement in the period in which they are<br />
incurred.<br />
Trade payables<br />
Trade payables are measured at amortised cost.<br />
Foreign currencies<br />
Transactions denominated in foreign currencies are recorded at the rates<br />
ruling on the date of the transaction.<br />
At the consolidated balance sheet date, unhedged monetary assets<br />
<strong>and</strong> liabilities denominated in foreign currencies are translated at the rate<br />
of exchange ruling at that date. Foreign exchange differences arising on<br />
translation are recognised in the income statement.<br />
Derivative financial instruments <strong>and</strong> hedge accounting<br />
The Group uses derivative financial instruments to hedge its exposure to<br />
interest rate <strong>and</strong> foreign exchange risks arising from financing activities.<br />
The Group does not enter into speculative financial instruments. In<br />
accordance with its treasury policy, the Group does not hold or issue<br />
derivative financial instruments for trading purposes.<br />
Derivative financial instruments are stated at fair value. The fair value<br />
of derivative financial instruments is the estimated amount the Group<br />
would receive or pay to terminate the derivative at the balance sheet date,<br />
taking into account current interest <strong>and</strong> exchange rates <strong>and</strong> the current<br />
creditworthiness of the counterparties.<br />
Changes in the fair value of derivative financial instruments, that<br />
are designated <strong>and</strong> effective as hedges of the future variability of cash<br />
flows, are recognised in equity <strong>and</strong> the ineffective portion is recognised<br />
immediately in the income statement.<br />
For an effective hedge of an exposure to changes in the fair value<br />
of a hedged item, the hedged item is adjusted for changes in fair value<br />
attributable to the risk being hedged with the corresponding entry in the<br />
income statement.<br />
For derivatives that do not qualify for hedge accounting, any gains<br />
or losses arising from changes in fair value are taken to the income<br />
statement as they arise.<br />
Derivatives embedded in commercial contracts are treated as separate<br />
derivatives when their risks <strong>and</strong> characteristics are not closely related to<br />
those of the underlying contracts, with unrealised gains or losses being<br />
reported in the income statement.<br />
The fair value of hedged derivatives is classified as a non-current<br />
asset or non-current liability if the remaining maturity of the hedge<br />
relationship is more than 12 months, otherwise they are classified as<br />
current.<br />
Foreign currency forward contracts not designated effective hedges<br />
are marked to market at the balance sheet date, with any gains or losses<br />
being taken through the income statement.<br />
Financial assets <strong>and</strong> financial liabilities<br />
Financial assets are classified into the following specified categories:<br />
financial assets at ‘fair value through profit or loss’ (‘FVTPL’), ‘availablefor-sale’<br />
(‘AFS’) financial assets <strong>and</strong> ‘loans <strong>and</strong> receivables’. The<br />
classification depends on the nature <strong>and</strong> purpose of the financial assets<br />
<strong>and</strong> is determined at the time of initial recognition.<br />
Financial liabilities are classified as either financial liabilities ‘at<br />
FVTPL’ or ‘other financial liabilities’ <strong>and</strong> trade <strong>and</strong> other payables.<br />
The Group has defined the classes of financial assets to be other<br />
financial assets, cash <strong>and</strong> borrowings <strong>and</strong> derivative financial<br />
instruments.<br />
Financial assets <strong>and</strong> financial liabilities at FVTPL<br />
Financial assets <strong>and</strong> financial liabilities are classified as at FVTPL where<br />
the financial asset or the financial liability is either held for trading or it is<br />
designated as FVTPL.<br />
A financial asset or financial liability is classified as held for trading if it:<br />
• Has been acquired principally for the purpose of selling or of disposal<br />
in the near future; or<br />
• Is a part of an identified portfolio of financial instruments that the<br />
Group manages together <strong>and</strong> has a recent actual pattern of short-term<br />
profit-taking; or<br />
• Is a derivative that is not designated <strong>and</strong> effective as a hedging<br />
instrument.<br />
Financial assets <strong>and</strong> financial liabilities at FVTPL are stated at fair value,<br />
with any resultant gain or loss recognised in the income statement unless<br />
it is an effective cash flow relationship. The net gain or loss recognised<br />
in the income statement incorporates any interest earned or paid on the<br />
financial asset <strong>and</strong> financial liability respectively.<br />
Loans <strong>and</strong> receivables<br />
Trade receivables <strong>and</strong> other receivables that have fixed or determinable<br />
payments that are not quoted in an active market are classified as loans<br />
<strong>and</strong> receivables. Loans <strong>and</strong> receivables are measured at amortised cost<br />
using the effective interest method, less any impairment. Interest income<br />
is recognised by applying the effective interest rate, except for short-term<br />
receivables, which applies to all amounts owed to the Group when the<br />
recognition of interest would be immaterial.<br />
Other financial liabilities<br />
Other financial liabilities, including borrowings, are initially measured<br />
at fair value, net of transaction costs. Other financial liabilities are<br />
subsequently measured at amortised cost using the effective interest<br />
method, with interest expense recognised on an effective yield basis. The<br />
effective interest method is a method of calculating the amortised cost<br />
of a financial liability <strong>and</strong> of allocating interest expense over the relevant<br />
period. The effective interest is the rate that exactly discounts estimated<br />
future cash payments through the expected life of the financial liability,<br />
or, where appropriate, a shorter period.<br />
FINANCIAL<br />
STATEMENTS<br />
91
NOTES TO THE FINANCIAL STATEMENTS<br />
Derecognition of financial assets <strong>and</strong> financial liabilities<br />
The Group derecognises a financial asset only when the contractual<br />
rights to the cash flows from the asset expire; or it transfers the financial<br />
asset <strong>and</strong> substantially all the risks <strong>and</strong> rewards of ownership of the asset<br />
to another entity. If the Group neither transfers nor retains substantially<br />
all the risks <strong>and</strong> rewards of ownership <strong>and</strong> continues to control the<br />
transferred asset, the Group recognises its retained interest in the<br />
asset <strong>and</strong> an associated liability for amounts it may have to pay. If the<br />
Group retains substantially all the risks <strong>and</strong> rewards of ownership of a<br />
transferred financial asset, the Group continues to recognise the financial<br />
asset <strong>and</strong> also recognises a collateralised borrowing for the proceeds<br />
received.<br />
The Group derecognises financial liabilities when, <strong>and</strong> only when, the<br />
Group’s obligations are discharged, cancelled or they expire.<br />
Taxation<br />
The tax expense represents the sum of the tax currently payable <strong>and</strong> the<br />
deferred tax.<br />
The tax currently payable is based on taxable profit for the year. Taxable<br />
profit differs from net profit as reported in the income statement because<br />
it excludes items of income <strong>and</strong> expense that are taxable or deductible<br />
in other years <strong>and</strong> it further excludes items, which are never taxable or<br />
deductible. The Group’s liability for current tax is calculated using tax rates<br />
that have been enacted or substantially enacted by the balance sheet date.<br />
Deferred tax is the tax expected to be payable or recoverable on<br />
differences between the carrying amounts of assets <strong>and</strong> liabilities in<br />
the financial statements <strong>and</strong> the corresponding tax bases used in the<br />
computation of taxable profit. This is accounted for using the balance<br />
sheet liability method. Deferred tax liabilities are generally recognised for<br />
all taxable temporary differences <strong>and</strong> deferred tax assets are recognised<br />
to the extent that it is probable that taxable profits will be available<br />
against which deductible temporary differences can be utilised. Such<br />
assets <strong>and</strong> liabilities are not recognised if the temporary difference arises<br />
from goodwill or from the initial recognition (other than in a business<br />
combination) of other assets <strong>and</strong> liabilities in a transaction that affects<br />
neither the tax profit nor the accounting profit.<br />
Deferred tax is calculated at the tax rates that are expected to apply in<br />
the period when the liability is settled or the asset realised. Deferred tax<br />
is charged or credited in the income statement, except when it relates to<br />
items charged or credited directly to equity, in which case the deferred<br />
tax is also dealt with in equity.<br />
Pensions <strong>and</strong> other post-employment benefits<br />
For defined benefit schemes, operating profit is charged with the cost<br />
of providing pension benefits earned by employees in the period. The<br />
expected return on pension scheme assets less the interest on pension<br />
scheme liabilities is shown as finance income or as a finance cost within<br />
the income statement.<br />
Actuarial gains <strong>and</strong> losses arising in the period from the difference<br />
between actual <strong>and</strong> expected returns on pension scheme assets,<br />
experience gains <strong>and</strong> losses on pension scheme liabilities <strong>and</strong> the effects<br />
of changes in demographics <strong>and</strong> financial assumptions are included in<br />
the statement of comprehensive income.<br />
Recoverable pension scheme surpluses <strong>and</strong> pension scheme deficits<br />
<strong>and</strong> the associated deferred tax balances are recognised in full in the<br />
period in which they occur <strong>and</strong> are included in the balance sheet.<br />
Obligations for contributions to defined contribution pension plans are<br />
recognised as an expense in the income statement as incurred.<br />
Employee share incentive plans<br />
The Group issues equity-settled share-based payments to certain<br />
employees (long-term incentives, executive share options <strong>and</strong> Save as<br />
You Earn). These payments are measured at fair value at the date of grant<br />
by the use of the Black Scholes option-pricing model taking into account<br />
the terms <strong>and</strong> conditions upon which the options were granted. The cost<br />
of equity-settled awards is recognised on a straight-line basis over the<br />
vesting period, based on the Group’s estimate of the number of shares that<br />
will eventually vest.<br />
Provisions<br />
A provision is recognised in the balance sheet when the Group has a<br />
present legal or constructive obligation because of a past event, <strong>and</strong> it is<br />
probable that an outflow of economic benefits will be required to settle<br />
the obligation. Provisions are measured at the Directors’ best estimate of<br />
the expenditure required to settle the obligation at the balance sheet date,<br />
<strong>and</strong> are discounted to present value where the effect is material.<br />
Equity instruments <strong>and</strong> own shares<br />
The Group has applied the requirements of IFRS 2 – Share Based<br />
Payments. In accordance with the transitional provisions, IFRS 2 has<br />
been applied to all grants of equity instruments after 7 November 2002<br />
that were unvested at 1 January 2005.<br />
Equity instruments represent the ordinary share capital of the Group<br />
<strong>and</strong> are recorded at the proceeds received, net of directly attributable<br />
incremental issue costs.<br />
Consideration paid by the Group for its own shares is deducted from<br />
total shareholders’ equity. Where such shares vest to employees under<br />
the terms of the Group’s share incentive schemes or the Group’s share<br />
save schemes or are sold, any consideration received is included in<br />
shareholders’ equity.<br />
Dividends<br />
Dividends proposed by the Board of Directors <strong>and</strong> unpaid at the period<br />
end are not recognised in the financial statements until they have been<br />
approved by shareholders at the <strong>Annual</strong> General Meeting.<br />
3. Critical judgements <strong>and</strong><br />
key sources of estimation <strong>and</strong> uncertainty<br />
These consolidated financial statements have been prepared in<br />
accordance with IFRS as issued by the IASB. The preparation of financial<br />
statements requires the Directors to make estimates <strong>and</strong> assumptions<br />
about future events that affect the reported amounts of assets <strong>and</strong><br />
liabilities <strong>and</strong> disclosure of contingent assets <strong>and</strong> liabilities. Future events<br />
<strong>and</strong> their effects cannot be determined with certainty. Therefore, the<br />
determination of estimates requires the exercise of judgement based<br />
on various assumptions <strong>and</strong> other factors such as historical experience,<br />
current <strong>and</strong> expected economic conditions. The Directors frequently<br />
re-evaluate these significant factors <strong>and</strong> make adjustments where facts<br />
<strong>and</strong> circumstances dictate. The Directors believe that the following<br />
accounting policies are critical due to the degree of estimation required<br />
<strong>and</strong> / or the potential material impact they may have on the Group’s<br />
financial position <strong>and</strong> performance.<br />
Income taxes<br />
The Group is subject to the income tax laws of the United Kingdom. These<br />
92
TRAVIS PERKINS ANNUAL REPORT AND ACCOUNTS 2012<br />
laws are complex <strong>and</strong> subject to different interpretations by taxpayers<br />
<strong>and</strong> tax authorities. When establishing income tax provisions, the<br />
Directors make a number of judgements <strong>and</strong> interpretations about the<br />
application <strong>and</strong> interaction of these laws. Changes in these tax laws or<br />
in their interpretation could affect the Group’s effective tax rate <strong>and</strong><br />
the results of operations in a given period. Accordingly, potentially<br />
significant tax benefits will not be recognised until there is sufficient<br />
certainty that they will be accepted by HMRC.<br />
Cash generating units<br />
The Directors consider that individual assets do not generate cash<br />
flows that are largely independent of those from other assets <strong>and</strong><br />
consequently that, for the purposes of impairment testing, each branch<br />
in the Group is a cash generating unit. Impairment testing of property<br />
plant <strong>and</strong> equipment is carried out at individual branch level. Goodwill<br />
<strong>and</strong> other intangibles impairment testing is carried out at br<strong>and</strong> level as<br />
described in note 13.<br />
Goodwill <strong>and</strong> intangible assets<br />
In testing for impairment, the recoverable amount of goodwill <strong>and</strong><br />
intangible assets is determined by reference to the value in use of the<br />
CGU grouping to which they are attributed. In addition the Directors<br />
have made certain assumptions concerning discount rates <strong>and</strong> the<br />
future development of the business that are consistent with its five-year<br />
plan. Whilst the Directors consider their assumptions to be realistic,<br />
should actual results, including those for market volume changes, be<br />
different from expectations, for instance due to a worsening of the UK<br />
economy, then it is possible that the value of goodwill <strong>and</strong> intangible<br />
assets included in the balance sheet could become impaired.<br />
The pre-tax discount rate is derived from the Group’s weighted<br />
average cost of capital (‘WACC’) calculated by the Group’s advisors. The<br />
WACC is based upon the risk free rate for ten-year UK gilts, adjusted<br />
for the UK market risk premium, which reflects the increased risk of<br />
investing in UK equities <strong>and</strong> the relative volatilities of the equity of the<br />
Group compared to the market as a whole. In arriving at the discount<br />
rate the Directors have applied an adjustment to reflect their view of the<br />
relative risk of the Group’s operations. Further details concerning the<br />
judgements made by the Directors in respect of goodwill <strong>and</strong> intangible<br />
assets <strong>and</strong> the impairment testing thereof, are given in note 13.<br />
Toolstation consideration<br />
The final consideration for Toolstation will be determined by reference<br />
to a multiple of the EBITDA of the business in 2013. At the balance<br />
sheet date, the Directors have estimated Toolstation’s 2013 EBITDA<br />
from which they have calculated an estimated creditor for the final<br />
consideration payable <strong>and</strong> included it in the balance sheet. Should<br />
the Company’s 2013 EBITDA change from that estimated, the final<br />
consideration will be different, but in the opinion of the directors any<br />
difference is unlikely to be material.<br />
Pension assumptions<br />
The Group has chosen to adopt assumptions that the Directors believe<br />
are generally in line with the median for comparable companies. If the<br />
future return on equities is lower than anticipated, which from 2013, will<br />
be equal to the discount rate applied to the pension scheme liability,<br />
or if the difference between actual inflation <strong>and</strong> the actual increase<br />
in pensionable salaries is greater than that assumed, or if long term<br />
interest rates were lower than assumed, or if the average life expectancy<br />
of pensioners increases, then the pension deficit would be greater than<br />
currently stated in the balance sheet.<br />
Property leases<br />
The Group is party to a number of leases on properties that are no longer<br />
required for trading. Whilst every effort is made to profitably sub-let<br />
these properties, it is not always possible. Where a lease is onerous to<br />
the Group, a provision is established for the difference between amounts<br />
contractually payable to the property owner <strong>and</strong> to local authorities <strong>and</strong><br />
amounts expected to be received from the tenant (if any) for the period<br />
up until the point it is judged that the lease will no longer be onerous. The<br />
Directors believe that their estimates, which are based upon the current<br />
state of the UK property market, are appropriate. However, it is possible<br />
that it will take longer (or in some cases less time) to dispose of leases<br />
than they anticipate. As a result, the provisions may be mis-stated, but in<br />
the opinion of the Directors, this is unlikely to be material.<br />
Insurance provisions<br />
The Group has been substantially self-insured since 2001. The nature<br />
of insurance claims is that they frequently take many years to fully<br />
crystallise, therefore the Directors have to estimate the value of<br />
provisions to hold in the balance sheet in respect of historical claims.<br />
Under the guidance of the Group’s insurance advisors, the value of<br />
incurred claims is estimated using the Generalised Cape Cod Method.<br />
The provision is determined by deducting the value of claims settled to<br />
date from the estimated level of claims incurred. Whilst the Generalised<br />
Cape Cod Method is an insurance industry st<strong>and</strong>ard methodology, it<br />
relies on historical trends to determine the level of expected claims.<br />
To the extent that the estimates are inaccurate the Group may be<br />
underprovided, but in the opinion of the Directors, any under-provision<br />
is unlikely to be material.<br />
FINANCIAL<br />
STATEMENTS<br />
93
NOTES TO THE FINANCIAL STATEMENTS<br />
4. Revenue<br />
THE GROUP<br />
THE COMPANY<br />
–––––––––––––––––––––––––––––––––––––– ––––––––––––––––––––––––––––––––––––––<br />
2012 2011 2012 2011<br />
£m £m £m £m<br />
Sale of goods 4,844.9 4,779.1 - -<br />
Management charges - - 7.9 6.9<br />
Dividends from subsidiaries - - 74.2 79.1<br />
4,844.9 4,779.1 82.1 86.0<br />
Other operating income 19.3 20.5 - -<br />
Finance income 13.8 22.4 3.7 19.5<br />
4,878.0 4,822.0 85.8 105.5<br />
5. Profit<br />
a. Operating profit<br />
THE GROUP<br />
THE COMPANY<br />
–––––––––––––––––––––––––––––––––––––– ––––––––––––––––––––––––––––––––––––––<br />
2012 2011 2012 2011<br />
£m £m £m £m<br />
Revenue 4,844.9 4,779.1 82.1 86.0<br />
Cost of sales (3,381.1) (3,355.8) - -<br />
Gross profit 1,463.8 1,423.3 82.1 86.0<br />
Selling <strong>and</strong> distribution costs (907.8) (882.1) - -<br />
Administrative expenses (274.5) (270.6) (19.8) (17.1)<br />
Other operating income 19.3 20.5 - -<br />
Share of results of associate (0.3) (0.6) - -<br />
Operating profit 300.5 290.5 62.3 68.9<br />
Add back exceptional items 8.7 9.8 - -<br />
Add back amortisation of intangible assets 17.4 12.9 - -<br />
Adjusted operating profit 326.6 313.2 62.3 68.9<br />
Exceptional items<br />
2012 2011<br />
£m £m<br />
BSS integration costs (14.7) (9.8)<br />
Onerous lease provision release 6.0 -<br />
Toolstation investment fair value adjustment 35.3 -<br />
Toolstation consideration fair value adjustment 4.2 -<br />
30.8 (9.8)<br />
The Group incurred £14.7m of exceptional operating charges in 2012 (2011: £9.8m) as a result of integrating BSS into the Group. The charges arose mainly<br />
as a result of the on-going programme to integrate BSS colleagues, systems <strong>and</strong> processes into the Group, although in 2011 there was a £2.2m charge due<br />
to the closure <strong>and</strong> disposal of businesses that were determined to be non-core to the Group’s operations.<br />
The Group released £6.0m through operating profit as exceptional items for onerous lease provisions that are no longer required because properties have<br />
been sublet.<br />
The Group recognised £35.3m of exceptional fair value gains in investment income when the requirements of IFRS 3 (2008) Business Combinations were<br />
applied to the investments held in Toolstation. This acquisition has resulted in the Group’s existing 30% associate interest being re-measured to its fair<br />
value at the acquisition date. The exceptional item recognised by the Group was £2.1m higher due to the revaluation of the intra-group loan.<br />
In accordance with IAS 39 the contingent consideration payable in respect of Toolstation has been reassessed at 31 December 2012 <strong>and</strong> as a result<br />
the discounted amount previously recognised of £51.2m has been reduced to £47.0m with the difference of £4.2m being credited to income statement as<br />
exceptional investment income.<br />
To enable readers of the financial statements to obtain a clear underst<strong>and</strong>ing of underlying trading, the Directors have shown the exceptional items<br />
separately in the group income statement.<br />
94
TRAVIS PERKINS ANNUAL REPORT AND ACCOUNTS 2012<br />
5. Profit continued<br />
Operating profit has been arrived at after charging / (crediting):<br />
THE GROUP<br />
THE COMPANY<br />
–––––––––––––––––––––––––––––––––––––– ––––––––––––––––––––––––––––––––––––––<br />
2012 2011 2012 2011<br />
£m £m £m £m<br />
Movement of provisions against inventories (0.4) (0.3) - -<br />
Cost of inventories recognised as an expense 3,381.5 3,356.1 - -<br />
Pension costs included in cost of sales 0.5 0.5 - -<br />
Pension costs in administration expenses 4.1 1.4 0.4 0.4<br />
Pension costs in selling <strong>and</strong> distribution costs 12.6 10.9 - -<br />
Depreciation of property, plant <strong>and</strong> equipment 69.4 63.9 - -<br />
Staff costs (see note 7) 605.1 579.7 11.5 12.4<br />
Gain on disposal of property, plant <strong>and</strong> equipment (17.1) (16.3) - -<br />
Rental income (4.2) (4.2) - -<br />
Hire of vehicles, plant <strong>and</strong> machinery 34.0 33.4 - -<br />
Other leasing charges – property 175.6 164.3 - -<br />
Amortisation of intangible assets 17.4 12.9 - -<br />
Auditor remuneration for audit services 0.4 0.4 0.1 0.1<br />
During the year the Group incurred the following costs for services provided by the Company’s auditor:<br />
THE GROUP<br />
––––––––––––––––––––––––––––––––––––––<br />
2012 2011<br />
£000 £000<br />
Fees payable to the Company’s auditor for the audit of the Company’s annual accounts 106 104<br />
Fees payable to the Company’s auditor for the audit of the Company’s subsidiaries 325 297<br />
Fees paid to the Company’s auditor for other services:<br />
Audit related assurance services 73 107<br />
Other services relating to taxation – advisory 56 192<br />
560 700<br />
Audit related assurance services includes £18,000 (2011: £17,000) which was paid to the auditor by the Travis Perkins Pension <strong>and</strong> Dependents Benefit<br />
Scheme.<br />
A description of the work of the Audit Committee is set out in the Audit Committee report on pages 61 to 63, <strong>and</strong> includes an explanation of how auditor<br />
objectivity <strong>and</strong> independence is safeguarded when non-audit services are provided by the auditor.<br />
b. Adjusted profit before <strong>and</strong> after tax<br />
THE GROUP<br />
––––––––––––––––––––––––––––––––––––––<br />
2012 2011<br />
£m £m<br />
Profit before tax 313.3 269.6<br />
Exceptional items (30.8) 14.2<br />
Amortisation of intangible assets 17.4 12.9<br />
Adjusted profit before tax 299.9 296.7<br />
THE GROUP<br />
––––––––––––––––––––––––––––––––––––––<br />
2012 2011<br />
£m £m<br />
Profit after tax 259.6 212.4<br />
Exceptional items (30.8) 14.2<br />
Amortisation of intangible assets 17.4 12.9<br />
Tax on exceptional items <strong>and</strong> amortisation (6.1) (7.9)<br />
Effect of reduction in corporation tax rate on deferred tax (13.3) (12.6)<br />
FINANCIAL<br />
STATEMENTS<br />
Adjusted profit after tax 226.8 219.0<br />
95
NOTES TO THE FINANCIAL STATEMENTS<br />
5. Profit continued<br />
c. Adjusted operating margin<br />
General Specialist Plumbing<br />
merchanting Merchanting Consumer & Heating Unallocated Group<br />
–––––––––––––––––––––– –––––––––––––––––––––– –––––––––––––––––––––– –––––––––––––––––––––– –––––––––––––––––––––– ––––––––––––––––––––––<br />
2012 2011 2012 2011 2012 2011 2012 2011 2012 2011 2012 2011<br />
£m £m £m £m £m £m £m £m £m £m £m £m<br />
Revenue 1,456.7 1,443.3 603.6 582.2 1,152.5 1,017.8 1,632.1 1,735.8 - - 4,844.9 4,779.1<br />
Segment result 167.3 164.6 31.3 25.3 65.8 46.0 45.8 63.6 (9.7) (9.0) 300.5 290.5<br />
Amortisation of<br />
intangible assets - - - - 4.9 - 12.5 12.9 - - 17.4 12.9<br />
Exceptional items - 5.9 0.2 0.6 (6.0) - 14.5 3.3 - - 8.7 9.8<br />
Adjusted segment<br />
result 167.3 170.5 31.5 25.9 64.7 46.0 72.8 79.8 (9.7) (9.0) 326.6 313.2<br />
Adjusted operating<br />
margin 11.5% 11.8% 5.2% 4.4% 5.6% 4.5% 4.5% 4.6% - - 6.7% 6.6%<br />
Segmental information is shown in note 6. As outlined in note 6, on 1 January 2012 the Group was reorganised into four divisions, General Merchanting,<br />
Specialist Merchanting, Consumer <strong>and</strong> Plumbing <strong>and</strong> Heating.<br />
6. Business <strong>and</strong> geographical segments<br />
As required by IFRS 8 the operating segments are identified on the basis of internal reports about components of the Group that are regularly reviewed<br />
by the Chief Executive to assess their performance. On 1 January 2012, the Group was reorganised into four divisions, General Merchanting, Specialist<br />
Merchanting, Consumer <strong>and</strong> Plumbing <strong>and</strong> Heating. Prior year figures have been restated to reflect the new segments. All four divisions sell building<br />
materials to a wide range of customers, none of which are dominant, <strong>and</strong> operate almost exclusively in the United Kingdom <strong>and</strong> consequently no<br />
geographical information is presented.<br />
Segment profit represents the profit earned by each segment without allocation of certain central costs, finance income <strong>and</strong> costs <strong>and</strong> income tax<br />
expense. Unallocated segment assets <strong>and</strong> liabilities comprise financial instruments, current <strong>and</strong> deferred taxation, cash <strong>and</strong> borrowings <strong>and</strong> pension<br />
scheme assets <strong>and</strong> liabilities.<br />
Inter-segment sales are eliminated. During 2012 <strong>and</strong> 2011 there were no impairment losses or reversals of impairment losses recognised in profit or loss<br />
or in equity in any of the reportable segments.<br />
2012<br />
––––––––––––––––––––––––––––––––––––––––––––––––––––––––––––––––––––––––––––––––––––––––––––––––––––––––––––––––––––––––––––––––––––––––––––––––––––––––––––––––––––––––––––––––––––––––––––<br />
General Specialist Plumbing<br />
M merchanting Merchanting Consumer & Heating Unallocated Eliminations Consolidated<br />
£m £m £m £m £m £m £m<br />
Revenue 1,456.7 603.6 1,152.5 1,632.1 - - 4,844.9<br />
Result<br />
Segment result 167.3 31.3 65.8 45.8 (9.7) - 300.5<br />
Exceptional investment income - - 39.5 - - - 39.5<br />
Finance income - - - - 13.8 - 13.8<br />
Finance costs - - - - (40.5) - (40.5)<br />
Profit before taxation 167.3 31.3 105.3 45.8 (36.4) - 313.3<br />
Taxation - - - - (53.7) - (53.7)<br />
Profit for the year 167.3 31.3 105.3 45.8 (90.1) - 259.6<br />
Segment assets 2,121.7 469.7 1,653.4 1,166.6 179.3 (1,233.5) 4,357.2<br />
Segment liabilities (659.7) (13.7) (415.5) (232.4) (1,961.3) 1,233.5 (2,049.1)<br />
Consolidated net assets 1,462.0 456.0 1,237.9 934.2 (1,782.0) - 2,308.1<br />
Exceptional items - 0.2 (6.0) 14.5 - - 8.7<br />
Capital expenditure 44.2 11.5 17.8 11.0 - - 84.5<br />
Amortisation - - 4.9 12.5 - - 17.4<br />
Depreciation 33.6 8.3 17.8 9.7 - - 69.4<br />
96
TRAVIS PERKINS ANNUAL REPORT AND ACCOUNTS 2012<br />
6. Business <strong>and</strong> geographical segments continued<br />
2011<br />
––––––––––––––––––––––––––––––––––––––––––––––––––––––––––––––––––––––––––––––––––––––––––––––––––––––––––––––––––––––––––––––––––––––––––––––––––––––––––––––––––––––––––––––––––––––––––––<br />
General Specialist Plumbing &<br />
M merchanting Merchanting Consumer Heating Unallocated Eliminations Consolidated<br />
£m £m £m £m £m £m £m<br />
Revenue 1,443.3 582.2 1,017.8 1,735.8 - - 4,779.1<br />
Result<br />
Segment result 164.6 25.3 46.0 63.6 (9.0) - 290.5<br />
Finance income - - - - 22.4 - 22.4<br />
Finance costs - - - - (43.3) - (43.3)<br />
Profit before taxation 164.6 25.3 46.0 63.6 (29.9) - 269.6<br />
Taxation - - - - (57.2) - (57.2)<br />
Profit for the year 164.6 25.3 46.0 63.6 (87.1) - 212.4<br />
Segment assets 2,096.3 457.9 1,520.3 1,145.2 198.7 (1,227.2) 4,191.2<br />
Segment liabilities (655.6) (17.6) (398.7) (288.9) (1,949.8) 1,227.2 (2,083.4)<br />
Consolidated net assets 1,440.7 440.3 1,121.6 856.3 (1,751.1) - 2,107.8<br />
Exceptional items 5.9 0.6 3.3 - - - 9.8<br />
Capital expenditure 58.1 14.8 25.8 9.3 0.1 - 108.1<br />
Amortisation - - - 12.9 - - 12.9<br />
Depreciation 32.6 7.7 13.9 9.7 - - 63.9<br />
Unallocated segment assets <strong>and</strong> liabilities comprise the following:<br />
2012 2011<br />
£m £m<br />
Assets<br />
Interest in associates 6.7 51.3<br />
Financial instruments 25.5 43.4<br />
Cash <strong>and</strong> cash equivalents 139.1 78.6<br />
Retirement benefit asset 1.6 19.3<br />
Unallocated corporate assets 6.4 6.1<br />
179.3 198.7<br />
Liabilities<br />
Financial instruments (7.5) (5.9)<br />
Tax liabilities (74.8) (75.9)<br />
Deferred tax liabilities (85.0) (97.4)<br />
Retirement benefit obligations (59.1) (65.0)<br />
Interest bearing loans, borrowings <strong>and</strong> loan notes (591.3) (661.8)<br />
Intra-group creditors (1,124.2) (1,026.8)<br />
Unallocated corporate liabilities (19.4) (17.0)<br />
(1,961.3) (1,949.8)<br />
FINANCIAL<br />
STATEMENTS<br />
97
NOTES TO THE FINANCIAL STATEMENTS<br />
7. Staff costs<br />
a. The average monthly number of persons employed (including executive directors)<br />
THE GROUP<br />
THE COMPANY<br />
–––––––––––––––––––––––––––––––––––––– ––––––––––––––––––––––––––––––––––––––<br />
2012 2011 2012 2011<br />
No. No. No. No.<br />
Sales 16,150 15,923 - -<br />
Distribution 3,138 3,240 - -<br />
Administration 2,599 2,260 50 42<br />
21,887 21,423 50 42<br />
b. Aggregate remuneration<br />
THE GROUP<br />
THE COMPANY<br />
–––––––––––––––––––––––––––––––––––––– ––––––––––––––––––––––––––––––––––––––<br />
2012 2011 2012 2011<br />
£m £m £m £m<br />
Wages <strong>and</strong> salaries 541.5 519.0 6.5 6.7<br />
Share based payments (note 8) 15.2 13.9 4.3 5.1<br />
Social security costs 48.4 46.8 0.7 0.6<br />
Other pension costs (note 28) 17.2 12.8 0.4 0.4<br />
622.3 592.5 11.9 12.8<br />
8. Share-based payments<br />
The following disclosures relate to share option <strong>and</strong> SAYE grants made after 7 November 2002.<br />
The Black-Scholes option-pricing model is used to calculate the fair value of the options <strong>and</strong> the amount to be expensed. The probability of the<br />
performance conditions being achieved was included in the fair value calculations. The inputs into the model for options granted in the year expressed as<br />
weighted averages are as follows:<br />
2012 2011<br />
––––––––––––––––––––––––––––––––––––––––––––––––––––––––––––––––––––––––––––– ––––––––––––––––––––––––––––––––––––––<br />
Executive Nil price Nil price<br />
options SAYE options SAYE options<br />
Share price at grant date (pence) - Group 912 1,114 1,062 833 975<br />
Option exercise price (pence) - Group 806 818 - 657 -<br />
Share price at grant date (pence) - Company 912 1,114 1,062 833 975<br />
Option exercise price (pence) - Company 806 818 - 657 -<br />
Volatility (%) – Group <strong>and</strong> Company 53.0% 38.4% 40.9% 48.6% 61.4%<br />
Option life (years) – Group <strong>and</strong> Company 3.0 3.3 3.0 3.5 3.0<br />
Risk-free interest rate (%) – Group <strong>and</strong> Company 1.0% 0.4% 0.5% 0.9% 1.7%<br />
Expected dividends as a dividend yield (%) –<br />
Group <strong>and</strong> Company 1.7% 2.3% 2.3% 1.8% 1.9%<br />
Volatility was based on historic share prices over a period equal to the vesting period. Option life used in the model has been based on options being<br />
exercised in accordance with historical patterns. For executive share options the vesting period is 3 years. If options remain unexercised after a period of 10<br />
years from the date of grant, these options expire. Options are forfeited if the employee leaves the Group before options vest. SAYE options vest after 3 or 5<br />
years <strong>and</strong> expire 3½ or 5½ years after the date of grant.<br />
The risk-free interest rate of return is the yield on zero-coupon UK Government bonds on a term consistent with the vesting period. Dividends used are<br />
based on actual dividends where data is known <strong>and</strong> future dividends estimated using a dividend cover of three times.<br />
The expected life used in the model has been adjusted, based upon management’s best estimate, for the effect of non-transferability, exercise restrictions<br />
<strong>and</strong> behavioural considerations.<br />
SAYE options were granted on 27 September 2012. The estimated fair value of the shares at that date was £5.4m for the Group <strong>and</strong> £0.1m for the<br />
Company.<br />
Shares were granted under the share-matching scheme on 14 March 2012 <strong>and</strong> 9 May 2012. The estimated fair value of the shares at those dates was<br />
£5.1m for the Group <strong>and</strong> £2.4m for the Company.<br />
Shares were granted under the performance share plan on 2 March 2012, 20 April 2012 <strong>and</strong> 22 August 2012. The estimated fair value of the shares at<br />
those dates was £7.4m for the Group <strong>and</strong> £2.5m for the Company.<br />
Shares were granted under the deferred share bonus plan on 2 March 2012. The estimated fair value of the shares at that date was £1.1m for the Group<br />
<strong>and</strong> £0.6m for the Company.<br />
The Group charged £15.2m (2011: £13.9m) <strong>and</strong> the Company charged £4.3m (2011: £5.1m) to the income statement in respect of equity-settled sharebased<br />
payment transactions.<br />
98
TRAVIS PERKINS ANNUAL REPORT AND ACCOUNTS 2012<br />
8. Share-based payments continued<br />
The number <strong>and</strong> weighted average exercise price of share options is as follows:<br />
THE GROUP<br />
––––––––––––––––––––––––––––––––––––––––––––––––––––––––––––––––––––––––––––––––––––––––––––––––––––––––––––––––––––––––––––––––––––––––––––––––––––––<br />
2012 2011<br />
––––––––––––––––––––––––––––––––––––––––––––––––––––––––––––––––– –––––––––––––––––––––––––––––––––––––––––––––––––––––––––––––––––<br />
Weighted Number Number Weighted Number<br />
average of of nil price average Number of nil price<br />
exercise price options options exercise price of options options<br />
In thous<strong>and</strong>s of options<br />
p No. No. p No. No.<br />
Outst<strong>and</strong>ing at the beginning of the period 636 8,050 4,875 582 8,917 4,454<br />
Forfeited during the period 598 (536) (92) 778 (1,290) (712)<br />
Exercised during the period 552 (1,379) (500) 392 (2,473) (248)<br />
Granted during the period 839 1,583 1,416 657 2,896 1,381<br />
Outst<strong>and</strong>ing at the end of the period 695 7,718 5,699 636 8,050 4,875<br />
Exercisable at the end of the period 792 1,227 1,540 718 1,656 -<br />
Share options were exercised on a regular basis throughout the year. The weighted average share price for options exercised during the year was 1,037<br />
pence (2011: 837 pence).<br />
Details of the options outst<strong>and</strong>ing at 31 December 2012 were as follows:<br />
THE GROUP<br />
––––––––––––––––––––––––––––––––––––––––––––––––––––––––––––––––––––––––––––––––––––––––––––––––––––––––––––––––––––––––––––––––––––––––––––––––––––––<br />
2012 2011<br />
––––––––––––––––––––––––––––––––––––––––––––––––––––––––––––––––– –––––––––––––––––––––––––––––––––––––––––––––––––––––––––––––––––<br />
Executive Nil price Executive Nil price<br />
options SAYE options options SAYE options<br />
Range of exercise prices (pence) 201-1,611 442-1,114 - 201-1,611 442-1,114 -<br />
Weighted average exercise price (pence) 880 651 - 733 604 -<br />
Number of shares (thous<strong>and</strong>s) 1,499 6,220 5,699 1,992 6,058 4,874<br />
Weighted average expected remaining life (years) 0.7 2.1 0.9 0.7 2.6 1.2<br />
Weighted average contractual remaining life (years) 4.9 2.6 7.7 5.3 3.1 8.2<br />
If all 1.5 million outst<strong>and</strong>ing executive options vest <strong>and</strong> then are exercised on the date of vesting, or in the case of SAYE all 6.2 million shares are acquired<br />
on the first possible day, 7.7 million of shares will be issued for a consideration of £53.7m in the years ending 31 December:<br />
31 December 2013 2014 2015 2016 2017<br />
No. Value No. Value No. Value No. Value No. Value<br />
m £m m £m m £m m £m m £m<br />
Options 1.2 10.4 0.2 1.4 0.1 1.4 - - - -<br />
SAYE 1.9 9.5 2.1 13.8 1.4 11.2 0.6 4.1 0.2 1.9<br />
The table above shows theoretical amounts. For the Company to receive the cash indicated in the periods shown, the following must occur:<br />
• All performance conditions on executive share options must be fully met;<br />
• Options must be exercised on the day they vest (option holders generally have a 7 year period post vesting to exercise the option);<br />
• The share price at the exercise date for SAYE options must exceed the exercise price <strong>and</strong> every holder must exercise;<br />
• All option/SAYE holders must remain with the Company, or leave on good terms.<br />
If none of the requirements are met then the Company will receive no consideration.<br />
The number <strong>and</strong> weighted average exercise price of share options is as follows:<br />
THE COMPANY<br />
––––––––––––––––––––––––––––––––––––––––––––––––––––––––––––––––––––––––––––––––––––––––––––––––––––––––––––––––––––––––––––––––––––––––––––––––––––––<br />
2012 2011<br />
––––––––––––––––––––––––––––––––––––––––––––––––––––––––––––––––– –––––––––––––––––––––––––––––––––––––––––––––––––––––––––––––––––<br />
Weighted Number Number Weighted Number<br />
average of of nil price average Number of nil price<br />
exercise price options options exercise price of options options<br />
In thous<strong>and</strong>s of options<br />
p No. No. p No. No.<br />
Outst<strong>and</strong>ing at the beginning of the period 606 111 2,197 698 473 2,166<br />
Forfeited during the period 746 (96) - 362 (55) (361)<br />
Exercised during the period 372 (44) (15) 952 (318) (168)<br />
Transferred from other group companies 746 317 80 - - -<br />
Granted during the period 918 12 575 657 11 560<br />
FINANCIAL<br />
STATEMENTS<br />
Outst<strong>and</strong>ing at the end of the period 756 300 2,837 606 111 2,197<br />
Exercisable at the end of the period 784 219 126 713 33 -<br />
99
NOTES TO THE FINANCIAL STATEMENTS<br />
8. Share-based payments continued<br />
Details of the options outst<strong>and</strong>ing at 31 December 2012 were as follows:<br />
THE COMPANY<br />
––––––––––––––––––––––––––––––––––––––––––––––––––––––––––––––––––––––––––––––––––––––––––––––––––––––––––––––––––––––––––––––––––––––––––––––––––––––<br />
2012 2011<br />
––––––––––––––––––––––––––––––––––––––––––––––––––––––––––––––––– –––––––––––––––––––––––––––––––––––––––––––––––––––––––––––––––––<br />
Executive Nil price Executive Nil price<br />
options SAYE options options SAYE options<br />
Range of exercise prices (pence) 201 - 1,611 442 - 1,114 - 201 - 1,611 442 - 1,114 -<br />
Weighted average exercise price (pence) 806 548 - 700 516 -<br />
Number of shares (thous<strong>and</strong>s) 241 58 2,837 54 56 2,196<br />
Weighted average expected remaining life (years) 0.3 1.5 0.7 1.0 2.2 1.1<br />
Weighted average contractual remaining life (years) 4.0 2.0 7.5 6.0 2.7 8.1<br />
9. Net finance costs<br />
THE GROUP<br />
––––––––––––––––––––––––––––––––––––––––––––––––––––––––––––––––––––––––––––––––––––––––––––<br />
2012 2011 2011 2011<br />
Pre-exceptional Exceptional<br />
items items Total<br />
£m £m £m £m<br />
Interest on bank loans <strong>and</strong> overdrafts * (24.7) (26.6) - (26.6)<br />
Interest on obligations under finance leases (1.1) (1.2) - (1.2)<br />
Unwinding of discounts (5.0) (5.7) - (5.7)<br />
Amortisation of cancellation payment for swaps accounted for as cash flow hedges (4.1) (4.2) - (4.2)<br />
Other interest (1.7) (1.2) - (1.2)<br />
Net loss on settlement of private placement - - (4.4) (4.4)<br />
Net loss on re-measurement of derivatives at fair value (3.9) - - -<br />
Finance costs (40.5) (38.9) (4.4) (43.3)<br />
Other finance income - pension scheme 11.1 11.8 - 11.8<br />
Amortisation of cancellation receipt for swap accounted for as fair value hedge 1.0 1.1 - 1.1<br />
Net gain on re-measurement of derivatives at fair value 1.3 5.1 - 5.1<br />
Interest receivable 0.4 4.4 - 4.4<br />
Finance income 13.8 22.4 - 22.4<br />
Net finance costs (26.7) (16.5) (4.4) (20.9)<br />
Adjusted interest cover 13.1x 15.4x<br />
*<br />
Includes £1.2m (2011: £3.1m) of amortised bank finance charges.<br />
Adjusted interest cover is calculated by dividing, adjusted operating profit of £326.6m (2011: £313.2m) less £1.5m (2011: £1.5m) of specifically excluded<br />
IFRS adjustments, by the combined value of interest on bank loans <strong>and</strong> overdrafts (excluding amortised bank finance charges), other interest payable <strong>and</strong><br />
interest receivable, which total £24.8m (2011: £20.3m).<br />
The pre exceptional unwinding of the discounts charge arises principally from the property provisions created in 2008 <strong>and</strong> the liability to the pension<br />
scheme associated with the SPV.<br />
During 2011 the Group repaid $125m of the BSS unsecured senior notes <strong>and</strong> terminated the associated derivatives. This resulted in a net loss of £4.4m,<br />
which was shown as exceptional.<br />
100
TRAVIS PERKINS ANNUAL REPORT AND ACCOUNTS 2012<br />
9. Net finance costs continued<br />
THE COMPANY<br />
––––––––––––––––––––––––––––––––––––––<br />
2012 2011<br />
£m £m<br />
Interest on bank loans <strong>and</strong> overdrafts * (25.5) (26.4)<br />
Interest payable to group companies (15.6) (6.4)<br />
Amortisation of cancellation payment for swaps accounted for as cash flow hedges (4.1) (4.2)<br />
Other interest (1.7) (1.2)<br />
Net loss on re-measurement of derivatives at fair value (3.9) (1.6)<br />
Finance costs (50.8) (39.8)<br />
Amortisation of cancellation receipt for swap accounted for as fair value hedge 1.0 1.1<br />
Net gain on re-measurement of derivatives at fair value 1.3 5.1<br />
Interest receivable from group companies 1.0 -<br />
Interest receivable 0.4 13.3<br />
Finance income 3.7 19.5<br />
Net finance costs (47.1) (20.3)<br />
*<br />
Includes £1.2m (2011: £3.1m) of amortised bank finance charges.<br />
10. Tax<br />
THE GROUP<br />
THE COMPANY<br />
––––––––––––––––––––––––––––––––––––––––––––––––––––––––––––––––––––––––––––––––––––––––––––––––––––––––––––––––––––––––––––––––––––––– –––––––––––––––––––––––––––––––––<br />
2012 2012 2012 2011 2011 2011 2012 2011<br />
Pre-exceptional Exceptional Pre-exceptional Exceptional<br />
items items Total items items Total<br />
£m £m £m £m £m £m £m £m<br />
Current tax<br />
UK corporation tax<br />
– current year 68.0 (2.2) 65.8 72.5 (3.3) 69.2 (13.5) (8.1)<br />
– prior year (1.1) - (1.1) (1.1) (1.4) (2.5) 2.5 (1.4)<br />
Total current tax 66.9 (2.2) 64.7 71.4 (4.7) 66.7 (11.0) (9.5)<br />
Deferred tax<br />
– current year 1.6 (13.3) (11.7) 2.8 (12.6) (9.8) (2.3) (0.6)<br />
– prior year 0.7 - 0.7 0.3 - 0.3 0.1 -<br />
Total deferred tax 2.3 (13.3) (11.0) 3.1 (12.6) (9.5) (2.2) (0.6)<br />
Total tax charge 69.2 (15.5) 53.7 74.5 (17.3) 57.2 (13.2) (10.1)<br />
The differences between the total tax charge shown above <strong>and</strong> the amount calculated by applying the st<strong>and</strong>ard rate of UK corporation tax to the profit<br />
before tax are as follows:<br />
THE GROUP<br />
–––––––––––––––––––––––––––––––––––––––––––––––––––––––––––––––––––––––––––––––––––––––––––––––––––––––––––––<br />
2012 2011<br />
–––––––––––––––––––––––––––––––––––––– ––––––––––––––––––––––––––––––––––––––<br />
£m % £m %<br />
Profit before tax 313.3 269.6<br />
Tax at the UK corporation tax rate 76.7 24.5 71.4 26.5<br />
Tax effect of expenses / credits that are not deductible /<br />
taxable in determining taxable profit 1.1 0.4 1.9 0.7<br />
Depreciation of non-qualifying property 2.8 0.9 2.3 0.8<br />
Exceptional valuation gain not taxable (8.6) (2.7) 0.5 0.2<br />
Exceptional fair value movement not taxable (1.0) (0.3) - -<br />
Deferred tax rate change (13.3) (4.4) (12.6) (4.7)<br />
Property sales (3.6) (1.2) (4.1) (1.5)<br />
Exceptional prior period adjustment - - (1.4) (0.5)<br />
Prior period adjustment (0.4) (0.1) (0.8) (0.3)<br />
FINANCIAL<br />
STATEMENTS<br />
Tax expense <strong>and</strong> effective tax rate for the year 53.7 17.1 57.2 21.2<br />
101
NOTES TO THE FINANCIAL STATEMENTS<br />
10. Tax continued<br />
The tax rate for the year of 24.5% is a blended rate of 26% up to 1 April 2012 <strong>and</strong> 24% thereafter. The tax charge for 2012 includes an exceptional credit<br />
of £13.3m arising from the reduction in the rate of UK corporation tax from 25% to 23% on 1 April 2013. Future changes reducing the corporation tax rate<br />
by 2% to 21% on 1 April 2014 <strong>and</strong> a further 1% to 20% on 1 April 2015 have been announced, but not substantively enacted <strong>and</strong> therefore have not been<br />
taken into account.<br />
If the government announced plans are fully enacted then the statutory rate of corporation tax will fall to 23.25% in 2013, 21.5% in 2014 <strong>and</strong> 20.25% in<br />
2015.<br />
In addition to the amount charged to the income statement the following amounts relating to tax have been recognised in other comprehensive income:<br />
THE GROUP<br />
THE COMPANY<br />
–––––––––––––––––––––––––––––––––––––– ––––––––––––––––––––––––––––––––––––––<br />
2012 2011 2012 2011<br />
£m £m £m £m<br />
Deferred tax<br />
Cash flow hedge movement (0.9) (0.6) (0.9) (0.6)<br />
Actuarial movement 10.4 12.6 - -<br />
Rate change (5.5) (4.9) - -<br />
4.0 7.1 (0.9) (0.6)<br />
In addition to the amounts charged to the income statement <strong>and</strong> other comprehensive income, the following amounts relating to tax have been recognised<br />
directly in equity:<br />
THE GROUP<br />
THE COMPANY<br />
–––––––––––––––––––––––––––––––––––––– ––––––––––––––––––––––––––––––––––––––<br />
2012 2011 2012 2011<br />
£m £m £m £m<br />
Current tax<br />
Excess tax deductions related to share based payments on exercised options 1.4 1.0 - -<br />
Deferred tax<br />
Rate change on revaluation reserve 0.9 0.9 - -<br />
Share based payments 2.9 (4.2) 3.0 (4.1)<br />
5.2 2.3 3.0 (4.1)<br />
THE COMPANY<br />
–––––––––––––––––––––––––––––––––––––––––––––––––––––––––––––––––––––––––––––––––––––––––––––––––––––––––––––<br />
2012 2011<br />
–––––––––––––––––––––––––––––––––––––– ––––––––––––––––––––––––––––––––––––––<br />
£m % £m %<br />
Profit before tax 52.6 48.6<br />
Intercompany dividends (74.2) (79.1)<br />
Loss before tax <strong>and</strong> dividends received (21.6) (30.5)<br />
Tax at the UK corporation tax rate of 24.5% / 26.5% (5.3) (24.5) (8.1) (26.5)<br />
Tax effect of expenses / credits that are not deductible /<br />
taxable in determining taxable profit (1.7) (7.9) (1.5) (5.0)<br />
Prior period adjustment 2.6 12.0 (1.4) (4.6)<br />
Deferred tax rate change 0.4 1.9 0.6 2.0<br />
Exceptional valuation gain not taxable (8.2) (38.0) - -<br />
Exceptional fair value movement not taxable (1.0) (4.6) - -<br />
Receipts in subsidiary taxable in Company - - 0.3 1.0<br />
Tax expense <strong>and</strong> effective tax rate for the year (13.2) (61.1) (10.1) (33.1)<br />
102
TRAVIS PERKINS ANNUAL REPORT AND ACCOUNTS 2012<br />
11. Earnings per share<br />
a. Basic <strong>and</strong> diluted earnings per share<br />
2012 2011<br />
£m £m<br />
Earnings<br />
Earnings for the purposes of basic <strong>and</strong> diluted earnings per share<br />
being net profit attributable to equity holders of the Parent Company 259.6 212.4<br />
Number of shares No. No.<br />
Weighted average number of shares for the purposes of basic earnings per share 238,388,160 235,151,104<br />
Dilutive effect of share options on potential ordinary shares 8,809,106 8,057,058<br />
Weighted average number of ordinary shares for the purposes of diluted earnings per share 247,197,266 243,208,162<br />
At 31 December 2012, 692,839 (2011: 796,390) share options had an exercise price in excess of the market value of the shares on that day. As a result, these<br />
share options are excluded from the calculation of diluted earnings per share.<br />
b. Adjusted earnings per share<br />
Adjusted earnings per share is calculated by excluding the effect of the exceptional items <strong>and</strong> amortisation from earnings.<br />
2012 2011<br />
£m £m<br />
Earnings for the purposes of basic <strong>and</strong> diluted earnings per share<br />
being net profit attributable to equity holders of the Parent Company 259.6 212.4<br />
Exceptional items (30.8) 14.2<br />
Amortisation of intangible assets 17.4 12.9<br />
Tax on amortisation of intangible assets (4.0) (3.2)<br />
Tax on exceptional items (2.1) (4.7)<br />
Effect of reduction in corporation tax rate on deferred tax (13.3) (12.6)<br />
Adjusted earnings 226.8 219.0<br />
Adjusted earnings per share 95.1p 93.1p<br />
Adjusted diluted earnings per share 91.7p 90.0p<br />
12. Dividends<br />
Amounts were recognised in the financial statements as distributions to equity shareholders as follows:<br />
2012 2011<br />
£m £m<br />
Final dividend for the year ended 31 December 2011 of 13.5p (2010: 10.0p) per ordinary share 32.1 23.5<br />
Interim dividend for the year ended 31 December 2012 of 8.0p (2011: 6.5p) per ordinary share 19.1 15.3<br />
Total dividend recognised during the year 51.2 38.8<br />
The Company is proposing a final dividend of 17.0p in respect of the year ended 31 December 2012.<br />
Adjusted dividend cover of 3.8x (2011: 4.7x) is calculated by dividing adjusted earnings per share (note 11) of 95.1p (2011: 93.1p) by the total dividend<br />
for the year of 25.0p (2011: 20.0p).<br />
There are no income tax consequences in respect of the dividends declared, but not recognised in the financial statements.<br />
The dividends declared for 2012 at 31 December 2012 <strong>and</strong> for 2011 at 31 December 2011 were as follows:<br />
2012 2011<br />
Pence<br />
Pence<br />
Interim paid 8.0 6.5<br />
Final proposed 17.0 13.5<br />
FINANCIAL<br />
STATEMENTS<br />
Total dividend for the year 25.0 20.0<br />
The anticipated cash payment in respect of the proposed final dividend is £40.7m (2011: £32.1m).<br />
103
NOTES TO THE FINANCIAL STATEMENTS<br />
13. Goodwill<br />
THE GROUP<br />
––––––––––––––––––––––––––––––––––––––––––––––––––––––––––––––––––––––––––––––––––––––––––––––––––––––––––––––––––––––––––––––––<br />
General<br />
Specialist<br />
P&H Consumer Merchanting Merchanting Total<br />
£m £m £m £m £m<br />
Cost<br />
At 1 January 2011 367.2 719.9 465.6 145.1 1,697.8<br />
Recognised on acquisitions during the year - 8.4 - - 8.4<br />
At 1 January 2012 367.2 728.3 465.6 145.1 1,706.2<br />
Recognised on acquisitions during the year (note 29) - 102.9 0.6 - 103.5<br />
Adjustment to Tile Giant consideration - (2.2) - - (2.2)<br />
At 31 December 2012 367.2 829.0 466.2 145.1 1,807.5<br />
There has been no impairment to the carrying value of goodwill. The Company has no goodwill.<br />
The Group has recently concluded discussions with the Financial <strong>Report</strong>ing Council’s Conduct Committee (‘FRCCC’) with regard to certain aspects of its<br />
asset impairment testing process. As a result, the Group has (i) amended its definition of a cash generating unit so that non-monetary assets are reviewed<br />
for impairment at a branch level, rather than at a br<strong>and</strong> level; (ii) refined its calculation of the pre-tax discount rate; <strong>and</strong> (iii) restated <strong>and</strong> extended the<br />
comparative sensitivity disclosures made below in respect of 2011.<br />
The changes agreed with the FRCCC have not impacted the income statement, balance sheet or cash flow statement for 2011 or 2012; the Directors’<br />
original assessment that no impairment had occurred to goodwill, other intangible assets or other non-monetary assets remains unchanged. Further<br />
details are given below.<br />
Cash Generating Units<br />
The Directors consider that each branch in the Group is an individual Cash Generating Unit (‘CGU’). Goodwill <strong>and</strong> intangible assets have been allocated<br />
<strong>and</strong> monitored for impairment testing purposes to groups of individual CGUs within the same br<strong>and</strong>. The following analyses goodwill <strong>and</strong> intangible<br />
assets with indefinite useful lives by CGU grouping.<br />
CGU Grouping<br />
2012 2011<br />
––––––––––––––––––––––––––––––––––––––––––––––––––––––––––––––––––– –––––––––––––––––––––––––––––––––––––––––––––––––––––––––––––––––––<br />
Intangibles<br />
Intangibles<br />
(Note 14) Goodwill Total (Note 14) Goodwill Total<br />
£m £m £m £m £m £m<br />
Specialist Merchanting<br />
CCF - 43.6 43.6 - 43.6 43.6<br />
Keyline - 101.5 101.5 - 101.5 101.5<br />
Generalist Merchanting<br />
Travis Perkins - 466.2 466.2 - 465.6 465.6<br />
Consumer<br />
Tile Giant - 24.6 24.6 - 26.8 26.8<br />
Toolstation - 102.9 102.9 - - -<br />
Wickes 162.5 701.5 864.0 162.5 701.5 864.0<br />
Plumbing <strong>and</strong> Heating<br />
PTS 40.9 133.7 174.6 40.9 133.7 174.6<br />
BSS Industrial 49.3 27.8 77.1 49.3 27.8 77.1<br />
City Plumbing Supplies - 175.4 175.4 - 175.4 175.4<br />
F&P 8.5 30.3 38.8 8.5 30.3 38.8<br />
Other 3.9 - 3.9 3.9 - 3.9<br />
265.1 1,807.5 2,072.6 265.1 1,706.2 1,971.3<br />
Measuring recoverable amounts<br />
The Group tests goodwill <strong>and</strong> other non-monetary assets for impairment annually or more frequently if there are indications that impairment may have<br />
occurred. The recoverable amounts of the goodwill <strong>and</strong> other non-monetary assets are determined from value in use calculations.<br />
The key assumptions for the value in use calculations are those regarding the discount rates, growth rates <strong>and</strong> like-for-like market volume changes which<br />
impact sales <strong>and</strong> therefore cash flow projections. Management estimates pre-tax discount rates that reflect current market assessments of the time value<br />
of money <strong>and</strong> the risks specific to the CGU groupings that are not reflected in the cash flow projections.<br />
At the beginning <strong>and</strong> end of the financial period the fair value of goodwill <strong>and</strong> intangible assets in all segments was in excess of their book value. The<br />
Directors’ calculations have shown that no impairments have occurred. The key variables applied to the value in use calculations were:<br />
• Cash flow forecasts, which were derived from the most recent board approved five-year plans;<br />
104
TRAVIS PERKINS ANNUAL REPORT AND ACCOUNTS 2012<br />
13. Goodwill continued<br />
• The sales market volume assumptions underlying the cash flow forecasts are the directors’ estimates of likely future changes based on historic<br />
performance <strong>and</strong> the current outlook for both the UK economy <strong>and</strong> the UK building materials industry. This is viewed as the key operating assumption<br />
because the state of the building materials market determines the directors’ approach to margin <strong>and</strong> cost maintenance;<br />
• A risk adjusted pre tax discount rate is calculated by reference to the weighted average cost of capital (‘WACC’) of the Group. For 2012, the discount<br />
rate was 8.8% (2011: 8.6% restated see below), which is not significantly different for any individual CGU or CGU grouping. That is because each CGU<br />
operates in the same market, selling the same product types to the same end users <strong>and</strong> so the risk profiles are not dissimilar;<br />
• For 2012, cash flows beyond the five-year plan (2018 <strong>and</strong> beyond) have been determined using a growth rate of 2.1%, which is the average long-term<br />
forecast GDP growth outlined in the Economic <strong>and</strong> Fiscal Outlook report produced by the Office for Budget Responsibility in December 2012. The<br />
directors believe this is the most appropriate indicator of long-term growth rates that is available (2011 growth rate : 2.5%).<br />
Sensitivity of results to changes in assumptions<br />
Whilst management believe the assumptions are realistic, it is possible that an impairment would be identified if any of the above key assumptions were<br />
changed significantly. For instance factors which could cause an impairment are:<br />
• Significant underperformance relative to the forecast results;<br />
• Changes to the way the assets are used or changes to the strategy for the business;<br />
• A further deterioration in the UK economy.<br />
The impairment review calculations are based upon anticipated discounted future cash flows. For most of the CGU groupings, given the prudence already<br />
built into the Group’s five-year plans <strong>and</strong> the level of headroom they show, the Directors do not envisage reasonably possible changes to the key operating<br />
assumptions that are sufficient to generate a different outcome to the impairment calculations undertaken. However for the CGU groupings listed in the<br />
table below this is not the case as the Directors consider that reasonably possible changes in key assumptions could result in discounted future cash flows<br />
being insufficient to allow full recovery of the carrying value of the CGUs’ goodwill <strong>and</strong> other intangible assets.<br />
The Directors have conducted a sensitivity analysis to determine the specific value for each assumption, all other assumptions remaining the same, that<br />
would result in the carrying value of goodwill <strong>and</strong> other intangible assets equalling their recoverable amounts <strong>and</strong> these are shown in the tables below.<br />
31 December 2012<br />
Like-for-like market volume<br />
CGU (Average % per annum) Discount rate % Long term growth rate %<br />
Grouping Headroom Assumption Sensitivity Assumption Sensitivity Assumption Sensitivity<br />
Tile Giant £24m 0.0% (2.7)% 8.8% 13.9% 2.1% (6.0)%<br />
Wickes £146m 0.8% 0.2% 8.8% 9.9% 2.1% 0.7%<br />
PTS £64m (1.6)% (2.8)% 8.8% 11.0% 2.1% (1.1)%<br />
F&P £38m 1.8% (2.6)% 8.8% 12.8% 2.1% (4.1)%<br />
31 December 2011<br />
During the year the calculation of the discount rate used in the impairment calculations was reviewed <strong>and</strong> as a result the methodology was slightly amended.<br />
To show a meaningful comparison to the 2012 impairment sensitivity table, the 2011 discount rate was recalculated using the same methodology, which<br />
resulted in an increase from 6.9% to 8.6%. Had this change been made in 2011, the Directors’ conclusion that there was no impairment to the carrying value<br />
of goodwill <strong>and</strong> intangible assets at 31 December 2011 would not have changed.<br />
Like-for-like market volume<br />
CGU (Average % per annum) Discount rate % Long term growth rate %<br />
Grouping Headroom Assumption Sensitivity Assumption Sensitivity Assumption Sensitivity<br />
Tile Giant £30m 1.7% (1.7)% 8.6% 14.7% 2.5% (7.5)%<br />
Wickes £30m (1.6)% (1.7)% 8.6% 8.8% 2.5% 2.3%<br />
PTS £39m 1.5% 0.7% 8.6% 9.8% 2.5% 0.9%<br />
F&P £47m 1.7% (2.9)% 8.6% 13.7% 2.5% (5.7)%<br />
The sales market volume assumption is the average annual change incorporated in five-year plans of each CGU grouping.<br />
FINANCIAL<br />
STATEMENTS<br />
105
NOTES TO THE FINANCIAL STATEMENTS<br />
14. Other intangible assets<br />
THE GROUP<br />
––––––––––––––––––––––––––––––––––––––––––––––––––––––––––––––––––––––––––––––––––––––––––––––––––––––––<br />
computer<br />
Customer<br />
br<strong>and</strong> software relationships Total<br />
£m £m £m £m<br />
Cost or valuation<br />
At 1 January 2011 275.3 9.9 135.0 420.2<br />
Disposals (6.6) (1.5) (2.5) (10.6)<br />
At 1 January 2012 268.7 8.4 132.5 409.6<br />
Recognised on aquisition (note 29) 29.5 8.7 15.1 53.3<br />
At 31 December 2012 298.2 17.1 147.6 462.9<br />
Amortisation<br />
At 1 January 2011 - 8.1 0.2 8.3<br />
Charged to operating profit in the year 0.3 0.4 12.2 12.9<br />
Disposals - (0.4) (0.1) (0.5)<br />
At 1 January 2012 0.3 8.1 12.3 20.7<br />
Charged to operating profit in the year 1.8 0.9 14.7 17.4<br />
At 31 December 2012 2.1 9.0 27.0 38.1<br />
Net book value<br />
At 31 December 2012 296.1 8.1 120.6 424.8<br />
At 31 December 2011 268.4 0.3 120.2 388.9<br />
2012 2011<br />
£m £m<br />
Cost of br<strong>and</strong>s with an indefinite useful life (note 13) 265.1 265.1<br />
Cost of br<strong>and</strong>s being amortised 33.1 3.6<br />
298.2 268.7<br />
Where a br<strong>and</strong>, which is a leading br<strong>and</strong> in its sector <strong>and</strong> has significant growth prospects, has not been established for a significant period of time, the<br />
Directors do not have sufficient evidence to support a contention that it will have an indefinite useful life. Accordingly for Toolstation <strong>and</strong> certain product<br />
related br<strong>and</strong>s the Directors have decided it is appropriate to amortise their cost over their estimated useful lives.<br />
The Directors consider that the other br<strong>and</strong>s, which are also all leading br<strong>and</strong>s in their sectors with significant histories <strong>and</strong> significant growth prospects<br />
have an indefinite useful life. They are reviewed annually for impairment; details of impairment testing are shown in note 13, but no impairment was<br />
identified in either year.<br />
Acquired customer relationships are amortised over their estimated useful lives, which range from 5 to 15 years.<br />
The Company has no intangible assets.<br />
106
TRAVIS PERKINS ANNUAL REPORT AND ACCOUNTS 2012<br />
15. Property, plant <strong>and</strong> equipment<br />
THE GROUP<br />
THE COMPANY<br />
–––––––––––––––––––––––––––––––––––––––––––––––––––––––––––––––––––––––––––––––––––––––––––––––––––––––––––––––––––– ––-–––––––––––––––––––––<br />
Long Short Plant <strong>and</strong> Plant <strong>and</strong><br />
Freehold leases leases equipment Total equipment<br />
£m £m £m £m £m £m<br />
Cost or valuation<br />
At 1 January 2011 274.6 27.7 121.0 457.3 880.6 0.6<br />
Additions 28.2 1.3 9.4 69.2 108.1 0.1<br />
Reclassifications 1.5 (0.9) 9.5 (10.1) - -<br />
Disposals (3.1) - (5.4) (29.6) (38.1) -<br />
At 1 January 2012 301.2 28.1 134.5 486.8 950.6 0.7<br />
Additions 10.0 - 9.0 65.5 84.5 -<br />
Additions from acquired businesses - - 4.5 3.2 7.7 -<br />
Reclassifications 0.9 (0.9) - - - -<br />
Disposals (3.5) - (3.0) (44.1) (50.6) -<br />
At 31 December 2012 308.6 27.2 145.0 511.4 992.2 0.7<br />
Accumulated depreciation<br />
At 1 January 2011 35.1 4.6 41.7 272.1 353.5 0.5<br />
Charged this year 4.5 0.6 10.1 48.7 63.9 -<br />
Disposals (0.7) 0.2 (3.1) (25.8) (29.4) -<br />
At 1 January 2012 38.9 5.4 48.7 295.0 388.0 0.5<br />
Charged this year 4.6 0.6 11.4 52.8 69.4 -<br />
Disposals (0.4) - (1.3) (41.9) (43.6) -<br />
At 31 December 2012 43.1 6.0 58.8 305.9 413.8 0.5<br />
Net book value<br />
At 31 December 2012 265.5 21.2 86.2 205.5 578.4 0.2<br />
At 31 December 2011 262.3 22.7 85.8 191.8 562.6 0.2<br />
The cost element of the fixed assets carrying value is analysed as follows:<br />
THE GROUP<br />
THE COMPANY<br />
–––––––––––––––––––––––––––––––––––––––––––––––––––––––––––––––––––––––––––––––––––––––––––––––––––––––––––––––––––– ––-–––––––––––––––––––––<br />
Long Short Plant <strong>and</strong><br />
Freehold leases leases equipment Total Total<br />
£m £m £m £m £m £m<br />
At valuation 63.8 6.1 1.9 - 71.8 -<br />
At cost 244.8 21.1 143.1 511.4 920.4 0.7<br />
308.6 27.2 145.0 511.4 992.2 0.7<br />
Those freehold <strong>and</strong> leasehold properties included at valuation in the consolidated balance sheet were revalued at their open market value on an existing<br />
use basis. The valuations were performed as at 31 December 1999 by an independent professional valuer, Lambert Smith Hampton, Consultant Surveyors<br />
<strong>and</strong> Valuers.<br />
Included within freehold property is l<strong>and</strong> with a value of £117.7m (2011: £115.0m) which is not depreciated. No assets are pledged as security for the<br />
Group’s liabilities.<br />
The carrying amount of assets held under finance leases is analysed as follows:<br />
THE GROUP<br />
THE COMPANY<br />
–––––––––––––––––––––––––––––––––––––––––––––––––––––––––––––––––––––––––––––––––––––– ––-–––––––––––––––––––––<br />
Long Short Plant <strong>and</strong><br />
leases leases equipment Total Total<br />
£m £m £m £m £m<br />
2012 0.8 9.4 7.0 17.2 -<br />
FINANCIAL<br />
STATEMENTS<br />
2011 0.8 10.7 - 11.5 -<br />
107
NOTES TO THE FINANCIAL STATEMENTS<br />
15. Property, plant <strong>and</strong> equipment continued<br />
Comparable amounts determined according to the historical cost convention:<br />
THE GROUP<br />
THE COMPANY<br />
–––––––––––––––––––––––––––––––––––––––––––––––––––––––––––––––––––––––––––––––––––––––––––––––––––––––––––––––––––– ––-–––––––––––––––––––––<br />
Long Short Plant <strong>and</strong><br />
Freehold leases leases equipment Total Total<br />
£m £m £m £m £m £m<br />
Cost 304.1 25.8 153.5 511.3 994.7 0.7<br />
Accumulated depreciation (59.2) (7.2) (64.7) (305.8) (436.9) (0.5)<br />
Net book value<br />
At 31 December 2012 244.9 18.6 88.8 205.5 557.8 0.2<br />
At 31 December 2011 241.8 20.2 88.6 191.8 542.4 0.2<br />
16. Investment property<br />
THE GROUP<br />
––––––––––––––––––––––––––––––––––––––<br />
2012 2011<br />
£m £m<br />
Cost<br />
At 1 January 0.5 0.5<br />
Accumulated depreciation<br />
At 1 January (0.1) (0.1)<br />
Net book value<br />
At 31 December 0.4 0.4<br />
Investment property rental income totalled nil (2011:nil). In addition, the Group also receives income from subletting all or part of 100 ex-trading <strong>and</strong><br />
trading properties, the amount of which is not material.<br />
No external valuation has been performed <strong>and</strong> therefore, the Directors have estimated that the fair value of investment property equates to its carrying value.<br />
The Company has no investment property.<br />
17. Investments<br />
a. Interest in associates <strong>and</strong> joint ventures<br />
THE GROUP<br />
THE COMPANY<br />
–––––––––––––––––––––––––––––––––––––– ––––––––––––––––––––––––––––––––––––––<br />
2012 2011 2012 2011<br />
£m £m £m £m<br />
Equity investment 1.5 18.0 0.7 17.9<br />
Loan facility 5.3 30.3 5.3 30.3<br />
Interest on loan facility 0.2 10.3 0.2 10.3<br />
Share of losses (0.3) (7.3) - -<br />
6.7 51.3 6.2 58.5<br />
Travis Perkins plc holds a 49% investment in The Mosaic Tile Company Limited <strong>and</strong> a 25% investment in Rinus Roofing Limited. In 2012 Travis Perkins plc<br />
acquired a 50% interest in Travis Perkins Bridge Properties LLP for a consideration of £0.7m.<br />
b. Shares in group undertakings<br />
THE COMPANY<br />
––––––––––––––––––––––––––––––––––––––<br />
2012 2011<br />
£m £m<br />
At 1 January 2,889.8 2,714.8<br />
Reclassification of loans <strong>and</strong> receivables - 173.8<br />
Additions 702.3 1.2<br />
Adjustment to consideration on acquisition of Tile Giant (2.2) -<br />
At 31 December 3,589.9 2,889.8<br />
Provision for impairment (17.0) (17.0)<br />
Net book value at 31 December 3,572.9 2,872.8<br />
On 3 January 2012, Travis Perkins plc acquired the remaining 70% of the issued share capital of Toolstation Ltd. for a consideration of £24.2m (note 29).<br />
108
TRAVIS PERKINS ANNUAL REPORT AND ACCOUNTS 2012<br />
17. Investments continued<br />
The principal operating subsidiaries of the Group at 31 December 2012 are as follows:<br />
Subsidiary<br />
Travis Perkins Trading Company Limited * (Builders merchants)<br />
Keyline Builders Merchants Limited * (Builders merchants)<br />
Wickes Building Supplies Limited<br />
(DIY retailers)<br />
City Plumbing Supplies Holdings Limited (Plumbers merchants)<br />
CCF Limited *<br />
(Ceiling <strong>and</strong> dry lining distribution)<br />
Travis Perkins (Properties) Limited * (Property management company)<br />
Benchmarx Kitchens <strong>and</strong> Joinery Limited (Specialist distribution)<br />
Tile Giant Limited<br />
(Ceramic tile merchants)<br />
Travis Perkins P & H Partner Limited (Sole corporate partner in plumbing <strong>and</strong> heating merchants)<br />
Toolstation Limited *<br />
(DIY retailers)<br />
PTS Group Limited<br />
(Plumbing <strong>and</strong> heating merchants)<br />
*<br />
Direct subsidiary of Travis Perkins plc<br />
The registered office for all the subsidiaries listed above is Lodge Way House, Harlestone Road, Northampton, NN5 7UG except for Keyline Builders<br />
Merchants Limited, for which the registered office is Suite S3, 8 Strathkelvin Place, Kirkintilloch, Glasgow, G66 1XT <strong>and</strong> Toolstation Limited for which the<br />
registered office address is 16 -18 Whiteladies Road, Clifton, Bristol, B58 2LG.<br />
The Directors have applied s409 to s410 of the Companies Act 2006 <strong>and</strong> therefore list only significant subsidiary companies.<br />
All subsidiaries are 100% owned. Each company is registered <strong>and</strong> incorporated in Engl<strong>and</strong> <strong>and</strong> Wales, other than Keyline Builders Merchants Limited<br />
<strong>and</strong> eight dormant companies, which are registered <strong>and</strong> incorporated in Scotl<strong>and</strong>, City Investments Limited, which is registered <strong>and</strong> incorporated in Jersey<br />
<strong>and</strong> two dormant companies registered <strong>and</strong> incorporated in Northern Irel<strong>and</strong>.<br />
c. Available-for-sale investments<br />
THE GROUP<br />
THE COMPANY<br />
–––––––––––––––––––––––––––––––––––––– ––––––––––––––––––––––––––––––––––––––<br />
2012 2011 2012 2011<br />
£m £m £m £m<br />
Fair value investment 2.4 1.5 - -<br />
The investment represents a minority holding in a unit trust that acquired properties from the Group in 2006. The investment presents the Group with an<br />
opportunity to generate returns through both income <strong>and</strong> capital gains. The Directors consider that the carrying amount of this investment approximates<br />
its fair value.<br />
d. Subsidiaries not requiring an audit<br />
An audit exemption is likely to be taken for the following subsidiaries of the Group<br />
Subsidiary Name<br />
Registered Number<br />
Travis Perkins Acquisitions Company Limited 06500018<br />
Travis Perkins Finance Company Limited 06500008<br />
Travis Perkins Financing Company No.2 Limited 06755439<br />
Travis Perkins Financing Company No.3 Limited 07180292<br />
If this occurs then Travis Perkins plc will be legally required to put in place a guarantee in respect of any external liabilities that existed at 31 December<br />
2012. At that date none of the above companies had ever transacted outside of the Group <strong>and</strong> so no guarantee will be necessary.<br />
FINANCIAL<br />
STATEMENTS<br />
109
NOTES TO THE FINANCIAL STATEMENTS<br />
18. Trade <strong>and</strong> other receivables<br />
THE GROUP<br />
THE COMPANY<br />
–––––––––––––––––––––––––––––––––––––– ––––––––––––––––––––––––––––––––––––––<br />
2012 2011 2012 2011<br />
£m £m £m £m<br />
Trade receivables 578.3 585.7 - -<br />
Allowance for doubtful debts (48.3) (54.5) - -<br />
530.0 531.2 - -<br />
Amounts owed by subsidiaries - - 174.6 208.1<br />
Other receivables, prepayments <strong>and</strong> accrued income 203.7 211.8 6.1 6.0<br />
Trade <strong>and</strong> other receivables 733.7 743.0 180.7 214.1<br />
The Group’s trade <strong>and</strong> other receivables at the balance sheet date comprise principally of amounts receivable from the sale of goods, together with amounts<br />
due in respect of rebates <strong>and</strong> sundry prepayments. The Directors consider the only class of asset containing significant credit risk is trade receivables. The<br />
average credit term taken for sales of goods is 59 days (2011: 55 days). The allowance for doubtful debts is estimated by the Group’s management based<br />
on prior experience <strong>and</strong> their assessment of the current economic environment. The Directors consider the carrying amount of trade <strong>and</strong> other receivables<br />
approximates their fair values. The business has provided fully for all receivables outst<strong>and</strong>ing for more than 90 days beyond agreed terms. Trade receivables<br />
not receivable for up to 90 days are specifically provided for based on estimated irrecoverable amounts. No interest is charged on the trade receivable from<br />
the date of the invoice until the date the invoice is classified as overdue according to the trading terms agreed between the Group <strong>and</strong> the customer.<br />
Thereafter, the Group retains the right to charge interest at between 2% to 4% above the clearing bank base rate per annum on the outst<strong>and</strong>ing balance.<br />
Movement in the allowance for doubtful debts<br />
THE GROUP<br />
––––––––––––––––––––––––––––––––––––––<br />
2012 2011<br />
£m £m<br />
At 1 January 54.5 44.4<br />
Amounts written off during the year (21.7) (10.2)<br />
Increase in allowance recognised in the income statement 15.5 20.3<br />
At 31 December 48.3 54.5<br />
In determining the recoverability of the trade receivables, the Group considers any change in the credit quality of the trade receivable that may have<br />
occurred between the date credit was initially granted <strong>and</strong> the reporting date. The concentration of credit risk is limited due to the customer base being<br />
large. Accordingly, the Directors believe that no further credit provision is required in excess of the allowance for doubtful debts.<br />
Included in the Group’s trade receivable balance are debtors unprovided against with a carrying amount of £57.4m (2011: £65.9m) which are past due at<br />
the reporting date for which the Group has not identified a significant change in credit quality <strong>and</strong> as such, the Group considers that the amounts are still<br />
recoverable <strong>and</strong> therefore there is no allowance for doubtful debts. Except for some instances of personal guarantees the Group does not hold any collateral<br />
over these balances.<br />
Ageing of past due but not impaired receivables<br />
THE GROUP<br />
––––––––––––––––––––––––––––––––––––––<br />
Days overdue 2012 2011<br />
£m £m<br />
0 – 30 days 44.5 53.0<br />
31 – 60 days 8.6 9.2<br />
61 – 90 days 4.3 3.7<br />
57.4 65.9<br />
Included in the allowance for doubtful debts are specific trade receivables with a balance of £27.2m (2011: £30.7m) which have been placed into liquidation.<br />
The impairment represents the difference between the carrying amount of the specific trade receivable <strong>and</strong> the amount it is anticipated will be recovered.<br />
None of the Company’s debts are overdue. The directors do not consider there to be any significant credit risk, as the majority of the debt is due from<br />
subsidiaries.<br />
19. Cash <strong>and</strong> cash equivalents<br />
Cash <strong>and</strong> cash equivalents comprise cash held by the Group <strong>and</strong> Company net of overdrafts. The carrying amount of these assets approximates their fair<br />
value.<br />
110
TRAVIS PERKINS ANNUAL REPORT AND ACCOUNTS 2012<br />
20. Share capital<br />
THE GROUP AND THE COMPANY<br />
–––––––––––––––––––––––––––––––––––––––––––––––––––<br />
Issued <strong>and</strong> fully paid<br />
–––––––––––––––––––––––––––––––––––––––––––––––––––<br />
No. £m<br />
Ordinary shares of 10p<br />
At 1 January 2011 241,701,917 24.2<br />
Allotted in respect of acquisition of BSS 67,351 -<br />
Allotted under share option schemes 2,047,265 0.2<br />
At 1 January 2012 243,816,533 24.4<br />
Allotted under share option schemes 1,036,524 0.1<br />
At 31 December 2012 244,853,057 24.5<br />
The Company has one class of ordinary share that carries no right to fixed income. The holders of ordinary shares are entitled to receive dividends as<br />
declared <strong>and</strong> are entitled to one vote per share at meetings of the Company. All shares rank equally with regard to the Company’s residual assets.<br />
21. Own shares<br />
THE GROUP AND THE COMPANY<br />
–––––––––––––––––––––––––––––––––––––––––––––––––––<br />
2012 2011<br />
No.<br />
No.<br />
At 1 January 6,305,367 6,961,930<br />
Re-issued during the year (991,576) (656,563)<br />
At 31 December 5,313,791 6,305,367<br />
Allocated to grants of executive options 289,142 289,142<br />
Not allocated to grants of executive options 5,024,649 6,016,225<br />
5,313,791 6,305,367<br />
The own shares are stated at cost <strong>and</strong> held by the Employee Share Ownership Trust to satisfy options under the Group’s share option schemes. All rights<br />
attaching to own shares are suspended until the shares are re-issued.<br />
22. Reserves<br />
Details of all movements in reserves for both the Group <strong>and</strong> Company are shown in the Statement of Changes in Equity. A description of the nature <strong>and</strong><br />
purpose of each reserve is given below.<br />
• The revaluation reserve represents the revaluation surplus that has arisen from property revaluations in 1999 <strong>and</strong> prior years;<br />
• The hedging reserve comprises the effective portion of the cumulative net change in the fair value of cash flow hedging instruments (net of tax) related<br />
to hedged transactions that have yet to occur;<br />
• The own shares reserve represents the cost of shares purchased in the market <strong>and</strong> held by the Employee Share Ownership Trust to satisfy options under<br />
the Group’s share option schemes;<br />
• The merger reserve represents the premium on equity instruments issued as consideration for the acquisition of BSS.<br />
The cumulative total of goodwill written off directly to reserves for acquisitions from December 1989 to December 1998 is £40.1m. The aggregate information<br />
for the accounting periods prior to this period is not available.<br />
FINANCIAL<br />
STATEMENTS<br />
111
NOTES TO THE FINANCIAL STATEMENTS<br />
23. Borrowings<br />
A summary of the Group objectives policies procedures <strong>and</strong> strategies with regard to financial instruments <strong>and</strong> capital management can be found in the<br />
Finance Director’s review of the year on pages 38 to 43. At 31 December 2012 all borrowings were made in Sterling except for the unsecured senior notes<br />
(note 23 (i)).<br />
a. Summary<br />
THE GROUP<br />
THE COMPANY<br />
–––––––––––––––––––––––––––––––––––––– ––––––––––––––––––––––––––––––––––––––<br />
2012 2011 2012 2011<br />
£m £m £m £m<br />
Unsecured senior notes 261.1 279.3 261.1 279.3<br />
Liability to pension scheme (note 28) 36.9 37.2 - -<br />
Bank loans (note 23c) * 264.4 323.2 315.0 385.0<br />
Bank overdraft * - - 0.7 1.6<br />
Finance leases (note 23d) 25.9 20.3 - -<br />
Loan notes (note 23e) 3.3 3.3 3.3 3.3<br />
Finance charges netted off bank debt * (0.3) (1.5) (0.3) (1.5)<br />
591.3 661.8 579.8 667.7<br />
Current liabilities 396.1 63.6 444.9 74.9<br />
Non-current liabilities 195.2 598.2 134.9 592.8<br />
591.3 661.8 579.8 667.7<br />
*<br />
These balances together total the amounts shown as bank loans in note 23(b).<br />
b. Analysis of borrowings<br />
THE GROUP<br />
–––––––––––––––––––––––––––––––––––––––––––––––––––––––––––––––––––––––––––––––––––––––––––––––––––––––––––––<br />
bank loans <strong>and</strong> overdrafts<br />
Other borrowings<br />
–––––––––––––––––––––––––––––––––––––– ––––––––––––––––––––––––––––––––––––––<br />
2012 2011 2012 2011<br />
£m £m £m £m<br />
Borrowings repayable<br />
On dem<strong>and</strong> or within one year 264.1 58.8 132.0 4.8<br />
More than one year, but not more than two years - 262.9 2.7 138.5<br />
More than two years, but not more than five years - - 144.9 147.2<br />
More than five years - - 47.6 49.6<br />
264.1 321.7 327.2 340.1<br />
THE COMPANY<br />
–––––––––––––––––––––––––––––––––––––––––––––––––––––––––––––––––––––––––––––––––––––––––––––––––––––––––––––<br />
bank loans <strong>and</strong> overdrafts<br />
Other borrowings<br />
–––––––––––––––––––––––––––––––––––––– ––––––––––––––––––––––––––––––––––––––<br />
2012 2011 2012 2011<br />
£m £m £m £m<br />
Borrowings repayable<br />
On dem<strong>and</strong> or within one year 315.4 71.6 129.5 3.3<br />
More than one year, but not more than two years - 313.5 - 136.9<br />
More than two years, but not more than five years - - 134.9 142.4<br />
315.4 385.1 264.4 282.6<br />
112
TRAVIS PERKINS ANNUAL REPORT AND ACCOUNTS 2012<br />
23. Borrowings continued<br />
c. Facilities<br />
At 31 December 2012, the following bank facilities were available:<br />
THE GROUP<br />
THE COMPANY<br />
–––––––––––––––––––––––––––––––––––––– ––––––––––––––––––––––––––––––––––––––<br />
2012 2011 2012 2011<br />
£m £m £m £m<br />
Drawn facilities<br />
5 year term loan 264.4 323.2 315.0 385.0<br />
Unsecured senior notes 261.1 279.3 261.1 279.3<br />
Bank overdrafts - - 0.7 1.6<br />
525.5 602.5 576.8 665.9<br />
Undrawn facilities<br />
5 year revolving credit facility 475.0 475.0 475.0 475.0<br />
Bank overdrafts 40.0 40.0 39.3 38.4<br />
515.0 515.0 514.3 513.4<br />
The 5 year revolving credit facility <strong>and</strong> 5 year term loan, both mature on 4 April 2013. $200m of the unsecured loan notes were repaid on 28 January 2013<br />
with the remaining $200m falling due on 26 January 2016. On 14 December 2011 the Group signed a new £550m forward start banking agreement with a<br />
syndicate of banks. The £550m revolving credit facility, which runs until December 2016, can be drawn from 4 April 2013, the expiry date of the Group’s<br />
existing £739m facility agreement.<br />
The disclosures in note 23(c) do not include finance leases, loan notes, or the effect of finance charges netted off bank debt.<br />
d. Obligations under finance leases<br />
THE GROUP<br />
–––––––––––––––––––––––––––––––––––––––––––––––––––––––––––––––––––––––––––––––––––––––––––––––––––––––––––––<br />
minimum<br />
lease payments<br />
Present value of<br />
minimum lease payments<br />
–––––––––––––––––––––––––––––––––––––– ––––––––––––––––––––––––––––––––––––––<br />
2012 2011 2012 2011<br />
£m £m £m £m<br />
Amounts payable under finance leases:<br />
Within one year 3.8 2.7 2.5 1.5<br />
In the second to fifth years inclusive 16.5 10.0 12.7 6.4<br />
After five years 19.0 21.3 10.7 12.4<br />
39.3 34.0 25.9 20.3<br />
Less: future finance charges (13.4) (13.7) - -<br />
Present value of lease obligations 25.9 20.3 25.9 20.3<br />
Less: Amount due for settlement within 1 year (shown under current liabilities) (2.5) (1.5)<br />
Amount due for settlement after 1 year 23.4 18.8<br />
The Group considers certain properties to be subject to finance leases. Excluding 999-year leases, the average loan term for these properties is 49 years <strong>and</strong><br />
the average borrowing rate has been determined at the inception of the lease to be 9.0%. Interest rates are fixed at the contract date. All lease obligations,<br />
which are denominated in Sterling, are on a fixed repayment basis <strong>and</strong> no arrangements have been entered into for contingent rental payments.<br />
e. Loan notes<br />
Included in borrowings due within one year are £3.3m (2011: £3.3m) of loan notes issued as consideration for the acquisition of Broombys Limited in 1999.<br />
They are redeemable at the option of the holder on 30 June <strong>and</strong> 31 December each year until the final redemption date of 30 June 2015.<br />
FINANCIAL<br />
STATEMENTS<br />
f. Interest<br />
The weighted average interest rates paid were as follows:<br />
2012 2011<br />
% %<br />
Unsecured senior notes 5.8 5.8<br />
Bank loans <strong>and</strong> overdraft 2.2 1.8<br />
Other borrowings 6.0 6.0<br />
113
NOTES TO THE FINANCIAL STATEMENTS<br />
23. Borrowings continued<br />
Bank term loans <strong>and</strong> revolving credit facilities of £739m (2011: £798m) were arranged at variable interest rates. The $400m unsecured Travis Perkins senior<br />
notes were issued at fixed rates of interest <strong>and</strong> swapped into variable rates. This exposes the Group to fair value interest rate risk. As detailed in note 24, to<br />
manage the risk the Group enters into interest rate derivatives arrangements, which for 2012, fixed interest rates on an average of £221m of borrowing. For<br />
the year to 31 December 2012, this had the effect of increasing the weighted average interest rates paid by 0.5 %.<br />
In respect of income earning financial assets <strong>and</strong> interest bearing financial liabilities, the following table indicates their effective interest rates at the<br />
balance sheet date <strong>and</strong> the periods in which they reprice.<br />
THE GROUP<br />
––––––––––––––––––––––––––––––––––––––––––––––––––––––––––––––––––––––––––––––––––––––––––––––––––––––––––––––––––––––––<br />
2012 2011<br />
––––––––––––––––––––––––––––––––––––––––––––––––– –––––––––––––––––––––––––––––––––––––––––––––––––<br />
Effective 6 months or less Effective 6 months or less<br />
interest rate £m interest rate £m<br />
Unsecured senior notes 5.8% 261.1 5.8% 279.3<br />
Unsecured variable rate bank facilities 2.3% 264.4 2.3% 323.2<br />
Loan notes 6.0% 3.3 6.0% 3.3<br />
528.8 605.8<br />
THE COMPANY<br />
––––––––––––––––––––––––––––––––––––––––––––––––––––––––––––––––––––––––––––––––––––––––––––––––––––––––––––––––––––––––<br />
2012 2011<br />
––––––––––––––––––––––––––––––––––––––––––––––––– –––––––––––––––––––––––––––––––––––––––––––––––––<br />
Effective 6 months or less Effective 6 months or less<br />
interest rate £m interest rate<br />
Unsecured senior notes 5.8% 261.1 5.8% 279.3<br />
Unsecured variable rate bank facilities 2.3% 315.0 2.3% 385.0<br />
Loan notes 6.0% 3.3 6.0% 3.3<br />
Bank overdraft 2.3% 0.7 2.3% 1.6<br />
580.1 669.2<br />
g. Fair values<br />
For both the Group <strong>and</strong> the Company the fair values of financial assets <strong>and</strong> liabilities have been calculated by discounting expected cash flows at prevailing<br />
rates at 31 December. There were no significant differences between book <strong>and</strong> fair values on this basis <strong>and</strong> therefore no further information is disclosed.<br />
Details of the fair values of derivatives are given in note 24.<br />
h. Guarantees <strong>and</strong> security<br />
There are cross guarantees on the overdrafts between group companies.<br />
The companies listed in note 17, with the exception of Benchmarx Kitchens <strong>and</strong> Joinery Limited, Travis Perkins P&H Partner Limited, Tile Giant Limited<br />
<strong>and</strong> Toolstation Limited, together with Wickes Limited <strong>and</strong> Travis Perkins Plumbing <strong>and</strong> Heating LLP are guarantors of the following facilities advanced<br />
to Travis Perkins plc:<br />
• £264m term loan;<br />
• £475m revolving credit facility;<br />
• $400m unsecured senior notes (note 23(i));<br />
• Interest rate <strong>and</strong> currency derivatives, (note 24).<br />
The group companies have entered into other guarantee <strong>and</strong> counter-indemnity arrangements in respect of guarantees issued in favour of group companies<br />
by the clearing banks amounting to approximately £16m (2011: £16m).<br />
i. Unsecured senior notes<br />
The US private placement carries fixed rate coupons of between 130 bps <strong>and</strong> 140 bps over US treasuries.<br />
24. Financial instruments<br />
a. Significant accounting policies<br />
Details of the significant accounting policies <strong>and</strong> methods adopted, including the criteria for recognition, the basis of measurement <strong>and</strong> the basis on which<br />
income <strong>and</strong> expenses are recognised, in respect of each class of financial asset, financial liability <strong>and</strong> equity instrument are disclosed in note 2 to the<br />
financial statements.<br />
114
TRAVIS PERKINS ANNUAL REPORT AND ACCOUNTS 2012<br />
24. Financial instruments continued<br />
b. The carrying value of categories of financial instruments<br />
THE GROUP<br />
THE COMPANY<br />
–––––––––––––––––––––––––––––––––––––– ––––––––––––––––––––––––––––––––––––––<br />
2012 2011 2012 2011<br />
£m £m £m £m<br />
Financial assets<br />
Designated as fair value through profit <strong>and</strong> loss (FVTPL) - 3.1 - 3.1<br />
Derivative instruments in designated hedge accounting relationships 25.5 40.3 25.5 40.3<br />
Loans <strong>and</strong> receivables (including cash <strong>and</strong> cash equivalents) 804.7 753.5 180.7 214.1<br />
Available-for-sale 2.4 1.5 - -<br />
832.6 798.4 206.2 257.5<br />
Financial liabilities<br />
Designated as fair value through profit <strong>and</strong> loss (FVTPL) 49.6 3.3 49.6 3.3<br />
Derivative instruments in designated hedge accounting relationships 4.9 2.6 4.9 2.6<br />
Borrowings (note 23a) 591.3 661.8 579.8 667.7<br />
Trade <strong>and</strong> other payables at amortised cost (note 27) 888.7 872.7 18.9 19.0<br />
1,534.5 1,540.4 653.2 692.6<br />
Loans <strong>and</strong> receivables exclude prepayments of £68.1m (2011: £68.1m). Trade <strong>and</strong> other payables exclude taxation <strong>and</strong> social security, accruals <strong>and</strong> deferred<br />
income totalling £218.9m (2011: £215.6m). The carrying amount of financial assets recorded in the financial statements, which is net of impairment losses,<br />
represents the Group’s maximum exposure to credit risk.<br />
c. Fair value of financial instruments<br />
The fair values of financial assets <strong>and</strong> financial liabilities are determined as follows:<br />
• Foreign currency forward contracts are measured using quoted forward exchange rates;<br />
• Interest rate swaps are measured at the present value of future cash flows estimated <strong>and</strong> discounted based on the applicable yield curves derived from<br />
quoted interest rates.<br />
The following table provides an analysis of financial instruments that are measured subsequent to initial recognition at fair value, grouped into Levels 1 to<br />
3 based on the degree to which the fair value is observable:<br />
• Level 1 fair value measurements are those derived from quoted prices (unadjusted) in active markets for identical assets or liabilities;<br />
• Level 2 fair value measurements are those derived from inputs other than quoted prices included within Level 1 that are observable for the asset or<br />
liability either directly (i.e. as prices) or indirectly (i.e. derived from prices); <strong>and</strong><br />
• Level 3 fair value measurements are those derived from valuation techniques that include inputs for the asset or liability that are not based on observable<br />
market data (unobservable inputs).<br />
There were no transfers between levels during the year.<br />
Included in assets<br />
THE GROUP<br />
THE COMPANY<br />
–––––––––––––––––––––––––––––––––––––– ––––––––––––––––––––––––––––––––––––––<br />
2012 2011 2012 2011<br />
£m £m £m £m<br />
Level 2<br />
Foreign currency forward contracts at fair value through profit <strong>and</strong> loss - 3.1 - 3.1<br />
Foreign currency forward contracts designated <strong>and</strong> effective as hedging<br />
instruments carried at fair value - 0.1 - 0.1<br />
Cross currency interest rate swaps designated <strong>and</strong> effective as hedging<br />
instruments carried at fair value 25.5 40.2 25.5 40.2<br />
25.5 43.4 25.5 43.4<br />
FINANCIAL<br />
STATEMENTS<br />
Current assets 12.7 3.1 12.7 3.1<br />
Non-current assets 12.8 40.3 12.8 40.3<br />
25.5 43.4 25.5 43.4<br />
115
NOTES TO THE FINANCIAL STATEMENTS<br />
24. Financial instruments continued<br />
Included in liabilities<br />
THE GROUP<br />
THE COMPANY<br />
–––––––––––––––––––––––––––––––––––––– ––––––––––––––––––––––––––––––––––––––<br />
2012 2011 2012 2011<br />
£m £m £m £m<br />
Level 2<br />
Foreign currency forward contracts at fair value through profit <strong>and</strong> loss 0.7 - 0.7 -<br />
Foreign currency forward contracts designated <strong>and</strong> effective as<br />
hedging instruments carried at fair value 3.7 - 3.7 -<br />
Interest rate swaps at fair value through profit <strong>and</strong> loss 1.9 3.3 1.9 3.3<br />
Interest rate swaps designated <strong>and</strong> effective as cash hedging instruments 1.2 2.6 1.2 2.6<br />
Level 3 7.5 5.9 7.5 5.9<br />
Deferred consideration at fair value through profit <strong>and</strong> loss 47.0 - 47.0 -<br />
54.5 5.9 54.5 5.9<br />
Current liabilities 2.6 - 2.6 -<br />
Non-current liabilities 51.9 5.9 51.9 5.9<br />
54.5 5.9 54.5 5.9<br />
d. Interest risk management<br />
The Group is exposed to interest rate risk as entities in the Group borrow funds at both fixed <strong>and</strong> floating interest rates. The risk is managed by the Group by<br />
maintaining an appropriate mix between fixed <strong>and</strong> floating rate borrowings, by the use of interest rate swap contracts <strong>and</strong> forward interest rate contracts.<br />
Hedging activities are evaluated regularly to align with interest rate views <strong>and</strong> defined risk appetite, ensuring optimal hedging strategies are applied, by<br />
either positioning the balance sheet or protecting interest expense through different interest rate cycles.<br />
Interest rate swap contracts<br />
The Group adopts a policy of ensuring that its exposure to changes in interest rates on borrowings is on either a fixed rate basis or is subject to movements<br />
within pre-defined limits. To achieve its desired interest rate profile the Group uses interest rate swap contracts.<br />
Contracts with notional values of £125m are designated as cash flow hedges with fixed interest payments at an average rate of 1.71% for periods up until<br />
May 2014 <strong>and</strong> have floating interest receipts equal to 1 month LIBOR. During the period the cash flow hedges were 100% effective in hedging the exposure<br />
to interest rate movements. The Group <strong>and</strong> the Company also are party to one non-amortising interest rate swap with a call option which has a notional<br />
value of £50m with fixed interest payments at a rate of 4.595% for periods up until October 2013 <strong>and</strong> has floating interest payments equal to 6 month LIBOR.<br />
Under interest rate swap contracts, the Group agrees to exchange the difference between fixed <strong>and</strong> floating interest rate amounts calculated on agreed<br />
notional principal amounts. Such contracts enable the Group to mitigate the risk of changing interest rates on the fair value of issued fixed rate debt held<br />
<strong>and</strong> the cash flow exposures on the issued variable rate debt held. The fair value of interest rate swaps at the reporting date is determined by discounting<br />
the future cash flows using the curves at the reporting date <strong>and</strong> the credit risk inherent in the contract, <strong>and</strong> is disclosed below. The average interest rate is<br />
based on the outst<strong>and</strong>ing balances at the end of the financial year.<br />
At 31 December 2012 the fair value of interest rate derivatives, all of which terminate before three years from the balance sheet date, to which the Group<br />
<strong>and</strong> the Company were parties was estimated at £3.1m (2011: £5.9m). This amount is based on market values of equivalent instruments at the balance<br />
sheet date. Interest rate swaps excluding those with a call option are designated <strong>and</strong> effective as cash flow hedges <strong>and</strong> the fair value thereof has been<br />
deferred in equity. A credit of £1.3m (2011: £0.9m) in respect of the fair value movement on interest rate swaps with a call option has been taken to the<br />
income statement through net finance charges, as the Group has not applied hedge accounting.<br />
The following table details the notional principal amounts <strong>and</strong> remaining terms of interest rate swap contracts accounted for as cash flow hedges at the<br />
reporting date:<br />
Cash flow hedges – outst<strong>and</strong>ing receive floating pay fixed contracts<br />
Average contract<br />
Notional principal<br />
fixed interest rate amount Fair value<br />
–––––––––––––––––––––––––––––––––––––– –––––––––––––––––––––––––––––––––––––– ––––––––––––––––––––––––––––––––––––––<br />
2012 2011 2012 2011 2012 2011<br />
% % £m £m £m £m<br />
1 to 2 years 1.71% - 125.0 - (1.2) -<br />
2 to 5 years - 1.71% - 200.0 - (2.6)<br />
125.0 200.0 (1.2) (2.6)<br />
The interest rate swaps settle on a monthly basis. The floating rate on the interest rate swaps is 1 month LIBOR. The Group will settle the difference between<br />
the fixed <strong>and</strong> floating interest rate on a net basis. All interest rate swap contracts, excluding those with a call option, which exchange floating rate interest<br />
amounts for fixed rate interest amounts are designated as cash flow hedges in order to reduce the Group’s cash flow exposure resulting from variable<br />
interest rates on borrowings. The interest rate swaps <strong>and</strong> the interest rate payments on the loan occur simultaneously <strong>and</strong> the amount deferred in equity<br />
is recognised in the income statement over the period that the floating rate interest payments on debt affect profit or loss.<br />
116
TRAVIS PERKINS ANNUAL REPORT AND ACCOUNTS 2012<br />
24. Financial instruments continued<br />
e. Cross currency swaps <strong>and</strong> currency forward contracts<br />
In order to eliminate the currency risk associated with the $400m unsecured senior notes described in note 23(i) the Group <strong>and</strong> Company has four cross<br />
currency swaps in varying amounts between £23m <strong>and</strong> £58m to fix the exchange rate at £1 equal to $1.73 for the entire lives of $290m of the unsecured<br />
loan notes. The forward options fixed the notional amount receivable <strong>and</strong> payable in respect of the unsecured senior notes to £168m as well as fixing the<br />
exchange rate applicable to future coupon payments.<br />
The currency swaps manage the Group’s <strong>and</strong> the Company’s exposure to the fixed interest rate on the US dollar denominated borrowing arising out of<br />
a private placement issued on 26 January 2006. There are two currency swaps of £58m that convert the borrowing rate on $200m of debt from 5.77% to a<br />
variable rate based on 6 month LIBOR plus a weighted average basis point increment of 81.9. At 26 January 2006, the variable rates were both at 5.43%. A<br />
further two currency swaps of £29m <strong>and</strong> £23m convert the borrowing rates on US$50m, US$40m of debt from 5.89% to a variable rate based on six month<br />
LIBOR plus basis point increment of 86.5 <strong>and</strong> 86.7 respectively. At 26 January 2006, the variable rates were at weighted average 5.47%. The currency swaps<br />
settle on a half-yearly basis. The Group will settle the difference between the fixed <strong>and</strong> floating interest on a net basis.<br />
Currency swap contracts exchanging fixed rate interest for floating rate interest are designated <strong>and</strong> effective as fair value hedges in respect of interest<br />
rates. During the period, the hedge was 100% effective in hedging the fair value exposure to interest movements <strong>and</strong> as a result, the carrying amount of the<br />
loan was adjusted by £14.4m (2011: £36.9m), which was included in the income statement at the same time that the fair value of the interest rate swap was<br />
also included in the income statement.<br />
The following table details the notional principal amounts <strong>and</strong> remaining terms of currency swap contracts accounted for as fair value hedges as at the<br />
reporting date:<br />
Fair value hedges – outst<strong>and</strong>ing receive fixed pay floating contracts<br />
Average contract floating interest rate Notional principal amount Fair value<br />
–––––––––––––––––––––––––––––––––––––––––––––––––––––– –––––––––––––––––––––––––––––––––––––– ––––––––––––––––––––––––––––––––––––––<br />
2012 2011 2012 2011 2012 2011<br />
% % £m £m £m £m<br />
Less than 1 year 1.9% - 115.6 - 12.7 -<br />
1 to 2 years - 1.9% - 115.6 - 23.5<br />
2 to 5 years 1.9% 1.9% 52.0 52.0 12.8 16.7<br />
167.6 167.6 25.5 40.2<br />
The Group <strong>and</strong> the Company have three currency forward contracts with a notional value of $30m each <strong>and</strong> one with a notional value of £20m to hedge<br />
$110m of unsecured senior notes. These contracts have a maturity date of January 2016. At 31 December 2011 the fair value of these forward contracts was<br />
estimated at £(3.7)m (2011: £0.1m). These contracts are designated as cash flow hedges.<br />
The Group acquires goods for sale from overseas, which when not denominated in Sterling are paid for principally in US dollars. The Group has entered<br />
into forward foreign exchange contracts (all of which are less than one year in duration) to buy US dollars to hedge the exchange risk arising from these<br />
anticipated future purchases. At the balance sheet date the total notional value of contracts to which the Group was committed was US$112.8m (2011:<br />
US$120.3m). The fair value of these derivatives is £(0.7)m (2011: £3.1m). These contracts are not designated as hedges <strong>and</strong> accordingly the fair value<br />
movement has been reflected in the income statement.<br />
During 2010 the Group <strong>and</strong> Company novated one cross currency interest rate swap with a notional value of $110m <strong>and</strong> a sterling equivalent of £63m<br />
for total proceeds of £13.7m in the Group <strong>and</strong> £16.3m in the Company. The proceeds are being amortised to the income statement over the remaining life<br />
of the unsecured senior notes.<br />
f. Liquidity analysis<br />
The following table details the Group’s liquidity analysis for its derivative financial instruments <strong>and</strong> other financial liabilities. The table has been drawn<br />
up based on the undiscounted net cash flows on the derivative instrument that settle on a net basis <strong>and</strong> the undiscounted gross flows on those derivatives<br />
that require gross settlement. When the amount payable or receivable is not fixed, the amount disclosed has been determined by reference to the projected<br />
interest <strong>and</strong> foreign currency rates as illustrated by the yield curves existing at the reporting date.<br />
2012<br />
––––––––––––––––––––––––––––––––––––––––––––––––––––––––––––––––––––––––––––––––––––––––––––––––––––––––––––––––––––––––––––––––<br />
0-1year 1-2 years 2-5 years 5+ years Total<br />
£m £m £m £m £m<br />
Gross settled<br />
Interest rate swaps – receipts 130.6 6.6 57.3 - 194.5<br />
Interest rate swaps – payments (117.6) (1.8) (52.6) - (172.0)<br />
13.0 4.8 4.7 - 22.5<br />
Foreign exchange forward contracts (70.5) - - - (70.5)<br />
Total gross settled (57.5) 4.8 4.7 - (48.0)<br />
Net settled<br />
Interest rate swaps (2.8) (0.2) - - (3.0)<br />
Total derivative financial instruments (60.3) 4.6 4.7 - (51.0)<br />
Borrowings (404.4) (7.3) (142.2) (36.9) (590.8)<br />
Deferred consideration - (51.1) - - (51.1)<br />
Other financial liabilities (note 27) (888.7) - - - (888.7)<br />
Finance leases (note 23d) (3.8) (3.8) (12.7) (19.0) (39.3)<br />
Total financial instruments (1,357.2) (57.6) (150.2) (55.9) (1,620.9)<br />
FINANCIAL<br />
STATEMENTS<br />
117
NOTES TO THE FINANCIAL STATEMENTS<br />
24. Financial instruments continued<br />
2011<br />
––––––––––––––––––––––––––––––––––––––––––––––––––––––––––––––––––––––––––––––––––––––––––––––––––––––––––––––––––––––––––––––––<br />
0-1year 1-2 years 2-5 years 5+ years Total<br />
£m £m £m £m £m<br />
Gross settled<br />
Interest rate swaps – receipts 10.9 139.3 63.0 - 213.2<br />
Interest rate swaps – payments (3.3) (118.9) (53.8) - (176.0)<br />
7.6 20.4 9.2 - 37.2<br />
Foreign exchange forward contracts (77.3) - (0.1) - (77.4)<br />
Total gross settled (69.7) 20.4 9.1 - (40.2)<br />
Net settled<br />
Interest rate swaps (1.4) (0.6) - - (2.0)<br />
Total derivative financial instruments (71.1) 19.8 9.1 - (42.2)<br />
Borrowings (77.0) (407.3) (157.4) (37.2) (678.9)<br />
Other financial liabilities (note 27) (872.7) - - - (872.7)<br />
Finance leases (note 23d) (2.7) (2.7) (7.3) (21.3) (34.0)<br />
Total financial instruments (1,023.5) (390.2) (155.6) (58.5) (1,627.8)<br />
g. Interest rate sensitivity analysis<br />
The sensitivity analyses below have been determined based on the exposure to interest rates for both derivatives <strong>and</strong> non-derivative financial instruments<br />
at the balance sheet date. For floating rate liabilities, the analysis is prepared assuming that the amount of liability outst<strong>and</strong>ing at the balance sheet<br />
date was outst<strong>and</strong>ing for the whole year. A 1.0% increase or decrease is used when reporting interest rate risk internally to key management personnel. If<br />
interest rates had been 1.0% higher / lower <strong>and</strong> all other variables were held constant, the Group’s:<br />
• Profit before taxation for the year ended 31 December 2012 would have decreased / increased by £1.7m (2011: increased / decreased by £2.1m) including<br />
£0.3m (2011: £0.7m) of movement on interest rate swaps with options;<br />
• Net equity would have decreased / increased by £0.6m (2011: increased / decreased by £0.6m) mainly because of the changes in the fair value of interest<br />
rate derivatives.<br />
The Group’s sensitivity to interest rates has decreased during the current period mainly due to the increase in the nominal value of interest rate derivatives.<br />
25. Provisions<br />
THE GROUP<br />
––––––––––––––––––––––––––––––––––––––––––––––––––––––––––––––––––––––––––––––––––––––––––––––––––––––––<br />
Property Insurance Other Total<br />
£m £m £m £m<br />
At 1 January 2011 56.3 31.5 3.0 90.8<br />
Additional provision charged to income statement 1.8 8.8 - 10.6<br />
Utilisation of provision (10.4) (4.8) (0.1) (15.3)<br />
Unwinding of discount 3.0 - - 3.0<br />
At 31 December 2011 50.7 35.5 2.9 89.1<br />
Additional provision charged to income statement 3.1 0.4 - 3.5<br />
Exceptional provision released in the year (6.0) - - (6.0)<br />
Utilisation of provision (7.7) (4.4) (0.2) (12.3)<br />
Unwinding of discount 2.5 - - 2.5<br />
At 31 December 2012 42.6 31.5 2.7 76.8<br />
Included in current liabilities 22.6 31.5 2.7 56.8<br />
Included in non-current liabilities 20.0 - - 20.0<br />
42.6 31.5 2.7 76.8<br />
The Group has a number of vacant <strong>and</strong> partly sub-let leasehold properties. Where necessary provision has been made for the residual lease commitments<br />
after taking into account existing <strong>and</strong> anticipated sub-tenant arrangements.<br />
Should a provision ultimately prove to be unnecessary then it is credited back into the income statement. Where the provision was originally established<br />
as an exceptional item, any release is shown as an exceptional credit.<br />
It is Group policy to substantially self insure itself against claims arising in respect of damage to assets, or due to employers or public liability claims. The<br />
nature of insurance claims means they may take some time to be settled. The insurance claims provision represents management’s best estimate, based<br />
upon external advice of the value of outst<strong>and</strong>ing insurance claims where the final settlement date is uncertain.<br />
118
TRAVIS PERKINS ANNUAL REPORT AND ACCOUNTS 2012<br />
25. Provisions continued<br />
The following table details the Group’s liquidity analysis of its provisions. The table has been drawn up based on the undiscounted net cash outflows.<br />
0-1year 1-2 years 2-5 years 5+ years Total<br />
£m £m £m £m £m<br />
2012<br />
Property 22.3 4.7 9.4 14.5 50.9<br />
Insurance 31.5 - - - 31.5<br />
Other 2.7 - - - 2.7<br />
56.5 4.7 9.4 14.5 85.1<br />
2011<br />
Property 16.1 7.5 15.4 21.4 60.4<br />
Insurance 35.5 - - - 35.5<br />
Other 2.9 - - - 2.9<br />
The Company has no provisions.<br />
54.5 7.5 15.4 21.4 98.8<br />
26. Deferred tax<br />
The following are the major fully recognised deferred tax liabilities <strong>and</strong> assets recognised by the Group <strong>and</strong> movements thereon during the current <strong>and</strong><br />
prior reporting periods.<br />
THE GROUP<br />
––––––––––––––––––––––––––––––––––––––––––––––––––––––––––––––––––––––––––––––––––––––––––––––––––––––––––––––––––––––––––––––––<br />
At Acquired Recognised Recognised At<br />
1 Jan 2012 in year in income in equity 31 Dec 2012<br />
£m £m £m £m £m<br />
Capital allowances 6.2 (0.3) (0.2) - 5.7<br />
Trading losses - (6.6) 2.1 - (4.5)<br />
Revaluation 11.1 - - (0.9) 10.2<br />
Share based payments (8.1) - (2.3) (2.9) (13.3)<br />
Provisions (11.4) - 1.2 - (10.2)<br />
Derivatives (1.2) - - 0.9 (0.3)<br />
Business combinations 14.4 - (2.2) - 12.2<br />
Br<strong>and</strong> 97.8 13.3 (12.9) - 98.2<br />
Pension scheme surplus 4.9 - 2.1 (6.6) 0.4<br />
Pension scheme liability (16.3) - 1.2 1.7 (13.4)<br />
Deferred tax 97.4 6.4 (11.0) (7.8) 85.0<br />
THE GROUP<br />
––––––––––––––––––––––––––––––––––––––––––––––––––––––––––––––––––––––––––––––––––––––––––––––––––––––––<br />
At Recognised Recognised At<br />
1 Jan 2011 in income in equity 31 Dec 2011<br />
£m £m £m £m<br />
Capital allowances 6.6 (0.4) - 6.2<br />
Revaluation 12.0 - (0.9) 11.1<br />
Share based payments (11.6) (0.7) 4.2 (8.1)<br />
Provisions (11.9) 0.5 - (11.4)<br />
Derivatives (1.9) - 0.7 (1.2)<br />
Business combinations 16.7 (2.3) - 14.4<br />
Br<strong>and</strong> 108.4 (10.6) - 97.8<br />
Pension scheme surplus 8.6 2.9 (6.6) 4.9<br />
Pension scheme liability (16.4) 1.1 (1.0) (16.3)<br />
Deferred tax 110.5 (9.5) (3.6) 97.4<br />
FINANCIAL<br />
STATEMENTS<br />
At the balance sheet date the Group had unused capital losses of £47.4m (2011: £56.0m) available for offset against future capital profits. No deferred tax<br />
asset has been recognised because it is not probable that future taxable profits will be available against which the Group can utilise the losses.<br />
Other than disclosed above, no deferred tax assets <strong>and</strong> liabilities have been offset.<br />
119
NOTES TO THE FINANCIAL STATEMENTS<br />
26. Deferred tax continued<br />
THE COMPANY<br />
––––––––––––––––––––––––––––––––––––––––––––––––––––––––––––––––––––––––––––––––––––––––––––––––––––––––<br />
At Recognised Recognised At<br />
1 Jan 2012 in income in equity 31 Dec 2012<br />
£m £m £m £m<br />
Share based payments (8.1) (2.3) (3.0) (13.4)<br />
Derivatives (1.2) - 0.9 (0.3)<br />
Other timing differences (0.6) 0.1 - (0.5)<br />
(9.9) (2.2) (2.1) (14.2)<br />
THE COMPANY<br />
––––––––––––––––––––––––––––––––––––––––––––––––––––––––––––––––––––––––––––––––––––––––––––––––––––––––<br />
At Recognised Recognised At<br />
1 Jan 2011 in income in equity 31 Dec 2011<br />
£m £m £m £m<br />
Share based payments (11.5) (0.7) 4.1 (8.1)<br />
Derivatives (2.5) - 1.3 (1.2)<br />
Other timing differences (0.7) 0.1 - (0.6)<br />
(14.7) (0.6) 5.4 (9.9)<br />
27. Other financial liabilities<br />
THE GROUP<br />
THE COMPANY<br />
–––––––––––––––––––––––––––––––––––––– ––––––––––––––––––––––––––––––––––––––<br />
2012 2011 2012 2011<br />
£m £m £m £m<br />
Trade payables 737.9 740.7 - -<br />
Other taxation <strong>and</strong> social security 76.0 76.2 - -<br />
Other payables 150.8 132.0 18.9 19.0<br />
Accruals <strong>and</strong> deferred income 142.9 139.4 - -<br />
Trade <strong>and</strong> other payables 1,107.6 1,088.3 18.9 19.0<br />
The Group<br />
Trade <strong>and</strong> other payables principally comprise amounts outst<strong>and</strong>ing for trade purchases <strong>and</strong> ongoing costs. The average credit period taken for trade<br />
purchases is 53 days (2011: 57 days). The Directors consider that the carrying amount of trade payables approximates to their fair value. The Group has<br />
financial risk management policies in place to ensure that all payables are paid within the credit timeframe.<br />
The Company<br />
Trade <strong>and</strong> other payables principally comprise amounts outst<strong>and</strong>ing for trade purchases <strong>and</strong> ongoing costs. The average credit period taken for trade<br />
purchases is 30 days (2011: 30 days). The Directors consider that the carrying amount of trade payables approximates to their fair value.<br />
28. Pension arrangements<br />
Defined benefit schemes<br />
The Group operates three final salary schemes. All defined benefit schemes are closed to new members. The Travis Perkins Pensions <strong>and</strong> Dependants<br />
Benefit Scheme (‘the TP scheme’), which for the majority of members is a 1/60th scheme. Employees are entitled to start drawing a pension, based on their<br />
membership of the scheme, on their normal retirement date. If employees choose to retire early <strong>and</strong> draw their pension, then the amount they receive is<br />
scaled down accordingly.<br />
The TP scheme is funded by contributions from Group companies <strong>and</strong> employees. Contributions are paid to the Trustees on the basis of advice from an<br />
independent professionally qualified actuary who carries out a valuation of the scheme every three years.<br />
A full actuarial valuation of the TP scheme was carried out on 30 September 2011. The IAS 19 valuation has been based upon the results of the 30<br />
September 2011 valuation, <strong>and</strong> then updated to 31 December 2012 by a qualified actuary. The present values of the defined obligations, the related current<br />
service costs <strong>and</strong> the past service costs for the scheme were measured using the projected unit method.<br />
Following the acquisition of The BSS group plc the Group, operated three additional defined benefit pension schemes (‘the BSS schemes’) based on final<br />
pensionable salary. On 6 April 2012 the defined benefit section of the Tricom Retirement <strong>and</strong> Death Benefits scheme was transferred to the TP scheme. The<br />
BSS Irel<strong>and</strong> scheme is immaterial.<br />
The assets of the BSS schemes are held separately from those of the Group in funds under the control of the schemes’ trustees. . The most recent actuarial<br />
valuations of the BSS schemes assets <strong>and</strong> the present value of the defined benefit obligation were carried out at 1 June 2009 for the UK <strong>and</strong> the Irish<br />
schemes. The present value of the defined benefit obligation, <strong>and</strong> the related current service cost <strong>and</strong> past service cost, were measured using the projected<br />
unit method with a control period equal to the future working lifetime of the active members.<br />
In June 2010, an agreement was reached with the trustees of the Travis Perkins final salary pension scheme to fund £34.7m of the deficit using a group<br />
controlled special purpose vehicle. The pension scheme will be entitled to receive the income of the SPV for a period of up to 20 years, subject to funding<br />
levels. This income is backed by the security of 16 Travis Perkins freehold properties. As the SPV is consolidated into the Travis Perkins plc group accounts<br />
advantage has been taken of Regulation 7 of The Partnership (<strong>Accounts</strong>) Regulations 2008 <strong>and</strong> accounts for the SPV will neither be audited or filed.<br />
120
TRAVIS PERKINS ANNUAL REPORT AND ACCOUNTS 2012<br />
28. Pension arrangements continued<br />
All Schemes<br />
––––––––––––––––––––––––––––––––––––––<br />
2012 2011<br />
£m £m<br />
Gross deficit at 1 January (45.7) (27.9)<br />
Service costs charged to the income statement (10.0) (7.1)<br />
Other finance income 11.1 11.8<br />
Contributions received by the scheme 32.9 27.3<br />
Actuarial losses recognised in the statement of comprehensive income (45.8) (49.8)<br />
Gross deficit at 31 December (57.5) (45.7)<br />
Deferred tax 13.0 11.4<br />
Net deficit at 31 December (44.5) (34.3)<br />
a. Major assumptions used by the schemes actuaries at the balance sheet date (in nominal terms)<br />
At 31 December At 31 December<br />
2012 2011<br />
Rate of increase in pensionable salaries 2.25% 2.25%<br />
Rate of increase of pensions in payment 2.5% 2.5%<br />
Discount rate 4.6% 4.9%<br />
Inflation assumption 3.0% 3.1%<br />
In respect of longevity, the valuation adopts the SN1A year of birth tables with improvements in life expectancy to continue in the medium term, with base<br />
year appropriate to the member’s date of birth. This results in the following life expectancies at illustrative ages:<br />
Weighted average life expectancy for mortality tables used to determine pension liability at 31 December 2012:<br />
Male Years Female Years<br />
Member age 65 (current life expectancy) – TP Scheme 22.1 24.2<br />
Member age 45 (life expectancy on reaching age 65) – TP Scheme 23.9 26.2<br />
Member age 65 (current life expectancy) – BSS Schemes 22.4 25.1<br />
Member age 45 (life expectancy on reaching age 65) – BSS Schemes 24.3 26.9<br />
b. Amounts recognised in income in respect of the defined benefit schemes<br />
TP Scheme BSS Schemes 2012 Group 2011 Group<br />
£m £m £m £m<br />
Current <strong>and</strong> past service costs charged to operating profit in the income statement (7.2) (2.8) (10.0) (7.1)<br />
Interest cost (31.3) (10.8) (42.1) (44.7)<br />
Expected return on scheme assets 41.1 12.1 53.2 56.5<br />
Total pension income / (charge) 2.6 (1.5) 1.1 4.7<br />
The total charge to the profit <strong>and</strong> loss account disclosed in note 7 of £17.2m (2011: £12.8m) comprises defined benefit scheme current <strong>and</strong> past service<br />
costs of £10.0m (2011: £7.1m) <strong>and</strong> £7.2m (2011: £5.7m) of contributions made to the defined contribution schemes.<br />
The directors have agreed with the Schemes’ Actuaries <strong>and</strong> the Trustees to pay total contributions, including the amounts in excess of on-going<br />
contributions required to repay the deficit, of £23m to the TP scheme <strong>and</strong> £13m the BSS schemes in 2013.<br />
Note 5 shows where pension costs have been charged in the income statement. Actuarial gains <strong>and</strong> losses have been included in the Statement of<br />
Comprehensive Income.<br />
In 2013, the excess of funding over the on-going service contributions will be £28m in total for the Group.<br />
c. Assets <strong>and</strong> liabilities in the schemes <strong>and</strong> the expected rate of return (net of allowance for administration expenses)<br />
TP Scheme<br />
At 31 December 2012 At 31 December 2011<br />
–––––––––––––––––––––––––––––––––––––– ––––––––––––––––––––––––––––––––––––––<br />
Expected return Fair value £m Expected return Fair value £m<br />
Equities 8.0% 359.5 8.0% 335.2<br />
Bonds, gilts <strong>and</strong> cash 4.0% 276.7 3.95%-4.2% 215.0<br />
Pensions SPV 3.7% 42.0 4.2% 44.0<br />
Property 5.2% 59.8 5.2% 58.0<br />
FINANCIAL<br />
STATEMENTS<br />
Total fair value of assets 738.0 652.2<br />
Actuarial value of liability (736.4) (632.9)<br />
Surplus in scheme 1.6 19.3<br />
Related deferred tax liability (0.4) (4.9)<br />
Net pension asset 1.2 14.4<br />
121
NOTES TO THE FINANCIAL STATEMENTS<br />
28. Pension arrangements continued<br />
BSS Schemes<br />
At 31 December 2012 At 31 December 2011<br />
–––––––––––––––––––––––––––––––––––––– ––––––––––––––––––––––––––––––––––––––<br />
Expected Fair value Expected Fair value<br />
return £m return £m<br />
Equities 8.0% 153.9 8.0% 145.1<br />
Bonds, gilts <strong>and</strong> cash 4.0% 16.2 3.95%-4.2% 17.2<br />
Property 5.2% 1.7 5.2% 4.1<br />
Total fair value of assets 171.8 166.4<br />
Actuarial value of liability (230.9) (231.4)<br />
Deficit in schemes (59.1) (65.0)<br />
Related deferred tax asset 13.4 16.3<br />
Net pension liability (45.7) (48.7)<br />
Actual return on scheme assets<br />
2012 2011<br />
–––––––––––––––––––––––––––––––––––––– ––––––––––––––––––––––––––––––––––––––<br />
£m % £m %<br />
TP Scheme 63.8 8.6 5.0 0.8<br />
BSS Schemes 17.4 10.1 (5.3) (3.1)<br />
d. The amount included in the balance sheet arising from the Group’s obligations in respect of its defined benefit schemes <strong>and</strong> the movements during the<br />
year<br />
2012 2011<br />
––––––––––––––––––––––––––––––––––––––––––––––––––––––––––––––––––– –––––––––––––––––––––––––––––––––––––––––––––––––––––––––––––––––––<br />
TP Scheme BSS Schemes Group TP Scheme BSS Schemes Group<br />
£m £m £m £m £m £m<br />
At 1 January 19.3 (65.0) (45.7) 31.7 (59.6) (27.9)<br />
Income / (expense) recognised in the income statement 2.6 (1.5) 1.1 7.4 (2.7) 4.7<br />
Transfer of liability (1.4) 1.4 - - - -<br />
Contributions from sponsoring companies 26.9 6.0 32.9 19.5 7.8 27.3<br />
Actuarial losses (45.8) - (45.8) (39.3) (10.5) (49.8)<br />
At 31 December 1.6 (59.1) (57.5) 19.3 (65.0) (45.7)<br />
e. Movements in the present value of defined benefit obligations in the current period<br />
2012 2011<br />
––––––––––––––––––––––––––––––––––––––––––––––––––––––––––––––––––– –––––––––––––––––––––––––––––––––––––––––––––––––––––––––––––––––––<br />
TP Scheme BSS Schemes Group TP Scheme BSS Schemes Group<br />
£m £m £m £m £m £m<br />
At 1 January (632.9) (231.4) (864.3) (611.7) (229.1) (840.8)<br />
Service cost (7.2) (2.8) (10.0) (3.5) (3.6) (7.1)<br />
Interest cost (31.3) (10.8) (42.1) (32.5) (12.2) (44.7)<br />
Transfer of liability (13.9) 13.9 - - - -<br />
Contributions from scheme members (5.0) (0.1) (5.1) (5.2) (0.1) (5.3)<br />
Actuarial (losses) / gains (68.5) (5.3) (73.8) (0.9) 7.9 7.0<br />
Foreign exchange - 0.1 0.1 - 0.2 0.2<br />
Benefits paid 22.4 5.5 27.9 20.9 5.5 26.4<br />
At 31 December (736.4) (230.9) (967.3) (632.9) (231.4) (864.3)<br />
122
TRAVIS PERKINS ANNUAL REPORT AND ACCOUNTS 2012<br />
28. Pension arrangements continued<br />
f. Movements in the present value of fair value of scheme assets in the current period<br />
2012 2011<br />
––––––––––––––––––––––––––––––––––––––––––––––––––––––––––––––––––– –––––––––––––––––––––––––––––––––––––––––––––––––––––––––––––––––––<br />
TP Scheme BSS Schemes Group TP Scheme BSS Schemes Group<br />
£m £m £m £m £m £m<br />
At 1 January 652.2 166.4 818.6 643.4 169.5 812.9<br />
Expected return of scheme assets 41.1 12.1 53.2 43.4 13.1 56.5<br />
Actuarial gains / (losses) 22.7 5.3 28.0 (38.4) (18.4) (56.8)<br />
Transfer of assets 12.5 (12.5) - - - -<br />
Contributions from sponsoring companies 26.9 6.0 32.9 19.5 7.8 27.3<br />
Contributions from scheme members 5.0 0.1 5.1 5.2 0.1 5.3<br />
Foreign exchange - (0.1) (0.1) - (0.2) (0.2)<br />
Benefits paid (22.4) (5.5) (27.9) (20.9) (5.5) (26.4)<br />
At 31 December 738.0 171.8 909.8 652.2 166.4 818.6<br />
g. Cumulative actuarial gains <strong>and</strong> losses recognised in equity<br />
TP Scheme 2012 2011<br />
£m £m<br />
At 1 January (221.4) (182.1)<br />
Net actuarial losses recognised in the year (45.8) (39.3)<br />
At 31 December (267.2) (221.4)<br />
BSS Schemes 2012 2011<br />
£m £m<br />
At 1 January (10.5) -<br />
Net actuarial losses recognised in year - (10.5)<br />
At 31 December (10.5) (10.5)<br />
h. History of experience gains <strong>and</strong> losses<br />
TP Scheme 2012 2011 2010 2009 2008<br />
Fair value of scheme assets (£m) 738.0 652.2 643.4 528.1 420.7<br />
Present value of scheme obligations (£m) (736.4) (632.9) (611.7) (571.1) (490.6)<br />
Surplus / (deficit) in the scheme (£m) 1.6 19.3 31.7 (43.0) (69.9)<br />
Experience adjustments on scheme liabilities<br />
Amounts (£m) 21.5 - - - 13.4<br />
Percentage of scheme liabilities (%) 2.9% - - - 2.7%<br />
Experience adjustments on scheme assets<br />
Amounts (£m) 22.7 38.4 34.5 62.3 (157.2)<br />
Percentage of scheme assets (%) 3.1% 6.0% 5.4% 11.8% (37.4%)<br />
BSS Scheme 2012 2011 2011<br />
Fair value of scheme assets (£m) 171.8 166.4 169.5<br />
Present value of scheme obligations (£m) (230.9) (231.4) (229.1)<br />
FINANCIAL<br />
STATEMENTS<br />
Deficit in the schemes (£m) (59.1) (65.0) (59.6)<br />
Experience adjustments on scheme liabilities<br />
Amounts (£m) (3.8) 7.9 39.4<br />
Percentage of scheme liabilities (%) 1.6% 3.4% 17.2%<br />
Experience adjustments on scheme assets<br />
Amounts (£m) 5.3 (18.4) 3.4<br />
Percentage of scheme assets (%) 3.1% (11.1)% 2.1%<br />
123
NOTES TO THE FINANCIAL STATEMENTS<br />
28. Pension arrangements continued<br />
i. Sensitivities<br />
The estimated effects of changing the key assumptions (discount rate, inflation <strong>and</strong> life expectancy) on the IAS19 balance sheet position as at<br />
31 December 2012<br />
Assumption TP Scheme effect on 2012 bSS Schemes effect on 2012<br />
balance sheet position<br />
balance sheet position<br />
Discount rate Increase of 0.1% 14.6 4.1<br />
Decrease of 0.1% (14.9) (4.5)<br />
Inflation Increase of 0.1% (8.3) (3.0)<br />
Decrease of 0.1% 8.5 3.3<br />
Longevity Increase of 1 year (17.2) (6.2)<br />
Decrease of 1 year 17.2 6.0<br />
Defined contribution schemes<br />
The Group operates five defined contribution schemes for all qualifying employees. The pension cost, which represents contributions payable by the<br />
Group, amounted to £7.2m (2011: £5.7m).<br />
29. Acquisition of businesses<br />
a. Toolstation Limited<br />
On the 3 January 2012 the Group acquired the remaining 70% of the issued share capital of Toolstation Limited. The Group had previously acquired 30%<br />
in April 2008 which included an option to purchase the remaining 70%. The acquisition was accounted for using the acquisition method of accounting. In<br />
accordance with the requirements of the acquisition method of accounting the existing 30% holding has been re-valued to fair value which realised a gain<br />
of £35m which has been credited to the income statement as an exceptional item. The aggregate consideration paid following the payment on 3 January<br />
was £41.5m. On 3 January 2012, future consideration dependent upon future performance <strong>and</strong> expansion of the business over the period to December 2013<br />
was estimated to be £65m. The deferred consideration is payable in 2014 <strong>and</strong> consequently the deferred consideration has been discounted over a two year<br />
period from acquisition to final settlement.<br />
Fair values ascribed to identifiable assets as at 3 January 2012 are shown in the table below<br />
2012<br />
Fair value acquired<br />
£m<br />
Property, plant <strong>and</strong> equipment 7.7<br />
Identifiable intangible assets 53.3<br />
Cash at bank 0.8<br />
Inventories 21.4<br />
Trade <strong>and</strong> other receivables 4.3<br />
Trade <strong>and</strong> other payables (25.8)<br />
Deferred tax liabilities (6.4)<br />
Loan repayable to Travis Perkins plc (39.6)<br />
15.7<br />
Goodwill 102.9<br />
118.6<br />
Satisfied by:<br />
Cash paid in prior periods 17.3<br />
Cash paid in current period 24.2<br />
Contingent consideration 65.0<br />
106.5<br />
Revaluation of pre existing equity holding 33.1<br />
Discount on contingent consideration (13.8)<br />
Losses previously recognised (7.2)<br />
118.6<br />
124
TRAVIS PERKINS ANNUAL REPORT AND ACCOUNTS 2012<br />
29. Acquisition of businesses continued<br />
Toolstation Limited contributed £135.3m revenue <strong>and</strong> £6.5m to the Group’s operating profit for the period between the date of acquisition <strong>and</strong> the balance<br />
sheet date. This period also comprises the Group’s financial year.<br />
Goodwill recognised is driven from significant value in forecast growth, forecast new customers <strong>and</strong> the value of the assembled workforce. None of the<br />
goodwill is expected to be deductible for tax purposes.<br />
The fair value of the acquired receivables is £0.4m. All acquired receivables are expected to be collected in full.<br />
Acquisition costs included in administration expenses amount to £0.3m.<br />
In accordance with IAS 39 the contingent consideration payable has been reassessed at 31 December 2012 <strong>and</strong> as a result the amount previously<br />
recognised of £65m, discounted to £51.2m, has been reduced to £47.0m with the difference of £4.2m being credited to the income statement as exceptional<br />
investment income.<br />
b. Other acquisitions<br />
In addition to the acquisition of Toolstation the Group acquired 5 other businesses for a total consideration of £1.1m resulting in goodwill of £0.6m.<br />
30. Operating lease arrangements<br />
The Group leases a number of trading properties under operating leases. The leases, at inception, are typically 25 years in duration, although some have<br />
lessee only break clauses of between 10 <strong>and</strong> 15 years. Lease payments are reviewed every five years <strong>and</strong> increases applied in line with market rates. The<br />
Group also leases certain items of plant <strong>and</strong> equipment. The Company has no operating lease arrangements.<br />
a. The Group as lessee<br />
2012 2011<br />
£m £m<br />
Minimum lease payments under operating leases recognised in income for the year 189.0 176.0<br />
At the balance sheet date, the Group had outst<strong>and</strong>ing commitments for future minimum lease payments under non-cancellable operating leases, which<br />
fall due as follows:<br />
2012 2011<br />
£m £m<br />
Within one year 181.0 173.3<br />
In the second to fifth years inclusive 619.2 599.9<br />
After five years 1,085.2 1,194.4<br />
1,885.4 1,967.6<br />
b. The Group as lessor<br />
The Group sublets a number of ex-trading properties to third parties. Property rental income earned during the year in respect of these properties was<br />
£4.2m (2011: £4.1m).<br />
At the balance sheet date, the Group had contracts with tenants for the following future minimum lease payments:<br />
2012 2011<br />
£m £m<br />
Within one year 4.1 3.6<br />
In the second to fifth years inclusive 14.2 12.6<br />
After five years 21.1 17.3<br />
31. Capital commitments<br />
THE GROUP<br />
39.4 33.5<br />
THE COMPANY<br />
–––––––––––––––––––––––––––––––––––––– ––––––––––––––––––––––––––––––––––––––<br />
2012 2011 2012 2011<br />
£m £m £m £m<br />
Contracted for but not provided in the accounts 12.2 15.6 - -<br />
FINANCIAL<br />
STATEMENTS<br />
125
NOTES TO THE FINANCIAL STATEMENTS<br />
32. Related party transactions<br />
The Group has a related party relationship with its subsidiaries its directors <strong>and</strong> with its pension schemes (note 28). Transactions between group companies,<br />
which are related parties, have been eliminated on consolidation <strong>and</strong> are not disclosed in this note. Transactions between the Company <strong>and</strong> its subsidiaries<br />
are disclosed below. In addition the remuneration, <strong>and</strong> the details of interests in the share capital of the Company, of the Directors, are provided in the<br />
audited part of the remuneration report on pages 70 to 74.<br />
The remuneration of the key management personnel of the Group is set out below in aggregate for each of the categories specified in IAS 24 Related<br />
Party Disclosures.<br />
2012 2011<br />
£m £m<br />
Short term employee benefits 7.9 7.3<br />
Share based payments 4.4 4.9<br />
12.3 12.2<br />
The Company undertakes the following transactions with its active subsidiaries:<br />
• Providing day-to-day funding from its UK banking facilities;<br />
• Paying interest to members of the Group totalling £15.6m (2011: £6.4m);<br />
• Levying an annual management charge to cover services provided to members of the Group of £7.9m (2011: £6.9m);<br />
• Receiving preference dividends totalling £nil (2011: £9.2m);<br />
• Receiving annual dividends totalling £74.2m (2011: £79.1m).<br />
Details of balances outst<strong>and</strong>ing with subsidiary companies are shown in note 18 <strong>and</strong> on the Balance Sheet on page 85.<br />
There have been no material related party transactions with directors.<br />
The Group advanced a total of £2.9m (2011:£2.3m) to all the Group’s associate companies in 2012. Operating transactions with the associates during the<br />
year were not significant.<br />
33. Analysis of changes in net debt<br />
THE GROUP<br />
––––––––––––––––––––––––––––––––––––––––––––––––––––––––––––––––––––––––––––––––––––––––––––––––––––––––––––––––––––––––––––––––––––––––––––––––––––––––––––––––––<br />
Term loan<br />
<strong>and</strong> revolving Unsecured Liability to<br />
cash <strong>and</strong> cash Finance credit facility senior US$ pension<br />
equivalents leases <strong>and</strong> loan notes loan notes scheme Total<br />
£m £m £m £m £m £m<br />
At 1 January 2011 (50.9) 21.8 400.6 366.0 36.1 773.6<br />
Cash flow (27.7) (1.5) (78.7) (72.2) (1.4) (181.5)<br />
Fair value of BSS loan - - - (12.4) - (12.4)<br />
Exchange movement - - - 0.5 - 0.5<br />
Fair value movement - - - (1.5) - (1.5)<br />
Finance charges amortised - - 3.1 - - 3.1<br />
Amortisation of swap cancellation receipt - - - (1.1) - (1.1)<br />
Discount unwind on liability to pension scheme - - - - 2.5 2.5<br />
At 1 January 2012 (78.6) 20.3 325.0 279.3 37.2 583.2<br />
Cash flow (60.5) 5.7 (58.8) - (2.8) (116.4)<br />
Exchange movement - - - (2.7) - (2.7)<br />
Fair value movement - - - (14.4) - (14.4)<br />
Finance charges amortised - - 1.2 - - 1.2<br />
Amortisation of swap cancellation receipt - - - (1.1) - (1.1)<br />
Lease surrendered - (0.1) - - - (0.1)<br />
Discount unwind on liability to pension scheme - - - - 2.5 2.5<br />
31 December 2012 (139.1) 25.9 267.4 261.1 36.9 452.2<br />
126
TRAVIS PERKINS ANNUAL REPORT AND ACCOUNTS 2012<br />
33. Analysis of changes in net debt continued<br />
Balances at 31 December comprise:<br />
THE GROUP<br />
––––––––––––––––––––––––––––––––––––––<br />
2012 2011<br />
£m £m<br />
Cash <strong>and</strong> cash equivalents 139.1 (78.6)<br />
Non-current interest bearing loans <strong>and</strong> borrowings (195.2) 598.2<br />
Current interest bearing loans <strong>and</strong> borrowings (396.1) 63.6<br />
Net debt (452.2) 583.2<br />
34. Gearing<br />
THE GROUP<br />
––––––––––––––––––––––––––––––––––––––<br />
2012 2011<br />
£m £m<br />
Net debt under IFRS (452.2) (583.2)<br />
IAS 17 finance leases 18.7 20.3<br />
Unamortised swap cancellation receipt 2.9 4.0<br />
Liability to pension scheme 36.9 37.2<br />
Fair value adjustment to debt 19.5 36.6<br />
Finance charges netted off bank debt (0.3) (1.5)<br />
Net debt under covenant calculations (374.5) (486.6)<br />
Total equity 2,308.1 2,107.8<br />
Gearing 16.2% 23.1%<br />
35. Free cash flow<br />
THE GROUP<br />
––––––––––––––––––––––––––––––––––––––<br />
2012 2011<br />
£m £m<br />
Net debt at 1 January (583.2) (773.6)<br />
Net debt at 31 December (452.2) (583.2)<br />
Decrease in net debt 131.0 190.4<br />
Dividends paid 51.2 38.8<br />
Net cash outflow for expansion capital expenditure 27.9 54.4<br />
Net cash outflow for acquisitions 24.5 9.9<br />
Disposal of business - (26.9)<br />
Bank fees paid - 6.1<br />
Amortisation of swap cancellation receipt (1.1) (1.1)<br />
Discount unwind on liability to pension scheme 2.5 2.5<br />
Cash impact of exceptional items 4.7 17.8<br />
Interest in associate 2.9 2.3<br />
Shares issued <strong>and</strong> sale of own shares (8.9) (10.6)<br />
Decrease in fair value of debt <strong>and</strong> exchange (17.1) (13.3)<br />
Movement in finance charges netted off bank debt 1.2 3.1<br />
Special pension contributions 23.0 20.1<br />
FINANCIAL<br />
STATEMENTS<br />
Free cash flow 241.8 293.5<br />
127
NOTES TO THE FINANCIAL STATEMENTS<br />
36a. Adjusted ratio of net debt to earnings before interest, tax <strong>and</strong> depreciation<br />
THE GROUP<br />
––––––––––––––––––––––––––––––––––––––<br />
2012 2011<br />
£m £m<br />
Profit before tax 313.3 269.6<br />
Net finance costs 26.7 20.9<br />
Depreciation <strong>and</strong> amortisation 86.8 76.7<br />
EBITDA under IFRS 426.8 367.2<br />
Exceptional operating items 8.7 9.8<br />
Exceptional investment income (39.5) -<br />
IFRS adjustments not included in covenant calculations (2.6) (2.7)<br />
Adjusted EBITDA under covenant calculations 393.4 374.3<br />
Net debt under covenant calculations 374.5 486.6<br />
Adjusted net debt to EBITDA 0.95x 1.30x<br />
36b. Lease adjusted ratio of net debt to earnings before interest, tax , depreciation <strong>and</strong> operating lease rentals<br />
THE GROUP<br />
––––––––––––––––––––––––––––––––––––––<br />
2012 2011<br />
£m £m<br />
EBITDA under IFRS 393.4 374.3<br />
Operating lease rentals 189.0 176.0<br />
EBITDAR 582.4 550.3<br />
Net debt under covenant calculations 374.5 486.6<br />
Operating lease rentals x8 1,512.0 1,408.0<br />
Lease adjusted net debt 1,886.5 1,894.6<br />
Lease adjusted net debt to EBITDAR 3.2x 3.4x<br />
128
TRAVIS PERKINS ANNUAL REPORT AND ACCOUNTS 2012<br />
37. Adjusted pre-tax return on capital<br />
THE GROUP<br />
––––––––––––––––––––––––––––––––––––––<br />
2012 2011<br />
£m £m<br />
Operating profit 300.5 290.5<br />
Amortisation of intangible assets 17.4 12.9<br />
Exceptional items 8.7 9.8<br />
Adjusted operating profit 326.6 313.2<br />
Opening net assets 2,107.8 1,951.8<br />
Net pension deficit 34.3 20.1<br />
Goodwill written off 92.7 92.7<br />
Net borrowings 583.2 773.6<br />
Exchange adjustment (36.6) (52.2)<br />
Opening capital employed 2,781.4 2,786.0<br />
Closing net assets 2,308.1 2,107.8<br />
Net pension deficit 44.5 34.3<br />
Goodwill written off 92.7 92.7<br />
Net borrowings 452.2 583.2<br />
Exchange adjustment (19.5) (36.6)<br />
Closing capital employed 2,878.0 2,781.4<br />
Average capital employed 2,829.7 2,783.7<br />
Adjusted pre–tax return on capital 11.5% 11.3%<br />
FINANCIAL<br />
STATEMENTS<br />
129
Five Year Record<br />
Consolidated income statement<br />
2012 2011 2010 2009 2008<br />
£m £m £m £m £m<br />
Revenue 4,844.9 4,779.1 3,152.8 2,930.9 3,178.6<br />
Operating profit before amortisation <strong>and</strong> exceptional items 326.6 313.2 239.0 224.6 271.5<br />
Amortisation (17.4) (12.9) (0.2) - -<br />
Exceptional items (8.7) (9.8) (19.0) 32.7 (56.2)<br />
Operating profit 300.5 290.5 219.8 257.3 215.3<br />
Exceptional investment income 39.5 - - - -<br />
Net finance costs (26.7) (20.9) (23.0) (44.6) (69.0)<br />
Profit before tax 313.3 269.6 196.8 212.7 146.3<br />
Income tax expense (53.7) (57.2) (55.5) (55.3) (44.4)<br />
Net profit 259.6 212.4 141.3 157.4 101.9<br />
Adjusted pre-tax return on capital 11.5% 11.3% 12.2% 10.9% 12.9%<br />
Basic earnings per share 108.9p 90.3p 69.6p 88.4p 68.6p<br />
Adjusted earnings per share 95.1p 93.1p 77.2p 75.2p 96.9p<br />
Dividend declared per ordinary share (pence) 25.0p 20.0p 15.0p - 14.5p<br />
Branches at 31 December (No.) Includes branches of associates 1,896 1,868 1,813 1,238 1,223<br />
Average number of employees (No.) 21,887 21,423 15,792 14,528 15,414<br />
Basic <strong>and</strong> adjusted earnings per share for 2008 have been restated for the impact of the rights issue.<br />
Consolidated cash flow statement<br />
2012 2011 2010 2009 2008<br />
£m £m £m £m £m<br />
Cash generated from operations 327.6 345.1 282.3 319.8 337.6<br />
Net interest paid (27.3) (23.5) (16.0) (29.0) (63.0)<br />
Swap cancellation receipt / (payment) - - 13.7 (28.7) -<br />
Income taxes paid (64.5) (26.3) (42.4) (27.3) (66.0)<br />
Net purchases of investments, property <strong>and</strong> plant (49.7) (94.2) (35.4) (7.8) (82.4)<br />
Interest in associates (2.9) (2.3) (12.5) (12.9) (20.7)<br />
Disposal of businesses - 26.9 - - -<br />
Acquisition of businesses net of cash acquired (24.5) (9.9) (294.9) (1.0) (22.5)<br />
Proceeds from issuance of share capital 8.9 10.6 0.3 300.3 0.6<br />
Dividends paid (51.2) (38.8) (10.1) - (52.5)<br />
Bank facility finance charges - (6.1) - - (14.7)<br />
Net movement in finance lease liabilities 5.7 (1.6) (1.3) (1.5) (2.1)<br />
Repayment of unsecured loan notes - - (0.6) (0.1) (11.5)<br />
Liability to pension scheme - - 34.7 - -<br />
Decrease in bank loans (61.6) (152.2) (214.1) (160.0) (33.7)<br />
Net increase / (decrease) in cash <strong>and</strong> cash equivalents 60.5 27.7 (296.3) 351.8 (30.9)<br />
Net debt at 1 January (583.2) (773.6) (467.2) (1,017.4) (941.0)<br />
Non cash adjustment 14.6 8.9 (3.1) 36.8 (92.8)<br />
Cash flow from debt <strong>and</strong> debt acquired 55.9 153.8 (7.0) 161.6 47.3<br />
Net debt at 31 December (452.2) (583.2) (773.6) (467.2) (1,017.4)<br />
Free cash flow 241.8 293.5 277.8 294.4 185.3<br />
130
TRAVIS PERKINS ANNUAL REPORT AND ACCOUNTS 2012<br />
Consolidated balance sheet<br />
2012 2011 2010 2009 2008<br />
£m £m £m £m £m<br />
Assets<br />
Non-current assets<br />
Property, plant <strong>and</strong> equipment 578.4 562.6 527.1 499.0 534.5<br />
Goodwill <strong>and</strong> other intangible assets 2,232.3 2,095.1 2,109.7 1,515.3 1,513.9<br />
Derivative financial instruments 12.8 40.3 57.0 44.7 80.3<br />
Interest in associates 6.7 51.3 45.7 31.7 19.6<br />
Retirement benefit assets 1.6 19.3 31.7 - -<br />
Investment property <strong>and</strong> other investments 2.8 1.9 1.9 4.8 5.4<br />
Deferred tax asset - - - 12.0 19.5<br />
Current assets<br />
Inventories 637.1 596.0 571.4 312.7 321.9<br />
Trade <strong>and</strong> other receivables 746.4 746.1 687.2 375.4 388.6<br />
Assets held for resale - - 2.3 - -<br />
Cash <strong>and</strong> cash equivalents 139.1 78.6 62.9 347.2 7.7<br />
Total assets 4,357.2 4,191.2 4,096.9 3,142.8 2,891.4<br />
CAPITAL AND RESERVES<br />
Issued capital 24.5 24.4 24.2 20.9 12.3<br />
Share premium account 487.2 480.8 471.5 471.2 179.5<br />
Merger reserve 326.5 326.5 325.9 - -<br />
Own shares (62.4) (75.2) (83.4) (83.7) (83.7)<br />
Other reserves 18.5 15.7 14.4 9.2 6.0<br />
Accumulated profits 1,513.8 1,335.6 1,199.2 1,042.8 904.1<br />
Total equity 2,308.1 2,107.8 1,951.8 1,460.4 1,018.2<br />
Non-current liabilities<br />
Interest bearing loans <strong>and</strong> borrowings 195.2 598.2 760.9 739.1 1,007.3<br />
Derivative financial instruments 4.9 5.9 4.2 6.1 25.8<br />
Retirement benefit obligations 59.1 65.0 59.6 43.0 69.9<br />
Long term provisions <strong>and</strong> other payables 67.0 28.9 36.0 43.7 47.8<br />
Deferred tax liabilities 85.0 97.4 110.5 62.8 74.7<br />
Current liabilities<br />
Interest bearing loans <strong>and</strong> borrowings 396.1 63.6 75.6 75.3 17.8<br />
Derivative financial instruments 2.6 - 2.5 - -<br />
Trade <strong>and</strong> other payables 1,107.6 1,088.3 1,004.5 638.7 582.2<br />
Tax liabilities 74.8 75.9 36.5 28.1 9.1<br />
Short-term provisions 56.8 60.2 54.8 45.6 38.6<br />
Total liabilities 2,049.1 2,083.4 2,145.1 1,682.4 1,873.2<br />
Total equity <strong>and</strong> liabilities 4,357.2 4,191.2 4,096.9 3,142.8 2,891.4<br />
FINANCIAL<br />
STATEMENTS<br />
131
Notice of <strong>Annual</strong> General Meeting<br />
Notice is hereby given that the forty-ninth <strong>Annual</strong> General Meeting<br />
of Travis Perkins plc will be held at Northampton Rugby Football<br />
Club, Franklin’s Gardens, Weedon Road, Northampton, NN5 5BG on<br />
Thursday 23 May 2013 at 12.00 noon.<br />
The Resolutions<br />
Resolutions 1 to 15 (inclusive) will be proposed as ordinary<br />
resolutions. Resolutions 16 to 18 (inclusive) will be proposed as<br />
special resolutions.<br />
1. To receive the Company’s annual accounts for the financial year<br />
ended 31 December 2012, together with the Directors’ report, the<br />
Directors’ remuneration report <strong>and</strong> the Auditor’s report on those<br />
accounts <strong>and</strong> on the auditable part of the Directors’ remuneration<br />
report.<br />
2. To declare a final dividend for the financial year ended<br />
31 December 2012 of 17 pence per ordinary share, payable to<br />
shareholders on the register at the close of business on 3 May<br />
2013.<br />
3. To appoint Tony Buffin as a director of the Company.<br />
Biographical details of Tony Buffin appear on page 54.<br />
4. To re-appoint Chris Bunker as a non-executive director of the<br />
Company. Biographical details of Chris Bunker appear on page 55.<br />
5. To re-appoint John Coleman as a non-executive director of the<br />
Company. Biographical details of John Coleman appear on<br />
page 55.<br />
6. To re-appoint Andrew Simon as a non-executive director of the<br />
Company. Biographical details of Andrew Simon appear on<br />
page 55.<br />
7. To re-appoint Ruth Anderson as a non-executive director of the<br />
Company. Biographical details of Ruth Anderson appear on<br />
page 55.<br />
8. To re-appoint Geoff Cooper as a director of the Company.<br />
Biographical details of Geoff Cooper appear on page 54.<br />
9. To re-appoint John Carter as a director of the Company.<br />
Biographical details of John Carter appear on page 54.<br />
10. To re-appoint Robert Walker as a director of the Company.<br />
Biographical details of Robert Walker appear on page 54.<br />
11. To re-appoint Deloitte LLP, Chartered Accountants, as auditor of<br />
the Company to hold office from the conclusion of this meeting<br />
until the conclusion of the next general meeting of the Company<br />
at which accounts are laid.<br />
12. To authorise the Directors to fix the remuneration of Deloitte LLP.<br />
13. That the Directors’ Remuneration <strong>Report</strong> for the financial year<br />
ended 31 December 2012 set out on pages 64 to 74 be approved.<br />
14. That the replacement Deferred Share Bonus Plan (the ‘Plan’)<br />
produced in draft to this meeting <strong>and</strong>, for the purposes of<br />
identification, initialled by the Chairman, be approved <strong>and</strong> the<br />
Directors be authorised to make such modifications to the Plan as<br />
they may consider appropriate.<br />
15. That, in substitution for all existing authorities, the Directors be<br />
generally <strong>and</strong> unconditionally authorised in accordance with<br />
section 551 of the Companies Act 2006 to exercise all the powers<br />
of the Company to allot:<br />
a. shares (as defined in section 540 of the Companies Act 2006)<br />
or grant rights to subscribe for or to convert any security into<br />
shares up to an aggregate nominal amount of £8,166,764; <strong>and</strong><br />
b. equity securities (as such phrase is to be interpreted in<br />
accordance with section 560 of the Companies Act 2006) up to<br />
an aggregate nominal amount of £16,333,529 (such amount<br />
to be reduced by the aggregate nominal amount of shares<br />
allotted or rights to subscribe for or to convert any security into<br />
shares in the Company granted under paragraph (a) of this<br />
resolution 15) in connection with an offer by way of a rights<br />
issue:<br />
i. to ordinary shareholders in proportion (as nearly as may be<br />
practicable) to their existing holdings; <strong>and</strong><br />
ii. to holders of other equity securities (as defined in section<br />
560(1) of the Companies Act 2006) as required by the rights<br />
of those securities or, subject to such rights, as the directors<br />
otherwise consider necessary,<br />
<strong>and</strong> so that the Directors may impose any limits or restrictions<br />
<strong>and</strong> make any arrangements which they consider necessary<br />
or appropriate to deal with treasury shares, fractional<br />
entitlements, record dates, legal, regulatory or practical<br />
problems in, or under the laws of, any territory or any<br />
other matter such authorities to apply until the end of the<br />
Company’s next annual general meeting after this resolution<br />
is passed (or, if earlier, until the close of business on 30 June<br />
2014) but, in each case, so that the Company may make<br />
offers <strong>and</strong> enter into agreements before the authority expires<br />
which would, or might, require shares to be allotted or rights<br />
to subscribe for or to convert any security into shares to be<br />
granted after the authority expires <strong>and</strong> the Directors may allot<br />
shares or grant such rights under any such offer or agreement<br />
as if the authority had not expired.<br />
16. That, in substitution for all existing powers <strong>and</strong> subject to the<br />
passing of resolution 15, the Directors be generally empowered<br />
pursuant to section 570 of the Companies Act 2006 to allot equity<br />
securities (as such phrase is to be interpreted in section 560<br />
of the Companies Act 2006) for cash pursuant to the authority<br />
granted by resolution 15 <strong>and</strong>/or where the allotment constitutes<br />
an allotment of equity securities by virtue of section 560(3) of the<br />
Companies Act 2006, in each case free of the restriction in section<br />
561 of the Companies Act 2006, such power to be limited:<br />
a. to the allotment of equity securities in connection with an offer<br />
of equity securities (but in the case of an allotment pursuant to<br />
the authority granted by paragraph (b) of resolution 15, such<br />
power shall be limited to the allotment of equity securities in<br />
connection with an offer by way of a rights issue only):<br />
i. to ordinary shareholders in proportion (as nearly as may be<br />
practicable) to their existing holdings; <strong>and</strong><br />
ii. to holders of other equity securities (as defined in section<br />
560(1) of the Companies Act 2006), as required by the rights<br />
of those securities or, subject to such rights, as the directors<br />
otherwise consider necessary <strong>and</strong> so that the Directors<br />
may impose any limits or restrictions <strong>and</strong> make any<br />
132
TRAVIS PERKINS ANNUAL REPORT AND ACCOUNTS 2012<br />
arrangements which they consider necessary or appropriate<br />
to deal with treasury shares, fractional entitlements, record<br />
dates, legal, regulatory or practical problems in, or under the<br />
laws of, any territory or any other matter; <strong>and</strong><br />
b. to the allotment of equity securities pursuant to the authority<br />
granted by paragraph (a) of resolution 15 <strong>and</strong>/or an allotment<br />
which constitutes an allotment of equity securities by virtue<br />
of section 560(3) of the Companies Act 2006 (in each case<br />
otherwise than in the circumstances set out in paragraph (a)<br />
of this resolution 16) up to a nominal amount of £1,225,015<br />
calculated, in the case of equity securities which are rights<br />
to subscribe for, or to convert securities into, ordinary shares<br />
(as defined in section 560(1) of the Companies Act 2006) by<br />
reference to the aggregate nominal amount of relevant shares<br />
which may be allotted pursuant to such rights, such power<br />
to apply until the end of the Company’s next annual general<br />
meeting after this resolution is passed (or, if earlier, until the<br />
close of business on 30 June 2014); but so that the Company<br />
may make offers <strong>and</strong> enter into agreements before the power<br />
expires which would, or might, require equity securities to be<br />
allotted after the power expires <strong>and</strong> the Directors may allot<br />
equity securities under any such offer or agreement as if the<br />
power had not expired.<br />
17. That a general meeting other than an annual general meeting<br />
may be called on not less than 14 clear days notice.<br />
18. That the Company be <strong>and</strong> is hereby generally <strong>and</strong><br />
unconditionally authorised to make one or more market<br />
purchases (within the meaning of section 693(4) of the<br />
Companies Act 2006) of ordinary shares of 10 pence each in the<br />
capital of the Company (‘ordinary shares’), provided that:<br />
a. the maximum aggregate number of ordinary shares authorised<br />
to be purchased is 24,500,293 (representing 10% of the issued<br />
share capital of the Company as at 27 March 2013);<br />
b. the minimum price (exclusive of expenses) which may be paid<br />
for an ordinary share is its nominal value of 10 pence;<br />
c. the maximum price (exclusive of expenses) which may be<br />
paid for an ordinary share is an amount equal to 105% of the<br />
average of the middle market quotations for an ordinary share<br />
as derived from The London Stock Exchange Daily Official List<br />
for the five business days immediately preceding the day on<br />
which that ordinary share is purchased;<br />
d. this authority expires at the conclusion of the next <strong>Annual</strong><br />
General Meeting of the Company or 30 June 2014, whichever is<br />
the earlier; <strong>and</strong><br />
e. the Company may make a contract to purchase ordinary<br />
shares under this authority before the expiry of such authority,<br />
which will or may be executed wholly or partly after the expiry<br />
of such authority, <strong>and</strong> may make a purchase of ordinary<br />
shares pursuant to any such contract.<br />
By order of the Board<br />
Andrew Pike<br />
Company Secretary<br />
Lodge Way House, Harlestone Road, Northampton NN5 7UG<br />
3 April 2013<br />
Registered in Engl<strong>and</strong> No. 824821<br />
Directions to Northampton Rugby Football Club can be found on<br />
page 136.<br />
SHAREHOLDER<br />
INFORMATION<br />
133
Notes to the Notice of <strong>Annual</strong> General Meeting<br />
1. A form of proxy is enclosed <strong>and</strong> instructions for its use are shown<br />
on the form. The appointment of a proxy will not prevent a<br />
member from subsequently attending, voting <strong>and</strong> speaking at the<br />
Meeting in person, in which case any votes of the proxy will be<br />
superseded.<br />
2. A member of the Company is entitled to appoint a proxy to<br />
exercise all or any of his rights to attend, speak <strong>and</strong> vote at a<br />
general meeting of the Company. A member may appoint more<br />
than one proxy, provided that each proxy is appointed to exercise<br />
the rights attaching to different shares. A proxy need not be a<br />
member.<br />
3. To appoint more than one proxy, (an) additional proxy form(s)<br />
may be obtained by contacting the Registrars or you may<br />
photocopy the form. Please indicate in the box next to the proxy<br />
holder’s name the number of shares in relation to which they are<br />
authorised to act as your proxy. Please also indicate by ticking<br />
the box provided if the proxy instruction is one of multiple<br />
instructions being given. All forms must be signed <strong>and</strong> should be<br />
returned together in the same envelope.<br />
4. The right to appoint a proxy under note 1 <strong>and</strong> 2 above does<br />
not apply to persons whose shares are held on their behalf<br />
by another person <strong>and</strong> who have been nominated to receive<br />
communication from the Company in accordance with section<br />
146 of the Companies Act 2006 (‘nominated persons’). Nominated<br />
persons may have a right under an agreement with the registered<br />
shareholder who holds shares on their behalf to be appointed<br />
(or to have someone else appointed) as a proxy. Alternatively,<br />
if nominated persons do not have such a right, or do not wish<br />
to exercise it, they may have a right under such an agreement<br />
to give instructions to the person holding the shares as to the<br />
exercise of voting rights.<br />
5. To be effective, the instrument appointing a proxy <strong>and</strong> any<br />
authority under which it is signed (or a notarially certified copy<br />
of such authority) for the <strong>Annual</strong> General Meeting to be held at<br />
Northampton Rugby Football Club, Franklins Gardens, Weedon<br />
Road, Northampton, NN5 5BQ at 12.00 noon on Thursday 23 May<br />
2013 <strong>and</strong> any adjournment(s) thereof must be returned to Capita<br />
Registrars, PXS, 34 Beckenham Road, Beckenham, Kent, BR3 4TU,<br />
by 12.00 noon on 21 May 2013. Alternatively you may submit<br />
your proxy form online by accessing the Shareholder portal at<br />
www.capitaregistrars.com, logging in <strong>and</strong> selecting the ‘Proxy<br />
Voting’ link. If you have not previously registered for electronic<br />
communications, you will first be asked to register as a new user,<br />
for which you will require your investor code (which can be found<br />
on the enclosed proxy form, your share certificate or dividend tax<br />
voucher), family name <strong>and</strong> post code (if resident in the UK).<br />
6. CREST members who wish to appoint a proxy or proxies through<br />
the CREST electronic proxy appointment service may do by using<br />
the procedures described in the CREST Manual.<br />
CREST personal members or other CREST sponsored members,<br />
<strong>and</strong> those CREST members who have appointed a voting service<br />
provider(s) should refer to their CREST sponsors or voting service<br />
provider(s), who will be able to take the appropriate action on their<br />
behalf.<br />
In order for a proxy appointment made by means of CREST<br />
to be valid, the appropriate CREST message (a ‘CREST Proxy<br />
Instruction’) must be properly authenticated in accordance with<br />
Euroclear UK & Irel<strong>and</strong> Limited’s specifications <strong>and</strong> must contain<br />
the information required for such instructions, as described in the<br />
CREST Manual. The message, regardless of whether it constitutes<br />
the appointment of a proxy or an amendment to the instruction<br />
given to a previously appointed proxy must, in order to be valid, be<br />
transmitted so as to be received by the Company’s agent (ID RA10)<br />
by the latest time(s) for receipt of proxy appointments (12.00<br />
noon on 21 May 2013). For this purpose, the time of receipt will<br />
be taken to be the time (as determined by the timestamp applied<br />
to the message by the CREST Application Host) from which the<br />
Company’s agent is able to retrieve the message by enquiry to<br />
CREST in the manner prescribed by CREST. After this time, any<br />
change of instructions to proxies appointed through CREST should<br />
be communicated to the appointee through other means.<br />
CREST members <strong>and</strong>, where applicable, their CREST sponsors<br />
<strong>and</strong> voting service providers should note that Euroclear UK &<br />
Irel<strong>and</strong> Limited does not make available special procedures in<br />
CREST for any particular messages. Normal system timings <strong>and</strong><br />
limitations will therefore apply in relation to the input of CREST<br />
Proxy Instructions. It is the responsibility of the CREST member<br />
concerned to take (or, if the CREST member is a CREST personal<br />
member or sponsored member or has appointed a voting service<br />
provider(s), to procure that his CREST sponsor or voting service<br />
provider(s) take(s)) such action as shall be necessary to ensure<br />
that a message is transmitted by means of the CREST system<br />
by any particular time. In this connection, CREST members<br />
<strong>and</strong>, where applicable, their CREST sponsors or voting service<br />
providers are referred, in particular, to those sections of the CREST<br />
Manual concerning practical limitations of the CREST system <strong>and</strong><br />
timings. The CREST Manual can be reviewed at www.euroclear.<br />
com/CREST.<br />
The Company may treat as invalid a CREST Proxy Instruction<br />
in the circumstances set out in Regulation 35(5)(a) of the<br />
Uncertificated Securities Regulations 2001.<br />
In each case the proxy appointments must be received by the<br />
Company not less than 48 hours before the time appointed for<br />
holding the meeting or any adjournment thereof.<br />
7. Only those members entered on the register of members of<br />
the Company as at 6.00 pm on 21 May 2013 shall be entitled<br />
to attend or vote at the meeting in respect of the number of<br />
shares registered in their name at that time. Changes to entries<br />
on the register of members after that time shall be disregarded<br />
in determining the rights of any person to attend or vote at the<br />
meeting.<br />
134
TRAVIS PERKINS ANNUAL REPORT AND ACCOUNTS 2012<br />
8. Reference to the register means the issuer register of members <strong>and</strong><br />
the Operator register of members maintained in accordance with<br />
Regulation 20 of the Uncertificated Securities Regulations 2001.<br />
9. The following documents will be available for inspection at the<br />
Registered Office of the Company during usual business hours on<br />
any weekday (Saturdays, Sundays <strong>and</strong> public holidays excluded)<br />
from the date of this Notice to the date of the meeting <strong>and</strong> at<br />
Northampton Rugby Football Club from 12.00am on the day of<br />
the meeting until the conclusion of the meeting.<br />
• Copies of contracts of service of directors <strong>and</strong> non–executive<br />
directors’ letters of appointment with the Company, or with any<br />
of its subsidiary companies.<br />
• The register of directors’ interests kept by the Company.<br />
• A copy of the Company’s Articles of Association.<br />
• A statement giving particulars of directors’ relevant<br />
transactions.<br />
• A copy of the draft rules of the replacement Deferred Share<br />
Bonus Plan. Copies will also be available for inspection at the<br />
offices of Aon Hewitt, 10 Devonshire Square, London, EC2M 4YP<br />
during usual business hours on any weekday (Saturdays <strong>and</strong><br />
English public holidays excepted) from the date of this notice<br />
until the conclusion of the meeting.<br />
10. At 27 March 2013 (being the latest practicable date before<br />
publication of this notice) the issued share capital of the<br />
Company consisted of 245,002,932 ordinary shares, carrying one<br />
vote each. Therefore, the total voting rights in the Company as at<br />
27 March was 245,002,932.<br />
11. A person to whom this Notice is sent who is a person<br />
nominated under section 146 of the Companies Act 2006 to<br />
enjoy information rights (a ‘Nominated Person’) may, under<br />
an agreement between him/her <strong>and</strong> the shareholder by whom<br />
he/she was nominated, have a right to be appointed (or to<br />
have someone else appointed) as a proxy for the Meeting. If a<br />
Nominated Person has no such proxy appointment right or does<br />
not wish to exercise it, he/she may, under any such agreement,<br />
have a right to give instructions to the shareholder as to the<br />
exercise of voting rights.<br />
12. The statement of the rights of members in relation to the<br />
appointment of proxies in paragraphs 1 to 6 above does not apply<br />
to a Nominated Person. The rights described in these paragraphs<br />
can only be exercised by registered members of the Company.<br />
13. Any corporation which is a member can appoint one or more<br />
corporate representatives who may exercise on its behalf all of<br />
the same powers as the corporation could exercise if it were an<br />
individual member.<br />
14. Under section 527 of the Companies Act 2006 members<br />
meeting the threshold requirements set out in that section<br />
have the right to require the company to publish on a website<br />
a statement setting out any matter relating to: (i) the audit of<br />
the Company’s accounts (including the auditor’s report <strong>and</strong> the<br />
conduct of the audit) that are to be laid before the meeting; or (ii)<br />
any circumstance connected with an auditor of the Company<br />
ceasing to hold office since the previous meeting at which annual<br />
accounts <strong>and</strong> reports were laid in accordance with section 437<br />
of the Companies Act 2006. The Company may not require the<br />
shareholders requesting any such website publication to pay its<br />
expenses in complying with sections 527 or 528 of the Companies<br />
Act 2006. Where the Company is required to place a statement on<br />
a website under section 527 of the Companies Act 2006, it must<br />
forward the statement to the Company’s auditor not later than the<br />
time when it makes the statement available on the website. The<br />
business which may be dealt with at the meeting includes any<br />
statement that the Company has been required under section 527<br />
of the Companies Act 2006 to publish on a website.<br />
15. Under section 338 <strong>and</strong> section 338A of the Companies Act 2006,<br />
members meeting the threshold requirements in those sections<br />
have the right to require the company (i) to give, to members of<br />
the company entitled to receive notice of the meeting, notice of<br />
a resolution which may properly be moved <strong>and</strong> is intended to<br />
be moved at the meeting <strong>and</strong>/or (ii) to include in the business to<br />
be dealt with at the meeting any matter (other than a proposed<br />
resolution) which may be properly included in the business. A<br />
resolution may properly be moved or a matter may properly be<br />
included in the business unless (a) (in the case of a resolution<br />
only) it would, if passed, be ineffective (whether by reason of<br />
inconsistency with any enactment or the company’s constitution<br />
or otherwise), (b) it is defamatory of any person, or (c) it is<br />
frivolous or vexatious. Such a request may be in hard copy form or<br />
in electronic form, must identify the resolution of which notice is<br />
to be given or the matter to be included in the business, must be<br />
authorised by the person or persons making it, must be received<br />
by the company not later than 10 April 2013, being the date six<br />
clear weeks before the meeting, <strong>and</strong> (in the case of a matter to<br />
be included in the business only) must be accompanied by a<br />
statement setting out the grounds for the request.<br />
16. Shareholders <strong>and</strong> their proxies will have the opportunity to ask<br />
questions at the Meeting. When invited by the Chairman, if you<br />
wish to ask a question, please wait for a Company representative<br />
to bring you a microphone. It would be helpful if you could<br />
state your name before you ask your question. Questions may<br />
not be answered at the Meeting if they are deemed not to be in<br />
the interests of the Company, or the good order of the Meeting,<br />
would interfere unduly with the preparation for the Meeting or<br />
involve the disclosure of confidential information, or if the answer<br />
has already been given on a website. The Chairman may also<br />
nominate a Company representative to answer a specific question<br />
after the Meeting or refer the response to the Company’s website.<br />
17. A copy of this Notice, <strong>and</strong> other information required by section<br />
311A of the Companies Act 2006, can be found in the Investor<br />
Centre at www.travisperkinsplc.com.<br />
SHAREHOLDER<br />
INFORMATION<br />
135
Directions to the <strong>Annual</strong> General Meeting<br />
The Travis Perkins <strong>Annual</strong> General Meeting is to be held in<br />
The Captains Lounge <strong>and</strong> The Rodber Suite,<br />
Northampton Rugby Football Club,<br />
Franklin’s Gardens,<br />
Weedon Road,<br />
Northampton NN5 5BG.<br />
Parking is directly outside in the VIP Car Park (follow VIP Car Park<br />
signs off Weedon Road).<br />
DUSTON ROAD<br />
WEEDON ROAD<br />
A4500<br />
BEACON BINGO<br />
A428<br />
SPENCER BRIDGE ROAD A4500<br />
TOLLGATE WAY<br />
ST JA M E S ROA D<br />
TO M1<br />
JUNCTION 16<br />
WEEDON ROAD A45<br />
CINEWORLD<br />
NORTHAMPTON<br />
RUGBY FOOTBALL<br />
CLUB<br />
VIP CAR PARK<br />
A428<br />
RAILWAY STATION<br />
UPTON WAY A45<br />
BP<br />
SIXFIELDS<br />
NORTHAMPTON<br />
TOWN FOOTBALL CLUB<br />
TGI FRIDAYS<br />
TO NORTHAMPTON<br />
TOWN CENTRE<br />
TO M1<br />
JUNCTION 15A<br />
Directions<br />
From the south (via the M1)<br />
Exit off motorway at junction 15A <strong>and</strong> follow the signs towards<br />
Sixfields. At roundabout with TGI Fridays on the right <strong>and</strong> a BP<br />
petrol station on the left carry straight on up the hill. At Cineworld<br />
roundabout turn right towards the Town Centre. Go straight over<br />
the next two roundabouts (Sainsbury’s is on the left before the first<br />
roundabout <strong>and</strong> Wickes on the right after the second roundabout)<br />
<strong>and</strong> set of traffic lights. Continue on that road (Weedon Road). The<br />
entrance to the Saints is on the right immediately after Beacon Bingo.<br />
Follow signs for VIP car park off Weedon Road.<br />
From the north (via the M1)<br />
Exit off motorway at junction 16 <strong>and</strong> follow the A45 to Northampton.<br />
At Cineworld roundabout continue straight on <strong>and</strong> follow directions<br />
from the South.<br />
From the east, Peterborough, Cambridge, Wellingborough<br />
Follow A45 to M1 junction 15. Head north to junction 15A then follow<br />
directions from the South.<br />
From Welford, Market Harborough<br />
Aim towards the Kingsthorpe area of Northampton. Turn right at the<br />
major set of traffic lights (the Cock Hotel is on the corner), signposted<br />
Sixfields. Continue on this road until you get to Cineworld roundabout<br />
(approx 3 miles). Turn left at the Cineworld roundabout then continue<br />
as from the South.<br />
From the railway station<br />
Turn right out of the station. Continue past Thomas A Becket pub,<br />
Church <strong>and</strong> Co. factory <strong>and</strong> bus station. At fork in road bear left <strong>and</strong><br />
Franklin’s Gardens is on your left. The walk takes approx 15 minutes.<br />
Nearest airports<br />
London Luton <strong>and</strong> Nottingham East Midl<strong>and</strong>s.<br />
Further information<br />
For detailed directions you might want to try the following websites:<br />
Multimap (www.multimap.com);<br />
The AA (www.theaa.com);<br />
The RAC (www.rac.co.uk).<br />
For further details about the venue:<br />
www.northamptonsaints.co.uk<br />
136
TRAVIS PERKINS ANNUAL REPORT AND ACCOUNTS 2012<br />
Other Shareholder Information<br />
Shareholder enquiries<br />
Shareholder enquiries should be directed to the Company Secretary<br />
at the Company’s registered office:<br />
Travis Perkins plc<br />
Lodge Way House, Lodge Way, Harlestone Road,<br />
Northampton NN5 7UG<br />
Telephone 01604 752424<br />
Email cosec@travisperkins.co.uk<br />
or to the Company’s registrars:<br />
Capita Registrars<br />
The Registry, 34 Beckenham Road, Beckenham, Kent, BR3 4TU<br />
Telephone 0871 664 0300<br />
(calls cost 10p per minute plus network extras; lines are open 8.30am<br />
to 5.30pm, Monday – Friday)<br />
Email ssd@capitaregistrars.com<br />
Should your query relate to a pensions matter please email<br />
pensions@travisperkins.co.uk or if your query relates to a marketing<br />
matter please email marketing@travisperkins.co.uk.<br />
Financial diary<br />
Ex-dividend date 1 May 2013<br />
Record date 3 May 2013<br />
<strong>Annual</strong> General Meeting 23 May 2013<br />
Payment of final dividend 30 May 2013<br />
Announcement of 2013 interim results July 2013<br />
Announcement of 2013 annual results February 2014<br />
<strong>Annual</strong> general meeting – catering arrangements<br />
It has always been the Company’s custom to provide a light luncheon<br />
for shareholders following the AGM, <strong>and</strong> a buffet luncheon will be<br />
available (you need not notify the Company in advance if you would<br />
like lunch).<br />
www.dhsspares.co.uk<br />
www.fponlineordering.co.uk<br />
www.fpwholesale.co.uk<br />
www.fressshbathrooms.co.uk<br />
www.havelockcontrols.co.uk<br />
http://hire.travisperkins.co.uk/hire *<br />
www.iflo.co.uk<br />
www.insulationgiant.co.uk<br />
www.keyline.co.uk *<br />
http://hire.keyline.co.uk/hire/ *<br />
www.mispares.com<br />
www.pro-heat.co.uk<br />
www.ptsonlineordering.co.uk<br />
www.ptsplumbing.co.uk<br />
www.ptsrenewables.co.uk<br />
www.scruffs.com<br />
www.selfbuildgroup.co.uk<br />
www.southern-darwent.co.uk<br />
www.sustainablebuildingsolutions.co.uk<br />
www.thedoorscollections.co.uk<br />
www.tilegiant.co.uk *<br />
www.tilehq.co.uk<br />
www.tilemagic.co.uk<br />
www.timberdirect.co.uk<br />
www.toolstation.co.uk *<br />
www.tpcareers.co.uk<br />
www.tpmanagedservices.co.uk<br />
www.trademate.co.uk *<br />
www.travisperkins.co.uk *<br />
www.travisperkinsplc.com (investor relations site)<br />
www.vanvault.co.uk<br />
www.wickes.co.uk *<br />
www.wickescareers.co.uk<br />
www.wickeskitchens.co.uk<br />
Internet<br />
There are sites on the internet that carry a range of information<br />
about the Group <strong>and</strong> its principal br<strong>and</strong>s, products <strong>and</strong> services at the<br />
following addresses:<br />
www.ccfltd.co.uk *<br />
www.4tradeproducts.co.uk<br />
www.benchmarxkitchens.co.uk<br />
www.benchmarxshowroom.co.uk (end user site)<br />
www.birchwoodpricetools.com<br />
www.bmpublicsector.co.uk<br />
www.bssindustrial.co.uk<br />
www.buytiles.co.uk<br />
www.cityheatingspares.co.uk<br />
www.cityplumbing.co.uk *<br />
www.connectionsaml.co.uk<br />
www.defenderpower.com<br />
*<br />
These sites allow credit account holders to order on-line through<br />
Trademate, with the exception of the Wickes, Tile Giant <strong>and</strong> ToolStation<br />
sites which allow on-line ordering by secure card transaction.<br />
Most of the sites provide information about branch locations <strong>and</strong><br />
allow access to prices <strong>and</strong> the product range available. Customers are<br />
also able to construct their own price quotation that includes any<br />
special price arrangements that have been negotiated with the Group.<br />
Electronic communication<br />
In accordance with the Companies Act 2006 <strong>and</strong> the Company’s<br />
Articles of Association, the Company is allowed to use its website to<br />
publish statutory documents <strong>and</strong> communications to shareholders,<br />
such as the <strong>Annual</strong> <strong>Report</strong> <strong>and</strong> <strong>Accounts</strong> <strong>and</strong> the Notice of the AGM.<br />
You can therefore view or download a copy of the <strong>Annual</strong> <strong>Report</strong> <strong>and</strong><br />
<strong>Accounts</strong> <strong>and</strong> the Notice of the AGM by going to our website at<br />
www.travisperkinsplc.com (see section called ‘Investor Centre’). If you<br />
SHAREHOLDER<br />
INFORMATION<br />
137
Other Shareholder Information<br />
received a hard copy of this report in the post then you will not have<br />
consented to this method of publication. Should you now wish to<br />
consent to this method of publication, you should contact<br />
Capita Registrars, Freepost RLYX-GZTU-KRRG, SAS,<br />
The Registry, 34 Beckenham Road, Beckenham, BR3 9ZA.<br />
By reducing the number of communications sent by post, it will not<br />
only result in cost savings to the Company but also reduce the impact<br />
that the unnecessary printing <strong>and</strong> distribution of reports has on the<br />
environment. Please note that if you consent to website publication,<br />
you will continue to be notified each time that the Company places<br />
a statutory communication on the website. This notification will<br />
be sent to you by post. However, you may also choose to receive<br />
notifications by e-mail <strong>and</strong> we would encourage you to do so. If you<br />
wish to receive these notifications by e-mail, you should register<br />
at www.capitashareportal.com, <strong>and</strong> follow the instructions (see<br />
Registrar’s On-Line Service below).<br />
Please telephone Capita Registrars on 0871 664 0300 (within the<br />
UK), calls cost 10p per minute plus network extras; lines are open<br />
9.00am to 5.30pm, Monday - Friday or +44 20 8639 3399 (Non-UK) if<br />
you have any queries.<br />
Notes<br />
1. Before consenting to receive documents <strong>and</strong> communications via<br />
the website, shareholders should ensure that they have a computer<br />
with internet access <strong>and</strong> the Adobe Acrobat reader facility. The<br />
Adobe Acrobat reader software may be obtained via the website<br />
free of charge.<br />
2. If you elect to receive notifications of the publication of the<br />
documents <strong>and</strong> communications on the website electronically, it<br />
will be your responsibility to notify our registrars, Capita, of any<br />
subsequent change in your e-mail address or other contact details.<br />
3. If you are not resident in the United Kingdom, it is your<br />
responsibility to ensure that you may validly receive documents<br />
<strong>and</strong> communications electronically (either generally or in relation<br />
to any particular document or communication) without the<br />
Company being required to comply with any governmental or<br />
regulatory procedures or any similar formalities. The Company<br />
may deny electronic access to documents <strong>and</strong> communications<br />
relating to certain corporate actions in respect of those<br />
shareholders who it believes are resident in jurisdictions where it<br />
is advised that to provide such access would or may be a breach of<br />
any legal or regulatory requirements.<br />
4. The Company’s obligation to provide shareholder documents<br />
to you is satisfied when it transmits an electronic message. The<br />
Company is not responsible for any failure in transmission for<br />
reasons beyond its control any more than it is for postal failures.<br />
In the event of the Company becoming aware that an electronic<br />
communication to you has not been successfully transmitted,<br />
a further two attempts will be made. If the transmission is still<br />
unsuccessful, a hard copy of the relevant notification will be posted<br />
to your registered address.<br />
5. Your registration to receive electronic communications <strong>and</strong> your<br />
relevant contact address details will st<strong>and</strong> until such time as the<br />
Company receives alternative instructions from you by e-mail or in<br />
writing.<br />
6. The Company takes all reasonable precautions to ensure no<br />
computer viruses are present in any electronic communication<br />
it transmits, but the Company shall not be responsible for any<br />
loss or damage arising from the opening or use of any e-mail or<br />
attachments sent by the Company or on its behalf. The Company<br />
recommends that shareholders subject all messages to computer<br />
virus checking procedures. Any electronic communication received<br />
by or on behalf of the Company, including the lodgement of an<br />
electronic proxy form that is found to contain any computer virus<br />
will not be accepted.<br />
7. The Company reserves the right, irrespective of your election, to<br />
revert to sending hard copy documentation by post whenever it<br />
considers it necessary or desirable to do so.<br />
Capita registrars<br />
The Company’s registrars, Capita Registrars (‘Capita’), provide a<br />
number of services that, as a shareholder, might be useful to you;-<br />
Registrar’s on-line service<br />
By logging onto www.capitashareportal.com <strong>and</strong> following the<br />
prompts, shareholders can view <strong>and</strong> amend various details on their<br />
account. Please note that you will need to register to use this service<br />
for which purpose you will require your unique investor code (IVC),<br />
which can be found on your share certificate, proxy card or dividend<br />
tax voucher.<br />
Dividend re-investment plan (‘DRIP’)<br />
This is a scheme which allows you to use your dividends to buy<br />
further shares in Travis Perkins. For any shareholders who wish to<br />
re-invest dividend payments in the Company, a facility is provided by<br />
Capita <strong>IR</strong>G Trustees Ltd in conjunction with Capita Registrars. Under<br />
this facility, cash dividends are used to purchase additional shares.<br />
Shares are bought on the dividend payment date at the then current<br />
market price. Any cash left over which is insufficient to purchase<br />
a whole share will be carried forward <strong>and</strong> held without interest, in<br />
a Client Money bank account. Any shareholder requiring further<br />
information should contact Capita on 0871 664 0381 (Calls cost 10p<br />
per minute plus any network extras from within the UK); lines are<br />
138
TRAVIS PERKINS ANNUAL REPORT AND ACCOUNTS 2012<br />
open from 9.00 am to 5.30 pm Monday – Friday. If Non-UK +44 208<br />
639 3399. Fax 0208 639 1023. E-mail shares@capitaregistrars.com or<br />
visit www.capitaregistrars.com. Please note that this facility is only<br />
available to shareholders with an address in the UK or EEA.<br />
Duplicate share register accounts<br />
If you are receiving more than one copy of our report, it may be that<br />
your shares are registered in two or more accounts on our register of<br />
members. If that was not your intention you might consider merging<br />
them into one single entry. Please contact Capita who will be pleased<br />
to carry out your instructions.<br />
Overseas shareholders<br />
Capita, in conjunction with Western Union, are able to provide you<br />
with a service that will convert your sterling dividends into your local<br />
currency at a competitive rate. You can choose to receive payment<br />
directly into your bank account, or you can be sent a draft in your<br />
local currency. Further details are available from<br />
Capita Registrars,<br />
Freepost RLYX-GZTU-KRRG, SAS, The Registry,<br />
34 Beckenham Road, Beckenham, Kent BR3 9ZA<br />
Telephone UK: 0871 664 0385<br />
(Calls cost 10 pence per minute plus network extras; lines are open to<br />
9.00am to 5.30pm, Monday - Friday) or +44 208 639 3405 (Non UK) or<br />
by logging on to www.international.capitaregistrars.com<br />
Share dealing services<br />
There are two share dealing services that you may wish to use to buy<br />
or sell shares in Travis Perkins.<br />
Capita<br />
Capita offers an on-line <strong>and</strong> telephone share dealing service which<br />
is available by logging on to www.capitadeal.com or telephoning<br />
0871 664 0346 (calls cost 10p per minute plus network extras;<br />
lines are open 8.00am to 4.30pm, Monday – Friday). For the on-line<br />
service, Capita’s commission rates are 1% of the value of the deal<br />
(minimum £20, maximum £75) <strong>and</strong> for the telephone service, Capita’s<br />
commission rates are 1.50% of the value of the deal (minimum £25,<br />
maximum £102.50).<br />
Stocktrade<br />
Stocktrade offer a telephone share dealing service which is available<br />
by telephoning 0845 6010 995 (non-UK +44 131 240 0414) <strong>and</strong><br />
quoting reference ‘Low cost 335’. Stocktrade’s commission will be<br />
0.5%, to deals up to the value of £10,000 <strong>and</strong> 0.2% on the excess<br />
thereafter, subject to minimum of £17.50. Please note that UK share<br />
purchases will be subject to 0.5% stamp duty. There will also be a<br />
PTM (‘Panel for Takeovers <strong>and</strong> Mergers’) levy of £1 for single trades in<br />
excess of £10,000. When buying shares you will be required to pay for<br />
your transaction at the time of the deal by debit card, <strong>and</strong> you should<br />
ensure that you have sufficient cleared funds available in your debit<br />
card account to pay for the shares in full.<br />
SHAREHOLDER<br />
INFORMATION<br />
139
140<br />
Shareholder Notes
Printed on:<br />
Revive 50 White Silk: a paper containing 50% recycled fibre <strong>and</strong> 50% virgin fibre sourced from well-managed, responsible, FSC®<br />
certified forests. The pulp used in this product is bleached using an Elemental Chlorine Free (ECF) process.<br />
Revive 100 Offset: a paper containing 100% post consumer recycled fibre certified by the FSC®. The pulp used in this product is<br />
bleached using a totally chlorine free (TCF) process.<br />
100% of the inks used are vegetable oil based, 95% of press chemicals are recycled for further use <strong>and</strong>,<br />
on average 99% of any waste associated with this production will be recycled.<br />
Designed by RWH Design Consultants, Photography by Charles Ward<br />
Printed by Jones <strong>and</strong> Palmer
TRAVIS PERKINS PLC<br />
Travis Perkins plc · Lodge Way House · Harlestone Road · Northampton NN5 7UG · Telephone 01604 752 424<br />
www.travisperkinsplc.com