Interim Statistics of 2008/09 Applicants - UBC Blogs
Interim Statistics of 2008/09 Applicants - UBC Blogs
Interim Statistics of 2008/09 Applicants - UBC Blogs

You also want an ePaper? Increase the reach of your titles
YUMPU automatically turns print PDFs into web optimized ePapers that Google loves.
<strong>UBC</strong> Faculty <strong>of</strong> Medicine, Dean's <strong>of</strong>fice<br />
Admissions MD Undergraduate<br />
Vancouver, BC, Canada<br />
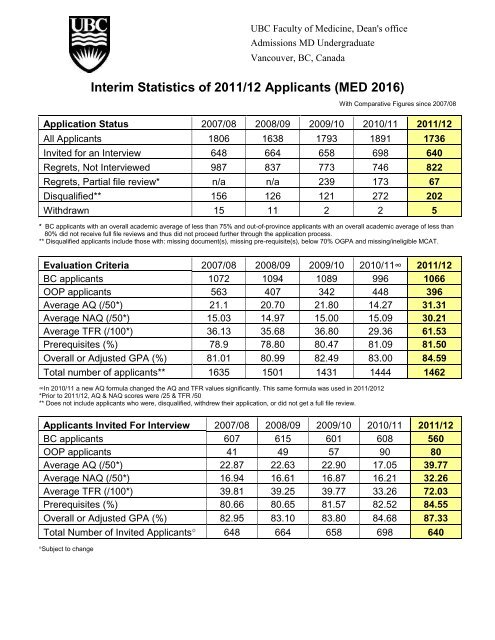
<strong>Interim</strong> <strong>Statistics</strong> <strong>of</strong> 2011/12 <strong>Applicants</strong> (MED 2016)<br />
With Comparative Figures since 2007/08<br />
Application Status 2007/08 <strong>2008</strong>/<strong>09</strong> 20<strong>09</strong>/10 2010/11 2011/12<br />
All <strong>Applicants</strong> 1806 1638 1793 1891 1736<br />
Invited for an Interview 648 664 658 698 640<br />
Regrets, Not Interviewed 987 837 773 746 822<br />
Regrets, Partial file review* n/a n/a 239 173 67<br />
Disqualified** 156 126 121 272 202<br />
Withdrawn 15 11 2 2 5<br />
* BC applicants with an overall academic average <strong>of</strong> less than 75% and out-<strong>of</strong>-province applicants with an overall academic average <strong>of</strong> less than<br />
80% did not receive full file reviews and thus did not proceed further through the application process.<br />
** Disqualified applicants include those with: missing document(s), missing pre-requisite(s), below 70% OGPA and missing/ineligible MCAT.<br />
Evaluation Criteria 2007/08 <strong>2008</strong>/<strong>09</strong> 20<strong>09</strong>/10 2010/11∞ 2011/12<br />
BC applicants 1072 1<strong>09</strong>4 1089 996 1066<br />
OOP applicants 563 407 342 448 396<br />
Average AQ (/50*) 21.1 20.70 21.80 14.27 31.31<br />
Average NAQ (/50*) 15.03 14.97 15.00 15.<strong>09</strong> 30.21<br />
Average TFR (/100*) 36.13 35.68 36.80 29.36 61.53<br />
Prerequisites (%) 78.9 78.80 80.47 81.<strong>09</strong> 81.50<br />
Overall or Adjusted GPA (%) 81.01 80.99 82.49 83.00 84.59<br />
Total number <strong>of</strong> applicants** 1635 1501 1431 1444 1462<br />
∞In 2010/11 a new AQ formula changed the AQ and TFR values significantly. This same formula was used in 2011/2012<br />
*Prior to 2011/12, AQ & NAQ scores were /25 & TFR /50<br />
** Does not include applicants who were, disqualified, withdrew their application, or did not get a full file review.<br />
<strong>Applicants</strong> Invited For Interview 2007/08 <strong>2008</strong>/<strong>09</strong> 20<strong>09</strong>/10 2010/11 2011/12<br />
BC applicants 607 615 601 608 560<br />
OOP applicants 41 49 57 90 80<br />
Average AQ (/50*) 22.87 22.63 22.90 17.05 39.77<br />
Average NAQ (/50*) 16.94 16.61 16.87 16.21 32.26<br />
Average TFR (/100*) 39.81 39.25 39.77 33.26 72.03<br />
Prerequisites (%) 80.66 80.65 81.57 82.52 84.55<br />
Overall or Adjusted GPA (%) 82.95 83.10 83.80 84.68 87.33<br />
Total Number <strong>of</strong> Invited <strong>Applicants</strong> 648 664 658 698 640<br />
Subject to change
<strong>Interim</strong> <strong>Statistics</strong> <strong>of</strong> 2011/12 Interview Candidates (MED 2016)<br />
Qualified applicants received an academic file review which included: review <strong>of</strong> prerequisites,<br />
calculation <strong>of</strong> the overall average (OGPA), derived from all university-level transferrable courses<br />
and the removal, when applicable, <strong>of</strong> the worst academic year to give an adjusted academic<br />
average (AGPA). An academic score (AQ) out <strong>of</strong> 50 was generated from either the OGPA or a<br />
valid AGPA score. For this cycle, new grade conversion tables were used to convert letter grades<br />
to a percentage. There was no change from the previous cycle to the system for allocating points<br />
to determine academic scores.<br />
The non-academic file review (NAQ) score, also out <strong>of</strong> 50, was derived from an evaluation <strong>of</strong> the<br />
extra-curricular activities (including awards, research and publications, where applicable) and<br />
employment history listed by applicants.<br />
The results <strong>of</strong> the academic and non-academic file review were combined to generate a preinterview<br />
total file review (TFR) score out <strong>of</strong> 100.<br />
British Columbia <strong>Applicants</strong> (BC)<br />
File reviews were completed for 1066 applicants who were identified as BC residents. A total <strong>of</strong><br />
560 BC residents who achieved a total file review score <strong>of</strong> 60.49/100 or more were invited to<br />
interview.<br />
Out-<strong>of</strong>-Province <strong>Applicants</strong> (OOP)<br />
Academic and non-academic file reviews were completed for 396 out-<strong>of</strong>-province applicants. A<br />
total <strong>of</strong> 80 OOP candidates who achieved a total file review score <strong>of</strong> 76.75/100 or more were<br />
invited to interview.<br />
Interview candidates – MED 2016<br />
Interview Candidates BC OOP<br />
Number <strong>of</strong> <strong>Applicants</strong> 560 80<br />
Average AQ (/50) 38.50 48.24<br />
Average NAQ (/50) 32.20 32.58<br />
Average TFR (/100) 70.71 80.83<br />
Prerequisites Average (%) 83.76 89.56<br />
Overall or Adjusted GPA (%) 86.82 90.68