MAT 167: Statistics Midterm Exam Instructor: Anthony Tanbakuchi ...
MAT 167: Statistics Midterm Exam Instructor: Anthony Tanbakuchi ...
MAT 167: Statistics Midterm Exam Instructor: Anthony Tanbakuchi ...

You also want an ePaper? Increase the reach of your titles
YUMPU automatically turns print PDFs into web optimized ePapers that Google loves.
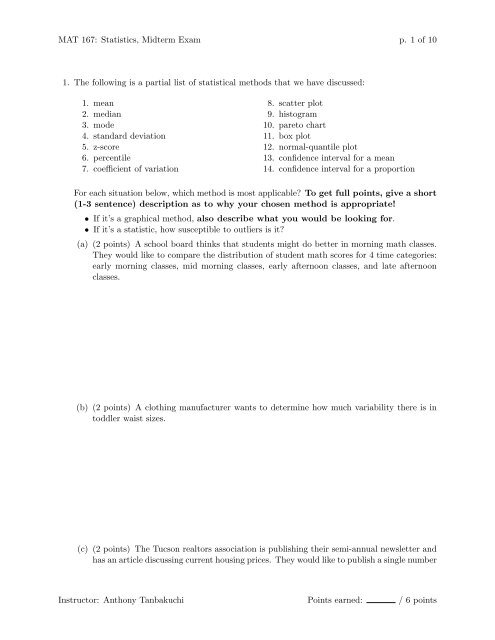
<strong>MAT</strong> <strong>167</strong>: <strong>Statistics</strong>, <strong>Midterm</strong> <strong>Exam</strong> p. 1 of 10<br />
1. The following is a partial list of statistical methods that we have discussed:<br />
1. mean<br />
2. median<br />
3. mode<br />
4. standard deviation<br />
5. z-score<br />
6. percentile<br />
7. coefficient of variation<br />
8. scatter plot<br />
9. histogram<br />
10. pareto chart<br />
11. box plot<br />
12. normal-quantile plot<br />
13. confidence interval for a mean<br />
14. confidence interval for a proportion<br />
For each situation below, which method is most applicable To get full points, give a short<br />
(1-3 sentence) description as to why your chosen method is appropriate!<br />
• If it’s a graphical method, also describe what you would be looking for.<br />
• If it’s a statistic, how susceptible to outliers is it<br />
(a) (2 points) A school board thinks that students might do better in morning math classes.<br />
They would like to compare the distribution of student math scores for 4 time categories:<br />
early morning classes, mid morning classes, early afternoon classes, and late afternoon<br />
classes.<br />
(b) (2 points) A clothing manufacturer wants to determine how much variability there is in<br />
toddler waist sizes.<br />
(c) (2 points) The Tucson realtors association is publishing their semi-annual newsletter and<br />
has an article discussing current housing prices. They would like to publish a single number<br />
<strong>Instructor</strong>: <strong>Anthony</strong> <strong>Tanbakuchi</strong> Points earned: / 6 points