study
study
study

Create successful ePaper yourself
Turn your PDF publications into a flip-book with our unique Google optimized e-Paper software.
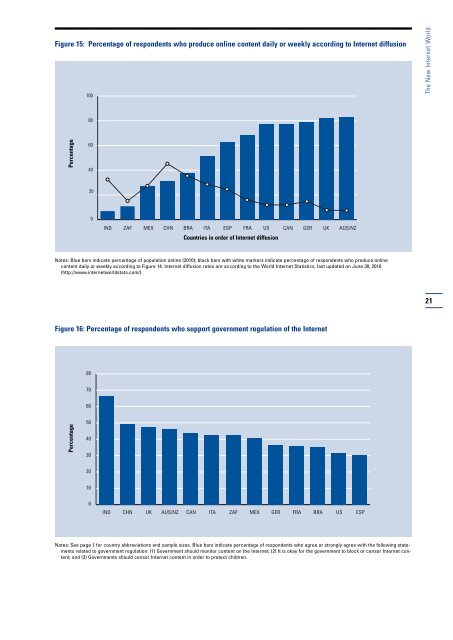
Figure 15: Percentage of respondents who produce online content daily or weekly according to Internet diffusion<br />
100<br />
The New Internet World<br />
80<br />
Percentage<br />
60<br />
40<br />
20<br />
0<br />
IND<br />
ZAF<br />
MEX<br />
CHN<br />
BRA<br />
ITA<br />
ESP<br />
FRA<br />
US<br />
CAN<br />
GER<br />
UK<br />
AUS/NZ<br />
Countries in order of Internet diffusion<br />
Notes: Blue bars indicate percentage of population online (2010); black bars with white markers indicate percentage of respondents who produce online<br />
content daily or weekly according to Figure 14. Internet diffusion rates are according to the World Internet Statistics, last updated on June 30, 2010<br />
(http://www.internetworldstats.com/).<br />
21<br />
Figure 16: Percentage of respondents who support government regulation of the Internet<br />
80<br />
70<br />
60<br />
Percentage<br />
50<br />
40<br />
30<br />
20<br />
10<br />
0<br />
IND<br />
CHN<br />
UK<br />
AUS/NZ<br />
CAN<br />
ITA<br />
ZAF<br />
MEX<br />
GER<br />
FRA<br />
BRA<br />
US<br />
ESP<br />
Notes: See page 1 for country abbreviations and sample sizes. Blue bars indicate percentage of respondents who agree or strongly agree with the following statements<br />
related to government regulation: (1) Government should monitor content on the Internet; (2) It is okay for the government to block or censor Internet content;<br />
and (3) Governments should censor Internet content in order to protect children.