DataPrism: a tool for visualizing multimodal data - DCog-HCI Lab ...
DataPrism: a tool for visualizing multimodal data - DCog-HCI Lab ...
DataPrism: a tool for visualizing multimodal data - DCog-HCI Lab ...

Create successful ePaper yourself
Turn your PDF publications into a flip-book with our unique Google optimized e-Paper software.
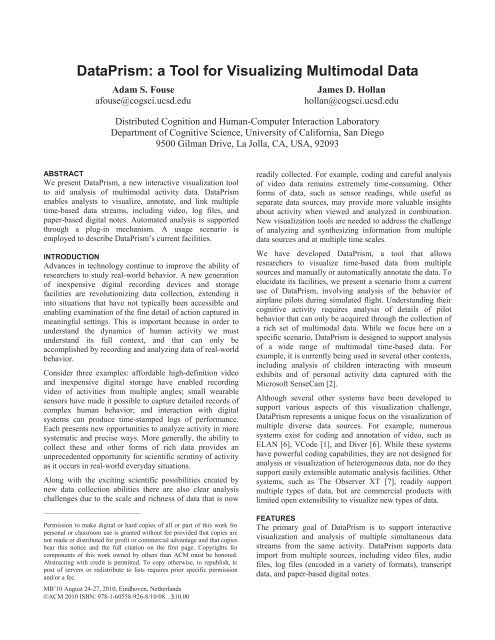
<strong>DataPrism</strong>: a Tool <strong>for</strong> Visualizing Multimodal Data<br />
Adam S. Fouse<br />
afouse@cogsci.ucsd.edu<br />
James D. Hollan<br />
hollan@cogsci.ucsd.edu<br />
Distributed Cognition and Human-Computer Interaction <strong>Lab</strong>oratory<br />
Department of Cognitive Science, University of Cali<strong>for</strong>nia, San Diego<br />
9500 Gilman Drive, La Jolla, CA, USA, 92093<br />
ABSTRACT<br />
We present <strong>DataPrism</strong>, a new interactive visualization <strong>tool</strong><br />
to aid analysis of <strong>multimodal</strong> activity <strong>data</strong>. <strong>DataPrism</strong><br />
enables analysts to visualize, annotate, and link multiple<br />
time-based <strong>data</strong> streams, including video, log files, and<br />
paper-based digital notes. Automated analysis is supported<br />
through a plug-in mechanism. A usage scenario is<br />
employed to describe <strong>DataPrism</strong>’s current facilities.<br />
INTRODUCTION<br />
Advances in technology continue to improve the ability of<br />
researchers to study real-world behavior. A new generation<br />
of inexpensive digital recording devices and storage<br />
facilities are revolutionizing <strong>data</strong> collection, extending it<br />
into situations that have not typically been accessible and<br />
enabling examination of the fine detail of action captured in<br />
meaningful settings. This is important because in order to<br />
understand the dynamics of human activity we must<br />
understand its full context, and that can only be<br />
accomplished by recording and analyzing <strong>data</strong> of real-world<br />
behavior.<br />
Consider three examples: af<strong>for</strong>dable high-definition video<br />
and inexpensive digital storage have enabled recording<br />
video of activities from multiple angles; small wearable<br />
sensors have made it possible to capture detailed records of<br />
complex human behavior; and interaction with digital<br />
systems can produce time-stamped logs of per<strong>for</strong>mance.<br />
Each presents new opportunities to analyze activity in more<br />
systematic and precise ways. More generally, the ability to<br />
collect these and other <strong>for</strong>ms of rich <strong>data</strong> provides an<br />
unprecedented opportunity <strong>for</strong> scientific scrutiny of activity<br />
as it occurs in real-world everyday situations.<br />
Along with the exciting scientific possibilities created by<br />
new <strong>data</strong> collection abilities there are also clear analysis<br />
challenges due to the scale and richness of <strong>data</strong> that is now<br />
______________________________<br />
Permission to make digital or hard copies of all or part of this work <strong>for</strong><br />
personal or classroom use is granted without fee provided that copies are<br />
not made or distributed <strong>for</strong> profit or commercial advantage and that copies<br />
bear this notice and the full citation on the first page. Copyrights <strong>for</strong><br />
components of this work owned by others than ACM must be honored.<br />
Abstracting with credit is permitted. To copy otherwise, to republish, to<br />
post of servers or redistribute to lists requires prior specific permission<br />
and/or a fee.<br />
MB’10 August 24-27, 2010, Eindhoven, Netherlands<br />
©ACM 2010 ISBN: 978-1-60558-926-8/10/08…$10.00<br />
readily collected. For example, coding and careful analysis<br />
of video <strong>data</strong> remains extremely time-consuming. Other<br />
<strong>for</strong>ms of <strong>data</strong>, such as sensor readings, while useful as<br />
separate <strong>data</strong> sources, may provide more valuable insights<br />
about activity when viewed and analyzed in combination.<br />
New visualization <strong>tool</strong>s are needed to address the challenge<br />
of analyzing and synthesizing in<strong>for</strong>mation from multiple<br />
<strong>data</strong> sources and at multiple time scales.<br />
We have developed <strong>DataPrism</strong>, a <strong>tool</strong> that allows<br />
researchers to visualize time-based <strong>data</strong> from multiple<br />
sources and manually or automatically annotate the <strong>data</strong>. To<br />
elucidate its facilities, we present a scenario from a current<br />
use of <strong>DataPrism</strong>, involving analysis of the behavior of<br />
airplane pilots during simulated flight. Understanding their<br />
cognitive activity requires analysis of details of pilot<br />
behavior that can only be acquired through the collection of<br />
a rich set of <strong>multimodal</strong> <strong>data</strong>. While we focus here on a<br />
specific scenario, <strong>DataPrism</strong> is designed to support analysis<br />
of a wide range of <strong>multimodal</strong> time-based <strong>data</strong>. For<br />
example, it is currently being used in several other contexts,<br />
including analysis of children interacting with museum<br />
exhibits and of personal activity <strong>data</strong> captured with the<br />
Microsoft SenseCam [2].<br />
Although several other systems have been developed to<br />
support various aspects of this visualization challenge,<br />
<strong>DataPrism</strong> represents a unique focus on the visualization of<br />
multiple diverse <strong>data</strong> sources. For example, numerous<br />
systems exist <strong>for</strong> coding and annotation of video, such as<br />
ELAN [6], VCode [1], and Diver [6]. While these systems<br />
have powerful coding capabilities, they are not designed <strong>for</strong><br />
analysis or visualization of heterogeneous <strong>data</strong>, nor do they<br />
support easily extensible automatic analysis facilities. Other<br />
systems, such as The Observer XT [7], readily support<br />
multiple types of <strong>data</strong>, but are commercial products with<br />
limited open extensibility to visualize new types of <strong>data</strong>.<br />
FEATURES<br />
The primary goal of <strong>DataPrism</strong> is to support interactive<br />
visualization and analysis of multiple simultaneous <strong>data</strong><br />
streams from the same activity. <strong>DataPrism</strong> supports <strong>data</strong><br />
import from multiple sources, including video files, audio<br />
files, log files (encoded in a variety of <strong>for</strong>mats), transcript<br />
<strong>data</strong>, and paper-based digital notes.
Visualization<br />
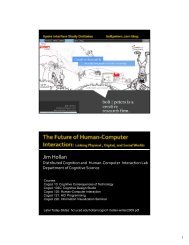
The main <strong>DataPrism</strong> interface consists of a video player and<br />
one or more timelines arrayed below the video, as shown in<br />
Figure 1. A single timeline is shown by default, but<br />
multiple timelines can be added to visualize additional <strong>data</strong>,<br />
group annotations, or view different time scales. Each<br />
timeline has a visual marker (a vertical yellow bar toward<br />
the right on each of the timelines in Figure 1) to indicate the<br />
current position in the <strong>data</strong>, which is aligned with the<br />
current video location. This marker allows the researcher to<br />
relate a notable moment in one <strong>data</strong> stream to<br />
corresponding points in other <strong>data</strong> sets.<br />
Video files can be viewed as with a typical video viewer.<br />
The viewer displays the current frame of the video as a<br />
researcher moves through the <strong>data</strong> and allows the video to<br />
be played at varying rates. In addition, frames from the<br />
video can be viewed on the timeline below the main video<br />
viewer. Frames from the video can also be associated with<br />
annotations and displayed in a pop-up window that appears<br />
when the researcher hovers the cursor over the annotations.<br />
If the video file has an audio track, a wave<strong>for</strong>m of the audio<br />
can be shown on a timeline. Multiple video files can be<br />
shown in separate windows or on separate timelines.<br />
Log file <strong>data</strong> can currently be shown in two ways: time<br />
series graphs and map depictions of geographic position.<br />
Time series graphs are displayed on timelines in the main<br />
<strong>DataPrism</strong> window, along with dynamic scales based on the<br />
current visible <strong>data</strong>. Geographic positions can be shown on<br />
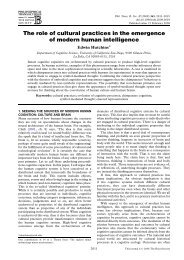
Figure 2. Digital notes (top) and map display with<br />
overlaid annotations (bottom).<br />
a map that is retrieved from Google Maps based on latitude<br />
and longitude, as shown in Figure 2. As with timelines, the<br />
current time position in the <strong>data</strong> can be changed by clicking<br />
on the map. In this way, a notable movement in physical<br />
space can be used as a guide to explore <strong>data</strong> in the same<br />
way as a change in a time series graph.<br />
Digital Pen 1 <strong>data</strong> from a researcher’s paper notes can also<br />
be shown in two ways. First, markers can appear on the<br />
timeline that correspond to the time that a particular note<br />
was written. When the researcher hovers over the marker,<br />
an image of the note appears. Second, the notes as a whole<br />
are displayed, as shown in Figure 2. The pen marks are<br />
initially displayed in gray, but as the researcher moves<br />
Figure 1. Main <strong>DataPrism</strong> Window, showing (from top):<br />
video, video frames, time series graph, and annotations.<br />
1<br />
We currently support Livescribe digital pens<br />
( www.livescribe.com) that record both pen strokes and<br />
associated audio.
through the <strong>data</strong>, the letters get darkened to indicate which<br />
notes correspond to the current time in the <strong>data</strong>. As with the<br />
timelines and the map, analysts can change the current time<br />
position in the <strong>data</strong> by clicking on particular notes to jump<br />
to the corresponding points in the rest of the <strong>data</strong>.<br />
Annotations<br />
Data annotations in <strong>DataPrism</strong> can be visualized on their<br />
own or overlaid on other <strong>data</strong> types. For example, a set of<br />
annotations might be created in relation to moments in a<br />
video that indicate particular types of activity. The<br />
corresponding segments of time can then be highlighted on<br />
a time series graph to depict how various variable values<br />
changed during those aspects of the activity. The<br />
annotations are color-coded with researcher-defined colors,<br />
and can be shown on the timelines and on maps.<br />
Annotations can be used in multiple ways, including both<br />
continuous coding and identification of particular moments<br />
of interest in the <strong>data</strong>, as shown in Figure 3. Annotations<br />
can be simple assignments of categories or free-<strong>for</strong>m text<br />
entries. Categories and possible subcategories can be<br />
defined be<strong>for</strong>e analysis by the researcher, and can be<br />
dynamically modified and extended during analysis.<br />
Annotations can be assigned to multiple categories and used<br />
to group, align, and filter annotations.<br />
Synchronization<br />
Synchronization can be a problem when separate devices<br />
are used to record multiple <strong>data</strong> sets. The ideal solution is to<br />
precisely calibrate system clocks in each of the recording<br />
devices, in which case <strong>data</strong> is automatically aligned when<br />
imported into <strong>DataPrism</strong>. Since this is not always possible<br />
with heterogeneous recording devices, interactive alignment<br />
of <strong>data</strong> is also available. With each supported <strong>data</strong> type,<br />
including multiple videos, the researcher can find a point<br />
that corresponds to another point and align the <strong>data</strong> simply<br />
by clicking on the identified point.<br />
Figure 3. Different ways annotations can be coded in<br />
<strong>DataPrism</strong>. Top: Color-coded segments of <strong>data</strong> that have been<br />
manually defined to indicate phases of activity; Middle:<br />
Values with respect to a single variable assigned continuously<br />
over the course of the video, using vertical position to indicate<br />
value; Bottom: Instances of different types of activity, using<br />
vertical position to group by activity type.<br />
Automatic Analysis<br />
One important use of visualization is to present the results<br />
of automatic processing of <strong>data</strong> streams. <strong>DataPrism</strong><br />
supports a <strong>data</strong> analysis plug-in system <strong>for</strong> scripts written in<br />
the Python language. These scripts can operate on any <strong>data</strong><br />
that resides in <strong>DataPrism</strong>. The results are treated as<br />
annotations and can be visualized and filtered in the same<br />
way as normal annotations. This makes it easy, <strong>for</strong><br />
example, <strong>for</strong> an analysis based on one set of variables to<br />
highlight a region of important activity across the entire<br />
collection of <strong>data</strong>. In the domain of flight, one type of <strong>data</strong><br />
analysis that we have explored uses logic-based rules to<br />
identify flight segments based on well-defined flight<br />
parameters. Similarly, simple rules can be used to identify<br />
moments, such as when the airspeed is within a particular<br />
range, which might be of interest <strong>for</strong> a particular analysis.<br />
USAGE SCENARIO<br />
In this section, we step through a simplified description of<br />
the use of <strong>DataPrism</strong> to analyze <strong>data</strong> from a flight<br />
simulator. The scenario is based on real-world <strong>DataPrism</strong><br />
sessions we observed. The <strong>data</strong> is from novice pilots flying<br />
the flight simulator, which created text logs of simulator<br />
variables at a rate of 5 Hz. Paper notes were made by an<br />
observer during the flight with a LiveScribe digital pen.<br />
Analyses using <strong>DataPrism</strong> in this domain typically include<br />
the following <strong>data</strong> configuration:<br />
Video of pilot-simulator interaction, shown in primary<br />
video window<br />
Video of pilot-pilot interaction, shown in secondary<br />
video window<br />
Simulator log of Altitude, Airspeed, Vertical Speed, and<br />
Bank Angle variables, shown as time series<br />
Geographic position from simulator log, shown as a<br />
path on a map<br />
Notes made by the researcher, shown as annotations and<br />
as a full page<br />
After loading the videos, simulator log, and digital notes,<br />
the researcher begins by aligning the <strong>data</strong>. When the videos<br />
were made, a clapperboard was used at the beginning to<br />
make sure that devices could be synced. The appropriate<br />
places in the movies are found, and then the <strong>data</strong> is matched<br />
to the videos by finding the point where the plane begins to<br />
move in the airspeed <strong>data</strong> and the video <strong>data</strong>. Finally, the<br />
digital notes are synced to the same point by matching a<br />
note made during the simulation at that time. This<br />
simulation run involved novice pilots, so there are many<br />
possible errors to identify in the <strong>data</strong>. On an initial visual<br />
scan of the <strong>data</strong>, the analyst notices a period of fluctuation<br />
in the vertical speed graph. By moving the current time<br />
position indicator, he gets visual reference marks of the<br />
corresponding time position in all of the other <strong>data</strong> sources.<br />
As he moves the time indicator, the position indicator on<br />
the map moves as well. This reveals that the vertical speed<br />
fluctuation occurred at the same time as a sharp turn in the<br />
flight pattern. The relevance of the fluctuations occurring
during a turn is rein<strong>for</strong>ced by a sudden jump in the bank<br />
angle graph at the same time. The shape of the bank angle<br />
graph reveals a sharper turn than would be needed in this<br />
situation. The combined evidence points to a lack of skill in<br />
the novice pilot <strong>for</strong> maintaining proper flight parameters<br />
during turns. By examining the visualizations from these<br />
different sources, the researcher <strong>for</strong>ms a hypothesis that the<br />
cause of the poor per<strong>for</strong>mance might be an inability to<br />
properly manage attention between instruments depicting<br />
bank angle and vertical speed. To help evaluate this<br />
hypothesis, he looks at the video of the flight and notices<br />
the pilot’s eyes seem to be locked on the artificial horizon<br />
and rarely move to the right to the location of the altitude<br />
indicator. This short scenario provides an example of how<br />
<strong>DataPrism</strong> might be used to identify an instance of poor<br />
flight per<strong>for</strong>mance. The important things to note are the<br />
usefulness of being able to visualize multiple <strong>data</strong> sources<br />
and how access to linked visualizations can help evaluate<br />
hypotheses that arise during analysis.<br />
FUTURE WORK<br />
While the current capabilities of <strong>DataPrism</strong> make it an<br />
effective <strong>tool</strong> <strong>for</strong> analysis of <strong>multimodal</strong> behavioral <strong>data</strong>,<br />
we have plans <strong>for</strong> extending it to create more powerful<br />
analysis facilities. Our design goal is to maintain the<br />
simplicity of the current interface but enable a loose<br />
coupling via a plug-in architecture with additional facilities<br />
useful <strong>for</strong> particular domains or types of analyses.<br />
One natural direction is to explore how additional automatic<br />
analysis features might be supported. For example,<br />
computer vision techniques have advanced in capabilities<br />
and reliability to the point that they promise to be highly<br />
useful <strong>tool</strong>s <strong>for</strong> aiding analysis of video <strong>data</strong>. Object<br />
recognition is one particularly promising area. It would be<br />
very useful <strong>for</strong> digital video analysis if an algorithm could<br />
automatically label all (or even most) video frames in which<br />
a particular object is present. The use of scale invariant<br />
features (e.g., SIFT and related techniques [4]) is one<br />
promising approach we are exploring. We are especially<br />
interested in supporting interactive use of automated<br />
analysis facilities. For example, since many computer<br />
vision algorithms are probabilistic, users can modify the<br />
algorithm’s threshold depending on the task. For example,<br />
the threshold <strong>for</strong> object detection could be set at a low value<br />
in which virtually every frame that contains the object is<br />
detected, with the price of increased false alarms. In this<br />
case, a small amount of user intervention would be required<br />
in order to cull the false alarms from true detections. On the<br />
other hand, the object detection threshold could be set at a<br />
high value in which case there would be virtually no false<br />
alarms, with the price that in some frames the object would<br />
be present but not detected. Integrating computational<br />
analysis methods with human interaction in mind allows<br />
such decisions to rest with the analyst, and be interactively<br />
adjusted to specific analysis needs. We are also actively<br />
developing methods <strong>for</strong> integrating <strong>DataPrism</strong> with<br />
additional facilities of digital pens. A digital copy of<br />
freehand notes is a useful addition to analysis, but digital<br />
pens have several advantages over traditional pens that can<br />
be exploited during real-time observation. For example,<br />
since each stroke of the pen is time-stamped, this can<br />
eliminate the need to manually record time-stamps <strong>for</strong> later<br />
indexing into the <strong>data</strong>. In addition, there is considerable<br />
promise in linking paper notes and their digital counterparts<br />
using pen gestures [3]. We are developing a system to allow<br />
marks made in certain regions on paper (e.g., in specific<br />
areas in the margin or on customizable <strong>for</strong>ms) to have<br />
special meaning and be automatically converted into<br />
annotations.<br />
Finally, we plan to engage in further detailed studies of<br />
researcher interaction with <strong>DataPrism</strong>. While the scenario<br />
described in this paper is based on actual observations of<br />
real usage, conclusions about the efficacy of the interactive<br />
visualization techniques require additional <strong>data</strong>, including<br />
usage in other domains.<br />
ACKNOWLEDGMENTS<br />
NSF Grant 0729013 supported this research. We thank<br />
users of <strong>DataPrism</strong> and members of our lab <strong>for</strong> feedback<br />
and design suggestions.<br />
REFERENCES<br />
1. Hagedorn, J., Hailpern, J., & Karahalios, K. VCode and<br />
VData: Illustrating a new Framework <strong>for</strong> Supporting the<br />
Video Annotation Workflow. Ext Abstracts AVI 2008,<br />
317-321.<br />
2. Hodges, S., Williams, L., Berry, E., Izadi, S.,<br />
Srinivasan, J., Butler, A., Smyth, G., Kapur, N., &<br />
Wood, K. SenseCam: a Retrospective Memory Aid,<br />
Ubicomp 2006, 177–193.<br />
3. Liao, C., Guimbretiere, F., Kinckley, K., and Hollan, J.<br />
Papiercraft: A Gesture-Based Command System <strong>for</strong><br />
Interactive Paper. ACM Transactions on Computer-<br />
Human Interaction, 14 (2008) 1-27.<br />
4. Lowe, D. Distinctive Features from Scale Invariant<br />
Keypoints. Intl J of Computer Vision, 60 (2004), 91-110.<br />
5. Pea, R., Mills, M., Rosen, J., Dauber, K., Effelsberg, W.,<br />
& Hoffert, E. The Diver Project: Interactive Digital<br />
Video Repurposing. IEEE MultiMedia, 11, 1 (2004), 54-<br />
61.<br />
6. Wittenburg, P., Brugman, H., Russel, A., Klassmann,<br />
A., & Sloetjes, H. ELAN: a Professional Framework <strong>for</strong><br />
Multimodality Research. Proc. LREC 2006, 1556-1559.<br />
7. Zimmerman, P.H., Bolhuis, J.E., Willemsen, A., Meyer,<br />
E.S., & Noldus, L.P.J.J. The Observer XT: A <strong>tool</strong> <strong>for</strong> the<br />
integration of and synchronization of <strong>multimodal</strong><br />
signals. Behavioral Research Methods, 41, 3 (2009),<br />
731-735.