PDF (815KB) - Tokyo Electron Limited (TEL)
PDF (815KB) - Tokyo Electron Limited (TEL)
PDF (815KB) - Tokyo Electron Limited (TEL)

You also want an ePaper? Increase the reach of your titles
YUMPU automatically turns print PDFs into web optimized ePapers that Google loves.
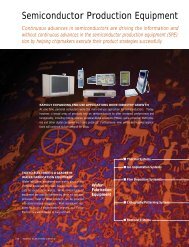
Environmental Report<br />
Plant / Office Initiatives for the Environment<br />
<strong>TEL</strong> is making efforts to reduce the environmental burden at all production plants and offices based on the EHS management structure.<br />
Our Stance on Waste Reduction and Recycling<br />
“Produce no waste. Recycle any waste that is produced. Properly<br />
dispose of any waste that cannot be recycled.” Based on these principles,<br />
<strong>TEL</strong> is working to minimize the waste generated by our business.<br />
With a shortage of waste disposal sites in Japan and landfill costs on<br />
the rise, efforts to reduce waste not only help to minimize environmental<br />
burden, but also lead to lower production costs. Namely, we<br />
are sorting waste for collection, finding new recycling services, managing<br />
the certification of the waste processing service contractors,<br />
periodically checking final disposal conditions, and shifting to processes<br />
that do not generate waste. We are also displaying information<br />
on how to sort waste near waste and recycling receptacles in four languages<br />
for our foreign visiters<br />
and employees, so that they can<br />
sort the waste easily. We are<br />
minimizing our environmental<br />
burden through these activities.<br />
Waste sorting chart displayed<br />
in four languages<br />
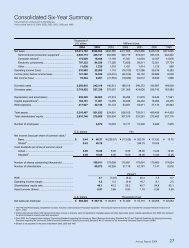
Total Waste and Recycling Ratio<br />
The amount of <strong>TEL</strong> waste that reached landfills and our recycling<br />
rate are summarized in the graph below. As a result of our<br />
efforts to use resources efficiently, the recycling rate has been rising<br />
year after year.<br />
Our initial plan was to achieve a 90 percent overall recycling rate<br />
by FY 2006, but we reached 93 percent in FY 2004, ahead of schedule.<br />
We subsequently established a new target and are now aiming for a<br />
recycling rate of 95 percent or higher by FY2006.<br />
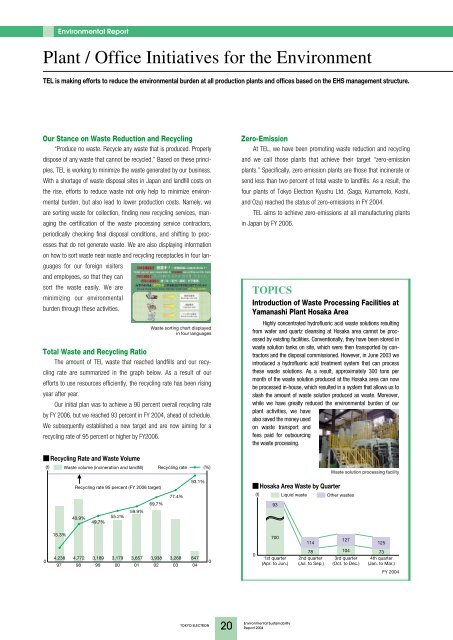
Recycling Rate and Waste Volume<br />
(t) Waste volume (incineration and landfill) Recycling rate (%)<br />
Zero-Emission<br />
At <strong>TEL</strong>, we have been promoting waste reduction and recycling<br />
and we call those plants that achieve their target “zero-emission<br />
plants.” Specifically, zero emission plants are those that incinerate or<br />
send less than two percent of total waste to landfills. As a result, the<br />
four plants of <strong>Tokyo</strong> <strong>Electron</strong> Kyushu Ltd. (Saga, Kumamoto, Koshi,<br />
and Ozu) reached the status of zero-emissions in FY 2004.<br />
<strong>TEL</strong> aims to achieve zero-emissions at all manufacturing plants<br />
in Japan by FY 2006.<br />
TOPICS<br />
Introduction of Waste Processing Facilities at<br />
Yamanashi Plant Hosaka Area<br />
Highly concentrated hydrofluoric acid waste solutions resulting<br />
from wafer and quartz cleansing at Hosaka area cannot be processed<br />
by existing facilities. Conventionally, they have been stored in<br />
waste solution tanks on site, which were then transported by contractors<br />
and the disposal commissioned. However, in June 2003 we<br />
introduced a hydrofluoric acid treatment system that can process<br />
these waste solutions. As a result, approximately 300 tons per<br />
month of the waste solution produced at the Hosaka area can now<br />
be processed in-house, which resulted in a system that allows us to<br />
slash the amount of waste solution produced as waste. Moreover,<br />
while we have greatly reduced the environmental burden of our<br />
plant activities, we have<br />
also saved the money used<br />
on waste transport and<br />
fees paid for outsourcing<br />
the waste processing.<br />
Waste solution processing facility<br />
Recycling rate 95 percent (FY 2006 target)<br />
69.7%<br />
59.9%<br />
40.9% 55.2%<br />
49.7%<br />
77.4%<br />
93.1%<br />
Hosaka Area Waste by Quarter<br />
(t) Liquid waste Other wastes<br />
93<br />
15.3%<br />
700<br />
114<br />
127<br />
125<br />
0<br />
4,238 4,772 3,189 3,179 3,657 3,938 3,268 847<br />
97 98 99 00 01 02 03 04<br />
0<br />
0<br />
1st quarter<br />
(Apr. to Jun.)<br />
78<br />
2nd quarter<br />
(Jul. to Sep.)<br />
104<br />
3rd quarter<br />
(Oct. to Dec.)<br />
73<br />
4th quarter<br />
(Jan. to Mar.)<br />
FY 2004<br />
TOKYO ELECTRON<br />
20<br />
Environmental Sustainability<br />
Report 2004