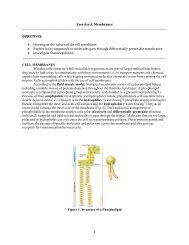
GENERAL BIOLOGY LAB 1 (BSC1010L)
GENERAL BIOLOGY LAB 1 (BSC1010L)
GENERAL BIOLOGY LAB 1 (BSC1010L)

You also want an ePaper? Increase the reach of your titles
YUMPU automatically turns print PDFs into web optimized ePapers that Google loves.
Exercise 4: Enzymes<br />
________________________________________________________________________<br />
OBJECTIVES:<br />
• Learn about the function of enzymes.<br />
• Understand and be able to predict how temperature affects enzyme activity.<br />
• Understand how to collect and examine qualitative data.<br />
________________________________________________________________________<br />
INTRODUCTION:<br />
All biological processes, including growth, reproduction and metabolism, require<br />
a constant supply of energy. The production of this energy is accomplished through the<br />
thousands of chemical reactions that occur in cells and is regulated by biological catalysts<br />
called enzymes. Our everyday lives are dependent on these proteins and in some<br />
instances the absence of a particular enzyme can cause serious illness and in severe cases,<br />
even death. For example, tyrosinase deficiency, an enzyme needed for production of<br />
cellular pigments, causes albinism, while insufficient production of phenylalanine<br />
hydroxilase results in phenylketonuria (PKU), which can lead to severe mental<br />
retardation if left untreated.<br />
The use of enzymes in our daily lives has significantly improved our standard of<br />
living. For instance, proteases and amylases, which are produced by the body to break<br />
down protein and starch, respectively, are also used commercially to make bread, biscuits<br />
and crackers. Enzymes are also utilized in brewing processes for the production of<br />
alcohol, cheese, and detergents, as well as to tan leather products. In medicine, enzymes<br />
are important agents in the treatment of heart attacks (streptokinase dissolves blood clots<br />
in arteries of heart walls) and cancer (asparaginase is used for acute lymphocytic<br />
leukemia in children). Without enzymes, life would not be possible. Food would not be<br />
converted to energy and our bodies would not be able to replace old, damaged tissues<br />
with new, healthy ones. Cellular waste products would not be disposed of and ultimately,<br />
all cellular activity (metabolism, reproduction, growth) would cease.<br />
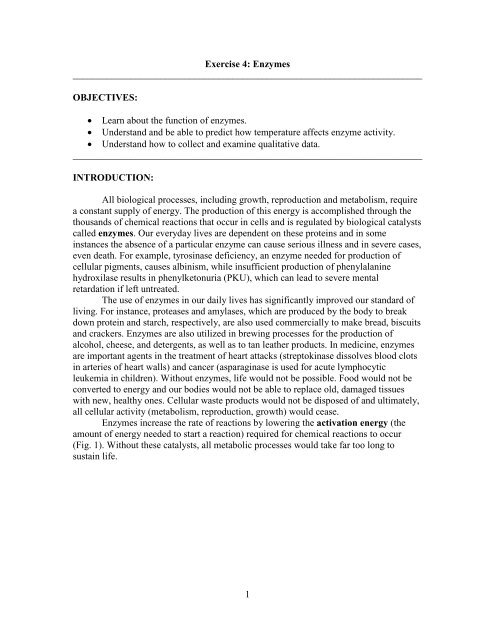
Enzymes increase the rate of reactions by lowering the activation energy (the<br />
amount of energy needed to start a reaction) required for chemical reactions to occur<br />
(Fig. 1). Without these catalysts, all metabolic processes would take far too long to<br />
sustain life.<br />
1
Figure 1. Enzymes lower the activation energy needed for chemical reactions<br />
Most enzymes are proteins with three-dimensional shapes determined by their<br />
amino acid sequences. When a substrate (reactant) molecule binds to the highly specific<br />
active site of an enzyme, an enzyme-substrate (ES) complex is formed (Fig. 2). The ES<br />
complex modifies the substrate’s chemical bonds and initiates a series of chemical<br />
reactions resulting in the formation of a product. It is important to note that the enzyme<br />
itself is not changed or consumed in the reaction thus, it is reusable. As products are<br />
generated they are released from the enzyme’s active site allowing other substrate<br />
molecules to bind.<br />
Figure 2. Substrate binding at the active site of an enzyme. As the substrates (blue<br />
and red) bind to the active site (1), the enzyme-substrate (ES) complex forms (2),<br />
and the products are released (3).<br />
2
The active site determines the specificity of every enzyme. Specificity can result<br />
from the charge, shape, and hydrophobic/hydrophilic characteristics of the enzyme and<br />
substrate molecules. Only reactants that match the geometric shape of the active site can<br />
bind to the enzyme. This specificity is also known as the “lock and key model” where<br />
the substrate (the key) fits into the active site (the lock) of an enzyme. However, as<br />
mentioned previously, the interaction between a substrate and the enzyme’s active site is<br />
not static. When a substrate binds to the enzyme, the active site is reshaped by the<br />
interactions of the enzyme’s amino acid side chains with the substrate molecule. This<br />
protein remodeling enhances the overall binding of the reactant to the active site,<br />
increasing catalytic action. The ability of enzymes to mould their shape to enhance the fit<br />
of substrate molecules is known as the “induced fit model.”<br />
There are thousands of different enzyme types, each with a specific set of<br />
conditions at which it works best, i.e., its optimal conditions. An enzyme’s optimal<br />
conditions often reflect the environment(s) of the organism(s) in which it is found. For<br />
instance, the optimum temperature for enzymes present in Thermophilus aquaticus, an<br />
extremophilic bacterium that inhabits hot springs, is about 70ºC. In contrast, peroxidase,<br />
an enzyme present at high concentrations in turnips, horseradish roots and potatoes,<br />
works best at temperatures around 45ºC.<br />
Enzymatic activity is affected by multiple factors, including pH, substrate<br />
concentration, salt concentration, as well as the presence of inhibitors, activators and<br />
cofactors. In this lab, you will examine the effect of temperature on enzymatic reactions.<br />
Temperature affects the rate at which substrate and enzyme molecules collide. At<br />
temperatures greater than the optimal, the active site denatures (i.e. changes shape),<br />
decreasing or preventing substrate binding. Consequently, product formation is either<br />
reduced or completely arrested. At the other end of the spectrum, low temperatures<br />
decrease the movement of molecules, resulting in less contact between enzymes and<br />
substrates, which slows down the frequency and rate of reaction, and ultimately<br />
diminishes product formation. Although the effect of temperatures outside of the optimal<br />
range on substrate catalysis is the same, the mechanism through which enzyme activity is<br />
reduced, differs.<br />
The objective of the current lab is two-fold; (1) to examine how variations in<br />
temperature affect the activity of the enzyme amylase and (2) to determine the optimal<br />
temperature for amylase from two different sources (fungal and human).<br />
Amylase catabolizes starch polymers (a storage polysaccharide) into smaller<br />
subunits (monomers = saccharides) including maltriose, maltose and short<br />
oligosaccharides comprised of 2-20 monosaccharide units (Fig. 3). Most organisms use<br />
these saccharides as a food source and to store energy (Fig. 4). Both starch and amylase<br />
are important commercially in the production of syrups and other food products, as well<br />
as for fermentation and brewing processes.<br />
3
Figure 3. Starch digestion by amylase Figure 4. Starch molecule. Starch<br />
formed by the interlinking of multiple<br />
glucose units connected by alpha-1,4 and<br />
alpha-1,6 linkages<br />
________________________________________________________________________<br />
TASK 1 - Effect of Temperature on Amylase Activity<br />
The objective of this exercise is to determine the optimal temperatures for fungal<br />
(Aspergillus oryzae) and human amylases. In addition, you will examine the effect of<br />
temperature on the ability of amylase to break down starch to maltose. You will monitor<br />
starch catalysis visually using the Iodine test, which turns from yellow to blue-black in<br />
the presence of starch (for further details see Exercise 4).<br />
Questions:<br />
Before beginning the experiment, predict what you expect to occur for each of the four<br />
temperature treatments. Record your predictions in Table 1.<br />
1. Briefly in your own words describe how enzymes function.<br />
2. What factors could affect the proper function of an enzyme<br />
3. Differentiate between dehydration synthesis and hydrolysis reactions.<br />
4
4. Differentiate between catabolism and anabolism.<br />
5. What criteria will you use to determine that starch has been catabolized<br />
6. Based on what you know about enzymes, formulate hypotheses (Scientific, H o and H a) for<br />
what you expect to occur at the different temperatures over time between fungal and<br />
human amylase activity. Write the hypotheses in the space provided and explain your<br />
reasoning for each.<br />
Scientific:<br />
Ho:<br />
Ha:<br />
7. Based on what you know about enzymes, formulate hypotheses (Scientific, Ho and Ha) for<br />
what you expect to occur at the different temperatures over time using human amylase<br />
activity. Write the hypotheses in the space provided and explain your reasoning for each.<br />
Scientific:<br />
Ho:<br />
Ha:<br />
5
8. Based on what you know about enzymes, formulate hypotheses (Scientific, Ho and Ha) for<br />
what you expect to occur at the different temperatures over time using fungal amylase<br />
activity. Write the hypotheses in the space provided and explain your reasoning for each.<br />
Scientific:<br />
Ho:<br />
Ha:<br />
Make Predictions: Table 1. Fungal Amylase Predictions<br />
Temperature (°C) Expected Results Reasoning<br />
0<br />
40<br />
60<br />
95<br />
Table 2: Human Amylase Predictions<br />
Temperature (°C) Expected Results Reasoning<br />
0<br />
40<br />
60<br />
95<br />
6
Important Notes:<br />
• Each group will test the optimal temperature for one amylase type and then<br />
will repeat the experiment using the amylase from the other source. Your<br />
instructor will assign the enzyme that your group should start with.<br />
• At the end of the experiment, your group should have 2 data sets, one for<br />
each type of amylase (fungal and human).<br />
• To determine the optimal temperatures for both enzymes, you will need to<br />
generate a class data set by combining your group’s results with the data<br />
collected by the other groups in your class. These data sets<br />
Procedure:<br />
I. Experimental Setup:<br />
1. Place a napkin/paper under the spot plates (Figure 5) and across the top<br />
write Temperature (0°, 40°, 60°, 95° Celsius) and on the side write Time (0, 2,<br />
4, 6, 8, 10 min).<br />
Figure 5. Spot plate setup<br />
2. Obtain 4 test tubes and label each with a different temperature<br />
(0°, 40°, 60°, 95° Celsius), enzyme source (H – human and F –<br />
fungal) and your group number.<br />
0° - H – Grp1<br />
3. Obtain another 4 test tubes and label these with a different<br />
temperature, enzyme source (H or F), your group number and<br />
the letter S (for starch solution).<br />
4. Add 5mL of 1.5% starch solution into each of the test tubes<br />
labeled S.<br />
II. Effect of Temperature on Amylase Activity<br />
5. Add 1mL of amylase into each of the test tubes that do not<br />
contain starch.<br />
7
a. If you have been assigned Human amylase (H), collect 5mL of saliva<br />
from members of your group into a weighing boat. If you ate before<br />
coming to lab make sure to rinse out your mouth with water prior to<br />
saliva collection. Also, in the event that you are having a hard time<br />
producing enough saliva, chew on a small piece of parafilm (it is<br />
tasteless).<br />
b. Transfer 0.5mL saliva into each test tube.<br />
c. Dilute your saliva by adding 0.5mL of distilled water into each test<br />
tube containing the saliva.<br />
d. If you have been assigned Fungal amylase (F), add 1mL of fungal<br />
amylase solution to each tube.<br />
6. Place all 4 test tubes containing starch and the 4 test tubes containing amylase<br />
into their respective temperatures.<br />
a. 0ºC into the ice bath,<br />
b. 40ºC into the 40ºC water bath,<br />
c. 60ºC into the 60ºC water bath,<br />
d. 95ºC into the 95ºC water bath.<br />
7. Allow all tubes to equilibrate for 5 minutes in their respective temperatures.<br />
8. Add 2-3 drops of iodine to each well at the 0 minutes row.<br />
9. At the end of the equilibration process, without removing the tubes from<br />
their water baths, transfer a few drops of the starch solution from each<br />
temperature treatment to the first row of the spot plate corresponding to time 0<br />
minutes. Make sure to use a separate transfer pipette for each<br />
temperature treatment. Label each of your transfer pipettes with the correct<br />
temperature so that they can be reused for each time interval<br />
10. Within each temperature treatment, pour the starch solution into the tube<br />
containing amylase. Set your timer for 2 min at the moment of amylase<br />
addition.<br />
11. Add 2-3 drops of iodine to each well at the 2 minutes row. This will be<br />
repeated before the transfer of each starch-amylase mixture to the spot plates.<br />
12. After 2 min, use the correct transfer pipette for each temperature to remove a<br />
few drops of the starch-amylase mixture from each tube. Place 2-3 drops of<br />
the mixture in the second row (time = 2 min) on your spot plate under the<br />
corresponding temperature. Note the color changes and record your<br />
observations in Table 2 (human amylase) or 3 (fungal amylase), depending on<br />
your amylase source. Note: You will be analyzing the CLASS DATA SET in<br />
your lab reports.<br />
8
13. After each additional 2 min, repeat step 11 and 12. Make sure that you add the<br />
starch-amylase mix to the correct wells for time and temperature.<br />
14. At the end of the 10 min, note the temperature and the time at which 100%<br />
hydrolysis occurred (Fig. 6).<br />
15. Repeat the procedure using the other amylase type.<br />
16. Use the color-coding scheme below to convert your results (qualitative data)<br />
into quantitative (numerical) data. In the column next to your color data,<br />
record the corresponding number.<br />
STARCH HYDROLYSIS<br />
1 2 3 4 5<br />
MOST STARCH LEAST<br />
Figure 6. Starch hydrolysis<br />
Table 2: Human amylase<br />
Temp ( o C)<br />
0 40 60 95<br />
Color # Color # Color # Color #<br />
0<br />
Time (min)<br />
2<br />
4<br />
6<br />
8<br />
10<br />
9
Table 3: Fungal amylase<br />
Temp ( o C)<br />
0 40 60 95<br />
Color # Color # Color # Color #<br />
0<br />
Time (min)<br />
2<br />
4<br />
6<br />
8<br />
10<br />
Questions:<br />
9. Which of the variables is (are) the independent variable(s)<br />
10. Which of the variables is (are) the dependent variable(s)<br />
11. What variables serve as controls and what do they control for<br />
12. Based on the color findings, is starch present at time zero Should starch be present<br />
Why or why not<br />
10
13. Did your observed results reflect your predictions for fungal amylase activity (Table 1)<br />
Explain.<br />
0<br />
40<br />
60<br />
95<br />
14. Did your observed results reflect your predictions for human amylase activity (Table 2)<br />
Explain.<br />
0<br />
40<br />
60<br />
95<br />
15. What do your results indicate about the optimal temperature for each type of amylase<br />
16. Explain the relationship between the amount of starch and maltose present during<br />
starch hydrolysis.<br />
17. Do you reject or fail to reject your null hypothesis Explain.<br />
11
18. Explain the reasoning behind the changes seen at each temperature for fungal amylase.<br />
0<br />
40<br />
60<br />
95<br />
19. Indicate which temperature had the fastest rate of reaction for fungal amylase activity.<br />
Explain.<br />
20. Explain the reasoning behind the changes seen at each temperature for human amylase<br />
0<br />
40<br />
60<br />
95<br />
21. Indicate which temperature had the fastest rate of reaction for human amylase activity.<br />
Explain.<br />
22. How does temperature affect the structure of the enzyme. Does this relate to enzyme<br />
activity<br />
23. Compare and contrast the rate of reaction for human and fungal amylase activity.<br />
12
24. Identify any possible sources of error which may have affected the results of this<br />
experiment.<br />
25. How do the optimal temperature results for fungal amylase activity relate to<br />
environmental conditions for the organism’s natural habitat<br />
26. How do the optimal temperature results for human amylase activity relate to normal<br />
human body temperature<br />
27. In the space below sketch graphs that would be representative of fungal amylase<br />
enzyme activity vs. change in temperature.<br />
28. In the space below sketch graphs that would be representative of human amylase<br />
enzyme activity vs. change in temperature.<br />
29. Why is it necessary to let the test tubes stand for 5 minutes in their various<br />
temperatures<br />
30. What was the purpose of the 0 minutes wells at each temperature<br />
13
Because there is usually some degree of error introduced when we take measurements,<br />
scientists take multiple readings and then use statistics to get a more accurate<br />
representation of the true measurement and to be able to evaluate how accurate the<br />
sampling may have been. How much variation exists between each measure taken can give<br />
you an idea about accuracy. In general, scientists use two types of statistical calculations to<br />
measure variability: (1) variance and (2) standard deviation.<br />
Variance is a measure of the dispersion of a set of data points around their mean value.<br />
Variance is a mathematical expectation of the average squared standard deviations from the<br />
mean.<br />
Variance= Ʃ(x−x)/(N−1)<br />
The Standard Deviation is a measure of how spread out the numbers in the data set are. Its<br />
symbol is σ (the greek letter sigma). The formula is easy: it is the square root of the Variance.<br />
Make sure to read the Simple Statistics link on the website for additional help.<br />
31. Using the values in the Table 5, perform all calculations necessary to obtain the variance<br />
and standard deviation for the data set.<br />
III. Generation of a class dataset (must be included in the lab report):<br />
1. Combine the numerical data from each group. If there are 6 groups in your<br />
class, then each group should have a dataset for fungal amylase and another<br />
for human amylase. Therefore, as a class, you should have 6 datasets for each<br />
amylase type.<br />
2. Record your results in the log files (one for human and one for fungal<br />
amylase). Make sure to include the results of every group in each cell of the<br />
table.<br />
14
3. Based on the results of all groups, record the optimal temperature for amylase<br />
activity as well as the time for 100% hydrolysis to occur at the optimal<br />
temperature in the last two rows of each log file.<br />
IV. For homework:<br />
1. Calculate the mean and standard deviation (SD) for each temperature and time for<br />
both enzymes. Record these values in the log files.<br />
2. Using the numerical data collected in Tables 2 and 3, create a graph(s) in Excel that<br />
addresses the following questions:<br />
a. How does temperature affect amylase activity<br />
i. You may choose to plot either starch or maltose concentration but<br />
make sure that you understand the relationship between the two<br />
compounds..<br />
b. Is starch catabolism equally efficient across all temperatures<br />
c. Do fungal and human amylases breakdown starch at the same temperature(s)<br />
and rate (time to completely hydrolyze starch)<br />
d. What is the relationship between starch and maltose concentrations during<br />
starch hydrolysis<br />
3. Suggestions for graphing data:<br />
a. There is more than one way to present your data graphically. Each graph<br />
generated may show different aspects of your data and may explain the<br />
relationships between your variables in different ways. The key to figuring out<br />
the best way to show a particular relationship is by plotting the data and trying<br />
to interpret what the graph illustrates (you may need to plot the data using<br />
multiple approaches).<br />
b. You do not need a separate graph to answer each of the questions above but<br />
you may need to generate more than one graph to address the questions<br />
properly.<br />
c. When plotting your data, label the axes with a few words describing what is<br />
being measured and include units in parentheses [e.g. Time (min)]. Also<br />
remember to include a title for your graph.<br />
d. If you are plotting more than one variable on a graph, use different colors,<br />
symbols, or line patterns to differentiate between variables and create a legend<br />
to explain what each color/symbol represents.<br />
4. Questions to consider when examining your data<br />
a. Is there a lot of variation between the group data for each time, temperature<br />
and amylase type<br />
i. What can account for this variation (Hint: consider methodology and<br />
experimental errors)<br />
b. Is there more variance for certain temperature treatments than for others If<br />
so, what factors can explain the variance observed<br />
c. What does your data suggest about the optimal temperatures for amylase from<br />
the two different sources<br />
i. What about the time for hydrolysis<br />
15