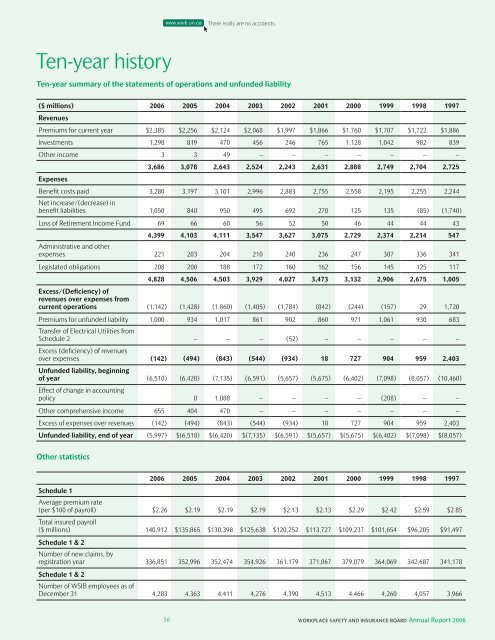
There really are no accidents. Ten-year history Ten-year summary of the statements of operations and unfunded liability ($ millions) <strong>2006</strong> 2005 2004 2003 2002 2001 2000 1999 1998 1997 Revenues Premiums for current year $2,385 $2,256 $2,124 $2,068 $1,997 $1,866 $1,760 $1,707 $1,722 $1,886 Investments 1,298 819 470 456 246 765 1,128 1,042 982 839 Other income 3 3 49 – – – – – – – Expenses 3,686 3,078 2,643 2,524 2,243 2,631 2,888 2,749 2,704 2,725 Benefit costs paid 3,280 3,197 3,101 2,996 2,883 2,755 2,558 2,195 2,255 2,244 Net increase/(decrease) in benefit liabilities 1,050 840 950 495 692 270 125 135 (85) (1,740) Loss of Retirement Income Fund 69 66 60 56 52 50 46 44 44 43 4,399 4,103 4,111 3,547 3,627 3,075 2,729 2,374 2,214 547 Administrative and other expenses 221 203 204 210 240 236 247 387 336 341 Legislated obligations 208 200 188 172 160 162 156 145 125 117 4,828 4,506 4,503 3,929 4,027 3,473 3,132 2,906 2,675 1,005 Excess/(Deficiency) of revenues over expenses from current operations (1,142) (1,428) (1,860) (1,405) (1,784) (842) (244) (157) 29 1,720 Premiums for unfunded liability 1,000 934 1,017 861 902 860 971 1,061 930 683 Transfer of Electrical Utilities from Schedule 2 – – – (52) – – – – – Excess (deficiency) of revenues over expenses (142) (494) (843) (544) (934) 18 727 904 959 2,403 Unfunded liability, beginning of year (6,510) (6,420) (7,135) (6,591) (5,657) (5,675) (6,402) (7,098) (8,057) (10,460) Effect of change in accounting policy 0 1,088 – – – – (208) – – Other comprehensive income 655 404 470 – – – – – – – Excess of expenses over revenues (142) (494) (843) (544) (934) 18 727 904 959 2,403 Unfunded liability, end of year (5,997) $(6,510) $(6,420) $(7,135) $(6,591) $(5,657) $(5,675) $(6,402) $(7,098) $(8,057) Other statistics Schedule 1 <strong>2006</strong> 2005 2004 2003 2002 2001 2000 1999 1998 1997 Average premium rate (per $100 of payroll) $2.26 $2.19 $2.19 $2.19 $2.13 $2.13 $2.29 $2.42 $2.59 $2.85 Total insured payroll ($ millions) 140,912 $135,865 $130,398 $125,638 $120,252 $113,727 $109,237 $101,654 $96,205 $91,497 Schedule 1 & 2 Number of new claims, by registration year 336,851 352,996 352,474 354,926 361,179 371,067 379,079 364,069 342,687 341,178 Schedule 1 & 2 Number of WSIB employees as of December 31 4,283 4,363 4,411 4,276 4,390 4,513 4,466 4,260 4,057 3,966 56 WORKPLACE SAFETY AND INSURANCE BOARD <strong>Annual</strong> <strong>Report</strong> <strong>2006</strong>
There really are no accidents. <strong>2006</strong> public sector salary disclosure WSIB employees earning more than $100,000 per annum Surname Given Name Position Salary Paid Taxable Benefits Abrams Brenda E. Vice Presdient, Legal Services and General Counsel $197,030.66 $4,422.94 Achar Ramachandra Medical Consultant $117,413.29 $- Adamo Valerie Vice President, Business Technology Services and Chief Information Officer $206,647.72 $357.30 Ah-Yoong Georges Executive Director, Financial Planning and Support $132,580.94 $2,729.42 Allingham Richard Director, Research and Evaluation $129,848.55 $256.56 Argue Robert Director, Applications Development $110,654.24 $154.67 Arvisais Ed Medical Consultant $147,239.71 $276.82 Ayres David System Architect $100,606.24 $189.28 Bain Donna Executive Director, Health Services Management $165,537.71 $286.18 Balinson Alex Paul Medical Consultant $116,600.12 $221.41 Barone Lynne Director, Organizational Effectiveness $107,552.69 $212.78 Belanger Adele Marie Legal Counsel $120,894.70 $239.04 Bell Susan Director, Schedule II Sector $124,783.35 $246.92 Bentley David System Architect $105,175.15 $187.02 Bercovitch Eve Legal Counsel $123,488.19 $244.02 Bishop Margaret Medical Consultant $146,517.88 $276.82 Blanchard Patricia D. Director, Employee Relations $103,635.30 $205.22 Boland John Assistant Director, Industry Sector/Small Business $101,549.39 $551.10 Bradbury Laura Fair Practices Commissioner $143,708.34 $284.14 Bridge Margaret Associate Director/Physician $151,515.66 $287.72 Brown Elizabeth Legal Counsel $126,898.03 $250.86 Brown Marilyn Manager, Pension Policy & Adminstration $120,051.03 $119.04 Burton Neil Director, Client Services Development $141,043.95 $257.88 Cancilla John Director, Strategic Compliance $105,170.34 $207.80 Chain Marybelle Medical Consultant $142,739.71 $276.82 Charlton Heidi Director, Corporate Office/ Executive Assistant to President and Chief Executive Officer $106,377.39 $180.79 Chen Kathy Senior Specialist Database $117,285.38 $183.04 Chin Charmaine Director, Central Claims Processing $117,098.60 $231.88 Chiu Margaret Manager, Information Services/Information Technology Projects $113,425.38 $221.92 Clark Dane Director, Service Delivery $111,233.91 $212.03 Clark Jeff Director, Strategic Procurement Facilities Management $114,887.78 $227.22 Coulson Greg Human Resources Business Partner $120,611.79 $229.58 David Lawrence Medical Consultant $129,843.80 $437.75 De Lair Hal Director, Ontario Occupational Health Services Network $116,823.16 $226.50 Denham John Vice Presidents, Investments $261,519.02 $448.34 Deslauriers Jean Medical Consultant $145,739.71 $276.82 Difranco Joe Senior Specialist, Applications $109,900.24 $180.36 Doppler Andrew Director, Service Delivery $118,076.29 $233.20 Dorcas Dow Medical Consultant $151,939.06 $- Dudley John Associate Director/Physician $159,496.25 $298.00 Easson Douglas Assistant Director, Prevention $112,898.87 $192.08 Fahmy Nadia Director, Service Delivery $125,222.67 $268.06 Field Paul Director, Small Business $121,369.22 $231.16 Fortin Claire Marie Director, Medical Occupational Disease Policy $119,081.15 $235.10 Galway Kathleen Director, Business Operations Audit $112,341.32 $222.24 Gao David G. Senior Specialist, Applications $103,766.85 $177.14 Garg Swarn K. Medical Consultant $145,739.71 $276.82 Geary Judy Vice President, Program Development $201,393.93 $3,164.17 Germansky Martin Medical Consultant $148,739.71 $276.82 Gilchrist Sharon Director, External Stakeholder Relations $116,848.78 $223.68 Gilkinson Paul Director, Appeals $119,061.21 $235.40 Godin Lisanne Assistant Director, Industry Sector/Small Business $100,143.60 $194.98 Gray-Moores Jackie Organizational Effectiveness Consultant $100,327.32 $544.58 Grbac Leonard Medical Consultant $148,400.77 $501.82 Hann Karen Director, Health Services Management $107,141.46 $212.14 Harding Robert Director, Transportation Sector $111,522.25 $219.90 Heckadon Robert Associate Director/Physician $104,131.28 $- Herlick Vivi Project Consultant $108,513.60 $- Herrington Michael Director, Small Business $116,841.58 $231.16 Hickman Robert Medical Consultant $142,739.71 $626.82 Hicks Doug K. Workwell Evaluator $102,246.33 $143.47 Higgins Jodi Director, Small Business $131,090.27 $609.14 Hinrichs Robert Vice President and Chief Actuary $282,725.04 $4,560.76 Horseman Brock C. Chief Operating Officer $326,093.43 $543.10 Houston Roberta Legal Counsel $110,866.31 $219.30 Hussain Andrew Director, Technology Management Services $125,950.97 $248.96 Hutcheon Jill President and Chief Executive Officer $360,993.27 $15,424.61 Jachna John Director, Pre 1990 Claims $105,340.69 $208.32 Jackson Steven Vice President, Human Resources $185,090.82 $530.44 Jakobson Susan Director, Organizational Health Safety & Wellness $112,929.73 $223.15 Jeanes Wayne Assistant Director, Treasury Operations $110,838.27 $550.73 Johnson Patricia Director, Program & System Development $101,657.71 $201.10 Johnston Michael Bruce Director, Prosecutions $122,620.69 $242.66 Jordan Vince Manager, Software Services $109,019.50 $215.36 Kanalec Andrew D. Medical Consultant $145,739.71 $276.82 Karr William Medical Consultant $141,546.35 $212.75 Kashani Soudabeh Medical Consultant $125,691.01 $224.66 Kelly Brian Associate Director/Physician $163,735.54 $311.86 Kelly Linda Director, Specialist and Advisory Services $121,153.10 $580.44 Kerr Fergus Director, Occupational Disease and Survivor Benefits $125,423.75 $247.96 Kosmyna Roman Board Auditor $195,676.86 $4,421.38 Kwong Paul Director, Applications and Integration Services $138,309.62 $259.84 Note: The amounts shown as earnings in this disclosure statement may not represent the individual’s actual annual rate of salary. The earnings required to be made public under the Public Sector Salary Disclosure Act, 1996 reflect the amount reported to the Canada Revenue Agency on the employer’s T4 slip for an employee. The earnings shown in this statement may therefore include non-recurring payments in <strong>2006</strong> for retroactive pay from a reclassification or a grievance settlement or a pay-out upon retirement. The earnings shown may also be less than the individual’s annual rate of salary if the individual worked only part of the year. Surname Given Name Position Salary Paid Taxable Benefits Lamanna Pat Director, Small Business $129,844.75 $604.88 Lancaster Geoff Project Director $149,063.82 $- Lau Robert Hing Director, Financial Services $118,388.42 $234.06 Lee Tommy Team Lead Business Technology Services $118,635.27 $176.42 Leshchyshyn Dana Executive Director, Service Delivery $140,675.02 $2,745.30 Levitsky Marianne Director, Best Practices $126,295.35 $238.18 Little Sheila Director, Admin. Services $104,958.76 $208.12 Lo Alvin Program Manager $156,159.74 $- Lorenz George Director, Compensation $119,612.59 $236.82 Lovelock Ronald Director, Prevention Services $120,229.15 $238.18 Lovett Kerry Director, Small Business $107,610.79 $212.78 Ma Betty Actuary, Pricing and Experience Rating $147,811.12 $292.10 Ma Chun System Architect $102,597.52 $182.24 Maehle Waldermar Medical Consultant $145,739.71 $276.82 Malara Nives Director, Learning and Program Evaluation $111,796.73 $219.40 Mancini Carmen Assistant Director, Industry Sector/Small Business $119,418.28 $543.94 Martin John Manager, Benefits Policy $100,102.06 $197.88 Mastrilli Arcangelo Medical Consultant $142,739.71 $276.82 Mastromattei Heather Director, Service Delivery $104,045.58 $205.50 McAdam Roberta Director, Revenue Audit Services $123,030.67 $242.98 McCarthy Jane Vice President, Health Services $206,617.30 $346.72 McIntosh-Janis Faye Director, Occupational Disease and Survivor Benefits $118,194.63 $234.06 McIntyre Moira Vice President, Strategic Communications, Policy and Research $175,977.94 $304.24 McKenna-Boot Patricia Associate Director/Physician $152,540.75 $295.78 Mckenna Erin Director, Serious Injury Program and Specialty Programs $113,607.37 $224.92 McLean Katherine Director, Strategic Project Management Office ad Business Advisory Services $118,212.21 $233.74 McMurtrie Robert Corporate Controller $136,303.36 $269.82 Meenan John J. Medical Consultant $148,739.71 $276.82 Mikkelsen Allan Charles Human Resources Business Partner $116,654.76 $456.16 Morrison Richard Director, Small Business $130,148.87 $257.56 Morsillo Joe Director, Benefits & Revenue Policy Branch $110,543.93 $218.44 Mould Roy Chief Prevention & Corporate Strategy Officer $282,582.56 $2,950.94 Ng Malen Chief Financial Officer $305,484.54 $518.80 Noble Elaine Legal Counsel $105,063.46 $207.80 O’Connor Deborah Medical Consultant $145,676.87 $274.02 Painvin Catherine Director, Clinical Resources $164,924.07 $323.08 Peddle Laura Director, Compliance Projects and Planning $106,598.43 $553.26 Peter Alice Director, Research Secretariat $117,665.64 $232.36 Petrie Gordon Director, Collection Services $113,602.43 $225.12 Potocny Steve Finance Business Partner $109,907.57 $217.26 Potter Douglas Senior Project Manager $123,877.44 $240.76 Prichett Barry Medical Consultant $142,739.71 $276.82 Pushka Wayne Director, Security & Investigations $121,451.96 $240.04 Rabbito Maria Teresa Assistant Director, Industry Sector/Small Business $102,978.33 $203.90 Rajack Christina Manager and Practice Leader-Services Management $104,996.36 $207.80 Ramsey Williard Actuary, Valuation and Costing $152,860.61 $302.66 Recchi Serge Legal Counsel $100,280.13 $423.60 Rodenhurst John D. Director, Strategic Planning and Alliances $120,338.97 $236.10 Scarcello Ralph Manager, Business Operation Audit $104,918.88 $196.24 Schofield Michel Physician Coordinator, Specialty Clinic $161,398.98 $312.90 Scullion Catherine Medical Consultant $137,903.97 $276.82 Setton Allan Chief Architect $171,022.74 $308.78 Seville Michelle Systems Architect $102,990.39 $204.22 Sgro Joseph Vice President, Specialized Claims Services $181,576.51 $313.46 Share Frances Director, Return to Work/Labour Market Re-entry $120,725.25 $227.78 Shewell Kathryn Director, Business Relationship Services $132,939.32 $244.02 Simon Larry Architect $207,999.74 $- Siu Christina Senior Project Manager $102,860.73 $202.14 Slinger John Chief Corporate Services Officer $264,453.35 $4,541.82 Smargiassi Lou Manager, Appeals $112,962.52 $204.22 Smith Carol Medical Consultant $119,000.12 $221.41 Smith Graham Manager, Revenue Policy $100,474.21 $198.92 Snowden Edward C. Manager, Enterprise Network Services $105,269.72 $192.94 Stasila Dave Director, Investments $138,971.81 $179.54 Steinnagel Brenda Medical Consultant $130,542.82 $221.41 Subryan Keith Director, Service Delivery $107,141.37 $561.74 Tam Ed Director, Information Systems Audit $112,289.26 $222.24 Taraschuk Ihor Medical Consultant $145,739.71 $276.82 Temnenco Vitalie System Architect $101,771.40 $426.10 Thompson Wayne Director, Provider Relations $141,483.16 $234.06 Thorpe William R. Medical Consultant $104,904.69 $196.01 Timlin Robert J. Director, Corporate Business Design & Implementation $121,871.78 $236.54 Tkachenko Laurisa Director, Privacy Office $102,618.12 $202.86 Todorovic Slavica Executive Director, Policy and Research $137,541.85 $271.90 Tucker Cheryl Director, Community Relations $111,555.92 $218.30 Walker John Medical Consultant $148,739.71 $276.82 Wallace Tim System Architect $125,837.27 $220.14 Wang Kennedy Director, Schedule II Sector $121,500.84 $231.44 Weatherbee Wayne Vice President, Service Delivery $228,370.38 $3,210.67 Webb Joanne Director, Adjudication Branch $104,422.11 $198.53 Weber Diane Director, President’s Office $151,036.19 $260.70 Wentzell Scott Medical Consultant $121,137.41 $221.41 Whitney David Director, Small Business $121,964.44 $241.42 Wiskin John Director, Schedule II Sector $138,332.89 $239.76 Young David Assistant Director, Revenue Audit $100,593.13 $199.24 WORKPLACE SAFETY AND INSURANCE BOARD <strong>Annual</strong> <strong>Report</strong> <strong>2006</strong> 57