About Buildouts - NEMO - University of Connecticut
About Buildouts - NEMO - University of Connecticut
About Buildouts - NEMO - University of Connecticut

Create successful ePaper yourself
Turn your PDF publications into a flip-book with our unique Google optimized e-Paper software.
<strong>About</strong> <strong>Buildouts</strong><br />
A Brief Guide to Buildout Analysis, and Why and How to do Them<br />
A technical report <strong>of</strong> the CT <strong>NEMO</strong> Program, a part <strong>of</strong> the Center for Land Use Education and Research<br />
Written by John S. Rozum, Chester L. Arnold and Emily H. Wilson
Table <strong>of</strong> Contents<br />
1. Introduction<br />
Purpose........................................................................................................................................................<br />
1<br />
Background...................................................................................................................................................<br />
1<br />
2. <strong>Buildouts</strong>: The Basics<br />
What is a Buildout Analysis.........................................................................................................................<br />
2<br />
Why do a Buildout.......................................................................................................................................<br />
2<br />
What Data and Technical Wizardry Do I Need to Do a Buildout.................................................................<br />
2<br />
The Buildout Process: A Ridiculously Simple Example................................................................................<br />
2<br />
3. Case Studies<br />
Method 1 - A (Slightly) More Realistic Buildout: A Mathematical Method.....................................................<br />
5<br />
Method 2 – A More Realistic Buildout: Using Geographic Information System to Determine Constraints....<br />
7<br />
Method 3 – Spatially-Specific Buildout: Refining the Analysis....................................................................<br />
10<br />
How Do the Methods Compare.................................................................................................................<br />
13<br />
<strong>Buildouts</strong> <strong>of</strong> a Different Stripe.....................................................................................................................<br />
13<br />
Visualization: How to Display the Results <strong>of</strong> a Buildout............................................................................<br />
15<br />
4. Which Buildout Method is best<br />
Appendices<br />
First, what do you want to accomplish......................................................................................................<br />
16<br />
Second, what requirements are needed to meet your goals....................................................................<br />
16<br />
Third, how do you want to use it...............................................................................................................<br />
17<br />
Getting Started............................................................................................................................................<br />
18<br />
Appendix 1: Sources <strong>of</strong> GIS data used in the analyses in this booklet.......................................................<br />
19<br />
Appendix 2: Resources and References....................................................................................................<br />
20<br />
<strong>About</strong> <strong>Buildouts</strong> 2
1. Introduction<br />
Purpose<br />
In recent years in <strong>Connecticut</strong>, there has been considerable concern and debate about “sprawl,” “smart<br />
growth,” and the impacts <strong>of</strong> growth on the state’s communities. This has led to a discussion <strong>of</strong> tools<br />
available to municipal and other land use decision makers that might help them to better plan the growth<br />
<strong>of</strong> their communities. Buildout analyses have been mentioned frequently in this debate.<br />
The recent interest in buildout analysis as a tool for community planning is encouraging. However, there<br />
remains a disconnect between the perception and reality <strong>of</strong> this analysis. The common perception seems<br />
to suggest a monolithic, “one size fits all” tool with automatic benefits for municipal <strong>of</strong>ficials, while the<br />
reality is that the term “buildout” encompasses a wide range <strong>of</strong> techniques, goals, and uses, depending on<br />
the data available, the technology used, and the questions that the analysis is designed to answer.<br />
This publication is intended to help close the gap between perception and reality, serving as a brief guide<br />
reviewing basic information about buildout analyses, including:<br />
<br />
<br />
<br />
<br />
<br />
what they are;<br />
why they’re done;<br />
what type <strong>of</strong> data is needed;<br />
how to do a buildout, and, everybody’s favorite;<br />
so we’ve done one…now what<br />
Although the booklet gives a number <strong>of</strong> examples <strong>of</strong> buildouts and details on the data that went into them,<br />
it is not a step-by-step “cookbook” on how to conduct these types <strong>of</strong> analyses. Rather, it’s intended as a<br />
general guide that might help you to decide if a buildout might be a good tool to use in your town, and if<br />
so, what the major considerations are before you start.<br />
Background<br />
This booklet grew out <strong>of</strong> a 2007 project conducted by the <strong>NEMO</strong> Program for the Office <strong>of</strong> Policy and<br />
Management (OPM) on the feasibility <strong>of</strong> a statewide buildout analysis. The project evaluated the technical<br />
and data requirements needed to do a statewide analysis and, working with the Council <strong>of</strong> Governments<br />
<strong>of</strong> the Central Naugatuck Valley (COGCNV), performed a series <strong>of</strong> analyses on both regional and local<br />
scales. Many <strong>of</strong> the case studies used in this publication came from this project. Others were taken from<br />
the <strong>NEMO</strong> archives.<br />
1
2. <strong>Buildouts</strong>: The Basics<br />
What is a Buildout Analysis<br />
A buildout analysis (“buildout”) is simply a projection <strong>of</strong> how much development would occur in a<br />
community if it were to build on every available acre <strong>of</strong> land allowed by certain constraints. In most cases,<br />
the major governing constraint would be what is allowed under zoning regulations; other constraints can<br />
include environmental and fiscal factors.<br />
A buildout generally is not tied to a specific timeframe, but is rather an “end point” scenario that might<br />
occur in some indefinite future, whether it is in ten years or a hundred. The analysis is most <strong>of</strong>ten used to<br />
estimate future population or number <strong>of</strong> housing units, and the secondary fiscal, environmental or other<br />
impacts <strong>of</strong> this growth. However, buildout analyses can be done in many ways using many different types<br />
<strong>of</strong> data and technology, and for a variety <strong>of</strong> purposes. Depending on the type <strong>of</strong> buildout you pursue, your<br />
“take home” results can be in the form <strong>of</strong> a single number, a table, a graph, a map, or all <strong>of</strong> the above.<br />
Why do a Buildout<br />
An understanding <strong>of</strong> the potential pattern <strong>of</strong> future growth can have wide ranging effects on local<br />
government decisions. Policies from housing to economic development to transportation are all influenced<br />
by the quantity and quality <strong>of</strong> future growth, so the ability to “see into the future” can help local decision<br />
makers make more informed decisions.<br />
Of course, nobody can actually see into the future and buildouts are not some sort <strong>of</strong> black magic that<br />
suspends the laws <strong>of</strong> nature. A buildout is just a tool to help you evaluate a specific planning question you<br />
might have about the consequences <strong>of</strong> current conditions. For example, it can help show how many<br />
houses would be allowed on a particular 10 acre parcel under the current town regulations; or, what would<br />
be the projected town population if we build on every possible acre <strong>of</strong> town. The buildout analysis can help<br />
with the types <strong>of</strong> “what if” questions that can help guide discussions <strong>of</strong> common local issues like open<br />
space planning and future capital improvement needs.<br />
What Data and Technical Wizardry Do I Need to Do a Buildout<br />
A buildout analysis does require some level <strong>of</strong> technical ability and some prior information in order to get to<br />
a meaningful result. The amount <strong>of</strong> each is directly related to the type <strong>of</strong> analysis you want to perform (see<br />
Table 1). At the minimum, you will need a good spreadsheet program and some information about your<br />
town’s zoning requirements and codes. More likely, it will be helpful to have a good knowledge <strong>of</strong> the<br />
amount <strong>of</strong> buildable land in your town. This type <strong>of</strong> geographic analyses will require the use <strong>of</strong> a<br />
geographic information system (GIS) and is best left to those who have the training and ability to perform<br />
them. Numerous classes in GIS are <strong>of</strong>fered statewide.<br />
The Buildout Process: A Ridiculously Simple Example<br />
To help illustrate how buildouts work, let’s look at a very simple example. Let’s say the hypothetical town <strong>of</strong><br />
Squaretown is interested in seeing how their recent zoning regulation update will impact the number <strong>of</strong><br />
<strong>About</strong> <strong>Buildouts</strong> 2
future housing units in town. The first thing they decide to do is look at a map <strong>of</strong> the town’s zoning districts<br />
and figure out how much <strong>of</strong> the town is in each district (Figure 1). Since they have divided the 20,000 acre<br />
town into four equally sized districts, each district is 5,000 acres.<br />
Next they need to know is what the zoning regulations allow in terms <strong>of</strong> density. This requires a perusal <strong>of</strong><br />
the regulations to see how many housing units are allowed per zoning district. In Squaretown, all the land<br />
is zoned for residential uses, with the R-1 zone allowing 1 housing unit per acre, the R-2 zone allowing 1<br />
house per 2 acres, the R-4 zone 1 house per 4 acres and the R-5 allowing a house every 5 acres. By<br />
knowing how much <strong>of</strong> the town is in each zone, we can do some simple arithmetic to determine how<br />
many housing units you can get in each (arrow, Figure 1).<br />
What this buildout analysis tells us is that when every acre <strong>of</strong> available land is built upon using the current<br />
zoning regulations, there will be 9,750 housing units in town. Of course as you have been reading this, you<br />
have probably already started to identify problems with this analysis. First, it assumes that every square<br />
Total Acreage: 20,000 acres<br />
R-1 R-2<br />
R-4 R-5<br />
Zoning Districts<br />
R-1 zone: 1 Unit/acre<br />
R-2 zone: 1 Unit/2 acres<br />
R-4 zone: 1 Unit/4 acres<br />
R-5 zone: 1 Unit/5 acres<br />
Buildout Calculation<br />
R-1: (5,000 acres) X (1 Unit/acre) = 5,000 Units<br />
R-2: (5,000 acres) X (1 Unit/2 acre) = 2,500 Units<br />
R-4: (5,000 acres) X (1 Unit/4 acre) = 1,250 Units<br />
R-5: (5,000 acres) X (1 Unit/5 acre) = 1,000 Units<br />
Total # <strong>of</strong> Units At Buildout = 9,750 Units<br />
Figure 1. A buildout calculation for Squaretown<br />
acre <strong>of</strong> the town can be built upon. How about wetlands, water bodies, or other natural constraints to<br />
development Won’t they have a significant impact on the ability to build Second, this analysis assumes<br />
that the division and development <strong>of</strong> land is 100-percent efficient. But in reality, the location <strong>of</strong> streets and<br />
utilities, as well as the topography <strong>of</strong> the land, means that land division has some inherent inefficiencies<br />
(See More on Efficiency Factors, pg 7). Third, there are no perfectly square towns in <strong>Connecticut</strong>. All these<br />
are valid criticisms, and the science and art <strong>of</strong> buildout analysis is to try to accommodate the reality <strong>of</strong> onthe-ground<br />
conditions to achieve some level <strong>of</strong> verisimilitude. The case studies that follow are examples <strong>of</strong><br />
different buildout techniques used in real <strong>Connecticut</strong> towns that attempt to get a picture <strong>of</strong> future<br />
conditions through an understanding <strong>of</strong> current conditions.<br />
3
3. Case Studies<br />
The best way to get a feel for the issues involved in carrying out a buildout analysis is to look at examples.<br />
So, here are a few examples <strong>of</strong> these analyses, taken from the files <strong>of</strong> the <strong>NEMO</strong> Program. Before we dive<br />
in, a couple <strong>of</strong> considerations.<br />
First, many <strong>of</strong> the case studies presented here were part <strong>of</strong> a study done by the Council <strong>of</strong> Governments<br />
<strong>of</strong> the Central Naugatuck Valley (COGCNV), in partnership with the <strong>NEMO</strong> Program <strong>of</strong> UConn CLEAR. The<br />
project was conducted in 2006 – 2007, funded by the <strong>Connecticut</strong> Office <strong>of</strong> Policy and Management (CT<br />
OPM) for the purpose <strong>of</strong> investigating the feasibility <strong>of</strong> a statewide buildout analysis.<br />
Second, the Town <strong>of</strong> Woodbury (highlighted at right) was chosen to demonstrate a<br />
comparison <strong>of</strong> three buildout methods. Woodbury is a town <strong>of</strong> approximately 9,200<br />
people located in the center <strong>of</strong> <strong>Connecticut</strong>. This town was chosen because <strong>of</strong> all<br />
the 13 towns in the COGCNV region, it had the most up-to-date land use and<br />
property ownership data (parcels), which are necessary in order to run the range <strong>of</strong><br />
buildout techniques. Woodbury served as a relative control to allow the project<br />
principals a way to assess the best approach for towns with less local GIS data.<br />
Finally, this project focused on analysis <strong>of</strong> residential growth, as the most prevalent type <strong>of</strong> growth in this<br />
region and the state overall, and the issue driving the debates on sprawl and smart growth. These<br />
techniques can be applied to commercial and industrial land uses as well.<br />
Table 1. Generalized data requirements for different builldout methods. As the technical<br />
sophistication <strong>of</strong> the method increases, the data requirements also increase.<br />
Type <strong>of</strong> Buildout Data Requirements Data Availability<br />
Mathematical • Local Zoning Local<br />
Simplicity <strong>of</strong> Method<br />
Basic GIS<br />
Spatially Specific GIS<br />
• Local Zoning<br />
• Natural Constraints<br />
(Wetlands, floodplains, etc)<br />
• Committed Open Space<br />
• Developed lands<br />
• Local Zoning<br />
• Natural Constraints<br />
(Wetlands, floodplains, etc)<br />
• Committed Open Space<br />
Local<br />
Statewide<br />
Local/Statewide<br />
Regional/Statewide<br />
Local<br />
Statewide<br />
Local/Statewide<br />
Increased Data Requirements<br />
• Developed lands<br />
Regionally/Statewide<br />
• Parcels<br />
Local - Not generally available<br />
<strong>About</strong> <strong>Buildouts</strong> 4
Again, these are not detailed procedures, but for each example we’ve channeled our Journalism 101<br />
training and included information on who did it, what data they used, when it was done, where it was<br />
applied, and why they did it. Table 1 lists the different buildout methods used in this study and the data<br />
requirements for each. These methods go from the least data intensive method, the mathematical<br />
buildout, to the spatially specific technique that requires the most data. In what follows we will look at how<br />
these different techniques are applied and look at how the results <strong>of</strong> these different methods compare.<br />
With the fine print over with, lets move on to the examples.<br />
Method 1 - A (Slightly) More Realistic Buildout: A Mathematical Method<br />
The simplest approach to a buildout analysis, and the one with the least data requirements, is the<br />
mathematical population estimate. This approach, which requires only the use <strong>of</strong> a spreadsheet, uses the<br />
estimated areas <strong>of</strong> each zoning district along with the allowed “as-<strong>of</strong>-right” densities within those districts.<br />
As-<strong>of</strong>-right uses and densities are typically used in most <strong>of</strong> the buildout methods, since they are the uses<br />
that require no special permit or review.<br />
Step 1: Estimate the Total Number <strong>of</strong> Dwelling Units at Buildout<br />
In order to determine the total number <strong>of</strong> dwelling units the town would have when built out, you first<br />
need to estimate the total area <strong>of</strong> town and the area <strong>of</strong> each zoning district. Areas <strong>of</strong> each zoning<br />
district can be determined by using GIS s<strong>of</strong>tware; however, it is possible to estimate areas for these<br />
districts using traditional approaches such as a planimeter or a grid overlay. The town’s zoning<br />
regulations are used to determine the lot density for each zoning district and the number <strong>of</strong> dwelling<br />
units for each lot. Zoning districts which allow only single family homes have only one dwelling unit per<br />
lot, whereas multifamily districts may have 40 or more dwelling units per lot. The last factor used in this<br />
calculation is a so-called “efficiency factor” (See More on Efficiency Factors, pg 7). The efficiency factor<br />
is used to estimate the effect that land constraints, infrastructure such as roads, and lot layout<br />
inefficiencies have on the final disposition <strong>of</strong> development on the landscape. This factor is a number<br />
between 0 and 1, and was chosen using literature values and best pr<strong>of</strong>essional judgment. Multiplying<br />
these factors together gives you the number <strong>of</strong> possible dwelling units that can be built in the town<br />
under current zoning (Figure 2).<br />
Area <strong>of</strong> Zoning<br />
District<br />
(acres)<br />
Lot Density<br />
(lot/acres)<br />
Dwelling Units<br />
X X X<br />
per Lot<br />
(du/lot)<br />
Efficiency<br />
Factor<br />
=<br />
# <strong>of</strong> Possible<br />
Units<br />
(Dwelling Units)<br />
Figure 2. Equation for the mathematical buildout process. Units are in acres and dwelling units (du).<br />
5
Step 2: Estimate the Total Number <strong>of</strong> New Dwelling Units<br />
New dwelling units were determined by subtracting the number <strong>of</strong> existing dwelling units from the<br />
estimated total number <strong>of</strong> dwelling units in Step 1.<br />
Step 3: Estimate Population at Buildout<br />
Population at buildout is estimated by multiplying the current number <strong>of</strong> persons/dwelling unit by the<br />
number <strong>of</strong> new dwelling units. This number was obtained from the <strong>Connecticut</strong> Department <strong>of</strong><br />
Economic and Community Development’s 2005 Housing Stock estimate (see Resource list at the back<br />
<strong>of</strong> this publication). This estimate <strong>of</strong> population increase was then added to the current population <strong>of</strong><br />
the town in order to give a total population at buildout.<br />
Table 2. is the working spreadsheet for the Woodbury mathematical buildout. The numbers in red<br />
show the number <strong>of</strong> housing units and total population at buildout using 3 different efficiency factors.<br />
Table 2. Sample spreadsheet showing the mathematical buildout method for the Town <strong>of</strong> Woodbury. Since this<br />
analysis was only interested in residential buildout, only the residential zones were analyzed using three different<br />
efficiency factors.<br />
Potential Buildable Lots (3 efficiencies)<br />
# <strong>of</strong> Possible Dwelling Units<br />
Zone<br />
Total Area<br />
(sqft) Acres<br />
DU Density<br />
(Sqft/DU) 50% 60% 70% # DU/Lot 50% 60% 70%<br />
EE 14,300,660 328<br />
GA 3,190,739 73 435,600 3.7 4.4 5.1 40 146 176 205<br />
MQ-A 873,539 20<br />
MQ-B 935,918 21<br />
MQ-C 903,860 21<br />
MQ-D 576,637 13<br />
MQ-E 1,089,765 25<br />
MQ-F 1,156,434 27<br />
MQ-G 798,031 18<br />
MSD 6,520,206 150<br />
OS-100 513,081,919 11,779 100,000 2,565 3,078 3,592 1 2565 3078 3592<br />
OS-60 258,342,992 5,931 60,000 2,153 2,583 3,014 1 2153 2583 3014<br />
OS-80 187,191,631 4,297 80,000 1,170 1,404 1,638 1 1170 1404 1638<br />
PI 5,186,503 119<br />
R-40 29,572,712 679 40,000 370 444 518 1 370 444 518<br />
23,501 Total Potential DU: 6,404 7,685 8,966<br />
Existing<br />
DU* Potential New DU Potential New Popl.** Total B.O. Population<br />
50% 60% 70% 50% 60% 70% 50% 60% 70%<br />
4,104 2,300 3,581 4,862 5,452 8,488 11,523 15,186 18,222 21,257<br />
*Existing Units from COGCNV 2005 Housing stock est<br />
**COGCNV 2005 est. population = 9,734. Est. 2.37 people/DU in 2005<br />
<strong>About</strong> <strong>Buildouts</strong> 6
Method 2 – A More Realistic Buildout: Using Geographic Information System to<br />
Determine Constraints<br />
This buildout method requires the ability to analyze GIS data and have access to some key data sets (see<br />
Table 1). For this analysis, investigators used ESRI’s ArcView® 9.1 s<strong>of</strong>tware to perform all the necessary<br />
analyses coupled with both local and statewide available geographic data. Key data sets include local<br />
zoning districts, committed open space, developed lands, and environmental constraints to development,<br />
such as wetland soils, floodplains, steep slopes, and water resources.<br />
The investigators chose to use the best regionally available data for this analysis (a complete list <strong>of</strong> the data<br />
used is listed in Appendix 1). Zoning districts and regulations were obtained from the towns, digitized if<br />
necessary, and the density attributes <strong>of</strong> each district were incorporated into the zoning data layer.<br />
Environmental constraints are available statewide from the <strong>Connecticut</strong> Department <strong>of</strong> Environmental<br />
Protection. For this analysis, COGCNV had recently updated both the committed open space and<br />
developed lands layers, and they were assessed to be more accurate than the statewide information, so<br />
the investigators used these data sets.<br />
Step 1: Establish available buildable lands<br />
The determination <strong>of</strong> which lands are available for future development starts with the identification <strong>of</strong><br />
those areas that are not available. The unavailable lands include those lands already developed, those<br />
that are in permanently committed open<br />
space, and lands that have significant<br />
environmental constraints. For this analysis,<br />
the environmental constraints chosen<br />
included wetland soils, floodplains, water<br />
bodies and slopes over 20 percent. These<br />
unavailable lands were aggregated and<br />
geographically removed from the total land<br />
area. The remainder is the area that is<br />
currently undeveloped and available for<br />
future development (See The Buildable<br />
Lands Anaysis, pg 9).<br />
Step 2: Apply zoning-based coefficients to<br />
buildable lands<br />
The buildable lands data layer from Step 1<br />
was then “intersected” with the zoning layer<br />
to determine the current zoning and lot<br />
density allowed on these lands. Given that<br />
this analysis is only considering residential<br />
lands, non-residential zones (i.e.<br />
commercial and industrial) were removed<br />
200-acre parcel in<br />
1-acre residential zone<br />
Parcel after development<br />
supports 117 lots<br />
7
from the buildable lands data layer. Mixed use areas, that is areas that have a combination <strong>of</strong><br />
commercial and residential uses, were retained, but only the estimated residential densities in these<br />
areas were used.<br />
Step 3: Calculate number <strong>of</strong> new dwelling units<br />
Similar to the process in Method 1, a calculation was made to determine the number <strong>of</strong> new dwelling<br />
units based on the total area <strong>of</strong> buildable land in a given zoning district. Because <strong>of</strong> the inefficiency <strong>of</strong><br />
lot layout during actual subdivision design, as well as the inclusion <strong>of</strong> infrastructure such as roads and<br />
stormwater management areas, an efficiency factor was still applied to these calculations, despite the<br />
fact that environmental constraints were already factored in. To make reasoned judgments on the<br />
appropriate efficiency factor to use for a town, the local planner was consulted. These factors ranged<br />
from 70% in urban areas to 60% or less in more suburban areas. Population at buildout was then<br />
estimated as in the equation used for Method 1 (Figure 2).<br />
<strong>About</strong> <strong>Buildouts</strong> 8
The Buildable Lands Analysis<br />
The first step in the GIS-based buildout is to determine the amount and location <strong>of</strong> lands available and<br />
suitable for development. This analysis, sometimes called the “buildable lands” analysis, is essentially an<br />
exercise in subtraction, beginning with all the land in the town and subtracting each GIS data layer that<br />
symbolizes lands that cannot support future development.<br />
You start with all the land within the town boundary.<br />
Remove lands that are currently developed.<br />
Next remove out open space lands that are under<br />
permanent protection.<br />
Then remove lands with environmental constraints. Here<br />
we used wetlands, water bodies and steep slopes.<br />
What you end up with (in green) are all the lands<br />
available and suitable for development. This forms<br />
the basis for your buildout.<br />
9
Method 3 – Spatially-Specific Buildout: Refining the Analysis<br />
The GIS buildout gives you an estimate <strong>of</strong> how much future development might occur, but doesn’t give<br />
you much <strong>of</strong> a feel for where it will occur on the landscape. In order to perform a more spatially specific<br />
buildout analysis, the investigators needed both more geographic data than in the above methods, and a<br />
cutting-edge GIS tool that would allow a finer scale evaluation <strong>of</strong> where future buildings can be placed.<br />
Although there are several s<strong>of</strong>tware packages available, the investigators used CommunityViz, which<br />
works as an extension to ESRI’s ArcGIS ® products. CommunityViz provides GIS-based analysis and realworld<br />
3D modeling that allow people to envision land use alternatives and understand their potential<br />
impacts, explore options and share possibilities, and examine scenarios from all angles — environmental,<br />
economic, and social. The program provides a “wizard-based” interface, greatly simplifying the GIS<br />
procedures necessary to complete a buildout analysis, while allowing the user significant opportunities to<br />
customize a given analysis. CommunityViz does require, however, additional data in order to be fully<br />
effective and requires some additional training for the GIS technician.<br />
In addition to the geographic data sets used in Method 2, detailed property ownership and building data<br />
were needed (See Table 1). These so-called planimetric data were only available in the town <strong>of</strong> Woodbury.<br />
Step 1: Merge parcel and zoning data layers<br />
The parcel data represents individually owned sections <strong>of</strong> land. The first step in the analysis was to<br />
merge the zoning and the parcel layers together. This allowed the program to calculate what the zoned<br />
density was for a given parcel <strong>of</strong> land. This is important since many parcels are considerably larger<br />
than the minimum lot size for the zone; therefore, the parcel could conceivably be split to allow<br />
additional lots.<br />
Step 2: Identify constraints<br />
CommunityViz works in a somewhat automated manner, but requires the user to establish and identify<br />
several key factors. One <strong>of</strong> these are the constraints to development. As in Method 2, these include<br />
environmental constraints, committed open space and landed not zoned for residential development.<br />
See Method 2 and Appendix 1 for a complete list <strong>of</strong> the data layers used as constraints in this step.<br />
Step 3: Identify currently developed parcels<br />
To identify which parcels were developed, building point data was used to assess the intensity <strong>of</strong><br />
building on the lot. Building points are point data the shows where buildings are located in a parcel.<br />
This determines whether this parcel could be subdivided in the future. For example, under current<br />
zoning a single family home on a 4-acre parcel in an area zoned for 2-acre lots could potentially be<br />
further subdivided to allow another home. In order to complete this analysis, building points that<br />
represented residences had to be separated from points that represented outbuildings, garages or<br />
sheds (see Figure 3).<br />
Step 4: Configure CommunityViz with zoning data<br />
In order to run the analysis, CommunityViz needs to be configured with the density and lot<br />
specifications for each zoning district. These specifications included units per acre, dwelling units per<br />
<strong>About</strong> <strong>Buildouts</strong> 10
uilding, setbacks and minimum separation distance. As with the other buildout methods, an efficiency<br />
factor was assigned after consultation with the town planner.<br />
Step 5: Run the buildout wizard<br />
Once CommunityViz is configured, the user simply runs the analysis wizard. The output <strong>of</strong> the analysis<br />
includes tabular data <strong>of</strong> number <strong>of</strong> units and population at buildout and a map showing where the new<br />
homes could conceivably be placed in town (Figure 4).<br />
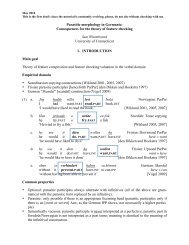
Figure 3. Screen capture <strong>of</strong> a the CommunityViz buildout program. In the window shown above the purple<br />
lines show parcel boundaries, red dots show existing buildings, and green houses potential future building<br />
locations. The aerial photo underneath the data layers shows the existing use <strong>of</strong> the land.<br />
11
Figure 4. ComunityViz buildout for Woodbury, CT. Map on the right shows the buildout for Woodbury.<br />
Inset map shows a close up <strong>of</strong> one section <strong>of</strong> town showing both existing (red dots) and predicted (green<br />
icons) housing sites.<br />
<strong>About</strong> <strong>Buildouts</strong> 12
How Do the Methods Compare<br />
The results or output <strong>of</strong> a buildout analysis are determined by the questions you have asked at the<br />
beginning <strong>of</strong> the process. In this exercise, we asked what the increase in population and dwelling units<br />
would be in Woodbury at buildout. In order to compare the different methods, the investigators used the<br />
town <strong>of</strong> Woodbury as the example and used the number <strong>of</strong> dwelling units and the population at buildout<br />
as the final output. Table 3, below, shows the number <strong>of</strong> dwelling units and estimated population <strong>of</strong><br />
Woodbury at buildout.<br />
As expected there is considerable variation between buildout methods. The simple mathematical method<br />
used no geospatial information to arrive at its results, using an “efficiency factor” to approximate the effects<br />
<strong>of</strong> various cultural and environmental constraints. Table 3 shows that the final buildout population varied<br />
considerably when using efficiency factors <strong>of</strong> 50 and 70%. The basic GIS method, which subtracts<br />
environmental and cultural constraints to determine the amount <strong>of</strong> buildable land, arrived at a buildout<br />
population somewhat greater than the 50% efficient mathematical buildout, but less that the 70% efficient<br />
buildout. The final and most technically sophisticated method, the spatially specific CommunityViz buildout,<br />
had the smallest buildout population. The reasons for this smaller number, only 50% greater than<br />
Woodbury’s current population, is probably multifold, but principally lies in the use <strong>of</strong> setbacks and road<br />
frontages to determine future building sites and thus the final population at buildout. This additional level <strong>of</strong><br />
constraint, one that exists in the real world <strong>of</strong> local land development, is what makes CommunityViz a<br />
compelling tool.<br />
Table 3. Estimated population <strong>of</strong> Woodbury, CT at buildout using three different buildout methods.<br />
Mathematical Method Basic GIS CommunityViz<br />
Efficiency<br />
Factor Method<br />
Method<br />
50% 70%<br />
Potential New DU 2299 4863 2656 2012<br />
Existing DU 4104 4104 4104 4104<br />
Potential New Population 5517 11617 6374 4828<br />
Current Population 9734 9734 9734 9734<br />
Buildout Population 15251 21351 16108 14562<br />
% Population Increase 57% 119% 65% 50%<br />
<strong>Buildouts</strong> <strong>of</strong> a Different Stripe<br />
Up to this point all <strong>of</strong> the case studies have focused on population or housing based buildouts, but this<br />
planning technique is not limited to only those “future” indicators. Indeed, the buildout technique can be<br />
applied to any land development or policy question that is dependent upon the use <strong>of</strong> the land. One<br />
buildout technique we have used for years in the <strong>NEMO</strong> program is that <strong>of</strong> an impervious surface buildout.<br />
Impervious surfaces - like roadways, parking lots and ro<strong>of</strong>tops - have been shown to be a key indicator <strong>of</strong><br />
the health <strong>of</strong> water resources. The buildout technique can be used to assess how current regulations<br />
<strong>About</strong> <strong>Buildouts</strong> 13
would influence the amount <strong>of</strong> future impervious surfaces in a watershed and hence the future impact on<br />
streams and rivers (Figure 5).<br />
Existing<br />
Future<br />
PERCENT<br />
IMPERVIOUS<br />
> 25%<br />
10 to 24.9%<br />
0 to 9.9%<br />
Figure 5. Impervious buildout analysis <strong>of</strong> Old Saybrook, CT. The figure on the left show existing impervious cover colored<br />
according to research-based water quality thresholds. The figure at right shows impervious cover at buildout, using the<br />
town’s current land use regulations to estimate density. Black lines are local watershed boundaries.<br />
In another case, researchers at the Center for Land Use Education and Research (CLEAR) at the <strong>University</strong><br />
<strong>of</strong> <strong>Connecticut</strong> were interested in the potential impact <strong>of</strong> future development on <strong>Connecticut</strong> forests. Large<br />
blocks <strong>of</strong> forest land tend to support higher quality habitat for many native species and provide wood and<br />
other renewable resources that support local economies. CLEAR investigators used the buildout technique<br />
to determine where future growth would occur and how it might potentially effect the forest (Figure 6).<br />
Other buildouts in the state have gone beyond the town boundaries, focusing on watersheds or regional<br />
planning districts or looking at other impacts <strong>of</strong> growth, such as the cost <strong>of</strong> community services. The<br />
buildout analysis can be used as a tool to assess a variety <strong>of</strong> questions you may have about the future <strong>of</strong><br />
your community. Implicit in these analyses, as we have seen, are some fundamental assumptions about<br />
how your town or region will grow. The art <strong>of</strong> the buildout resides in making (and explicitly stating) these<br />
assumptions clearly and logically.<br />
Figure 6. Forest fragmentation map <strong>of</strong> the town <strong>of</strong> Marlborough for three dates. As the population <strong>of</strong> the town<br />
increases, new dwellings begin to carve into the unfragmented forest (green) and convert it into smaller, more<br />
perforated patches (yellow). This analysis was done using a feature <strong>of</strong> the CommunityViz s<strong>of</strong>tware that allows the<br />
user to set rules for how the buildout will take place over a specified time period (in this case 30 years).<br />
<strong>About</strong> <strong>Buildouts</strong> 14
Visualization: How to Display the Results <strong>of</strong> a Buildout<br />
Once you have an analysis completed, the next step is to develop a set <strong>of</strong> maps and tables that will<br />
communicate the results <strong>of</strong> the study in a meaningful way. The maps and tables used in the case studies<br />
are <strong>of</strong>ten the way these data end up getting presented to the public. However, new tools are becoming<br />
available that help to give an even more “intuitive” sense <strong>of</strong> what buildout conditions may bring.<br />
The NOAA Coastal Services Center, working with <strong>NEMO</strong> and CLEAR, has developed a series <strong>of</strong><br />
visualizations <strong>of</strong> the Woodbury CommunityViz buildout (See page 10) using GoogleEarth, a freely available<br />
landscape visualization tool. The visualization in Figure 7 shows the same information presented in the<br />
previous analysis, but by placing these data on a landscape with aerial photography and topography, the<br />
viewer can more quickly get a sense <strong>of</strong> the scale <strong>of</strong> the buildout. By allowing users to pan, zoom and fly<br />
through the landscape,these visualization tools can help the public grasp and understand the results <strong>of</strong> an<br />
analysis.<br />
Figure 7. This perspective <strong>of</strong> the Woodbury, CT buildout is roughly in the same location as shown in Figures 3 & 4<br />
and shows buildable areas (gray polygons with red outlines) and all buildings (existing buildings are yellow house<br />
icons and potential buildings are green pin icons). Data from the buildout project were projected in GoogleEarth<br />
to create this image.<br />
<strong>About</strong> <strong>Buildouts</strong> 15
4. Which Buildout Method is best<br />
First, what do you want to accomplish<br />
The key driver <strong>of</strong> a buildout is not a technical one but rather figuring out what are you trying to accomplish<br />
by doing the analysis. Only by having a specific set <strong>of</strong> goals or questions that the analysis is designed to<br />
answer is it possible to select the proper method to use. For instance, if you just want to estimate the<br />
ultimate number <strong>of</strong> school children in the town, you may want to choose the mathematical buildout, or<br />
even skip the buildout in favor <strong>of</strong> using demographic trends. When we wanted to focus on the impact <strong>of</strong><br />
development on water resources, the <strong>NEMO</strong> team developed an impervious cover buildout analysis (page<br />
14), which told us nothing about school children but a whole lot about pavement and stormwater run<strong>of</strong>f.<br />
However, if your objectives are to shed light on critical land use planning issues, then the method you<br />
choose should have some level <strong>of</strong> geographic specificity. All <strong>of</strong> the buildout methods we used provided a<br />
seemingly reasonable final number, but the level <strong>of</strong> geographic specificity varied widely. This allows<br />
decision makers to easily observe where in their town or region future development may occur, and allows<br />
for specific decisions to be made, even down to the parcel level in some cases. For example, the<br />
advantage in having a buildout when doing open space planning would be to allow planners to look at the<br />
development potential for a given section <strong>of</strong> town. For economic development planning, knowing where<br />
there are plentiful amounts <strong>of</strong> developable land next to transportation corridors would also be a useful<br />
planning tool.<br />
Second, what requirements are needed to meet your goals<br />
Accuracy: As noted, most buildout analyses, by definition, assess the ultimate developed condition at<br />
some indefinite future. So, until a town is finally built out, it is impossible to determine the “accuracy” <strong>of</strong> the<br />
estimates provided by the analysis. One must use the best data and the most likely assumptions, leavened<br />
with best pr<strong>of</strong>essional judgment, and accept the results for what they are – an approximation. There exist<br />
versions <strong>of</strong> buildouts that use trends like population growth to project into the future, and these can give<br />
you “intermediary” snapshot estimates <strong>of</strong> where your town might be 5, 10 or 30 years from the present; in<br />
fact, the CommunityViz s<strong>of</strong>tware we used has a “time scope” wizard that can help you to do this. These<br />
studies can be useful, but because they depend on an even greater number <strong>of</strong> assumptions, they are even<br />
more subject to variation.<br />
Accurate prediction <strong>of</strong> the future, however, is not the ultimate goal <strong>of</strong> a buildout. Rather, the buildout<br />
method is nothing more than a tool to assess the effect <strong>of</strong> the current regulatory environment on future<br />
development <strong>of</strong> land. Through the use <strong>of</strong> this tool, you can start to determine if your regulations, which are<br />
the implementation guidelines for your land use plans, are really achieving the goals you have set for your<br />
community. If you feel they are not, you can make changes to those regulations, which in turn will help<br />
change how future development unfolds. So the buildout analysis tells us more about present aspirations<br />
than it does about the future.<br />
<strong>About</strong> <strong>Buildouts</strong> 16
Data: Clearly as the level <strong>of</strong> specificity increased, the data requirements and the level <strong>of</strong> expertise needed<br />
also increased. Any entity contemplating the cost/benefit <strong>of</strong> conducting a buildout must first factor in<br />
where each needed data layer is going to come from, and at what cost.<br />
The need for digital data creation, even with the simplest method, is perhaps the biggest gap in<br />
undertaking a buildout analysis. What is apparent from this study is that even the simplest buildout, the<br />
mathematical method, would require some data creation, in the form <strong>of</strong> digitized zoning maps. The basic<br />
GIS method (Method #2) also requires a zoning layer. The other data sets needed for Method #2 (open<br />
space, environmental constraints, land use or land cover) are currently available in some form, statewide,<br />
but the current open space and land cover data leave something to be desired for this particular use.<br />
Higher resolution land use/land cover and an up-to-date committed open space layer – as were supplied<br />
by COGCNV in previous case studies – would make the analysis more relevant and accurate. Method #3,<br />
the spatially specific method, has the highest data and technical requirements. In addition to the data sets<br />
above, this method is most effective with a parcel layer (property boundaries) and with planimetric data,<br />
such as building footprints, roads and other structures. Although this spatial specificity is highly desirable<br />
for local visioning and planning, it requires a considerable investment and a high level <strong>of</strong> expertise from the<br />
technicians charged with doing the analysis.<br />
Third, how do you want to use it<br />
Outputs: Related to site specificity is another key aspect <strong>of</strong> a useful buildout analysis – how important is<br />
it that your analysis have a compelling visual output As noted, the value <strong>of</strong> a buildout is not in providing<br />
answers, but in stimulating discussion about intended and unintended impacts <strong>of</strong> current land use plans. If<br />
you envision your discussions as staff-only pr<strong>of</strong>essional debates, then maybe a graph can suffice.<br />
However, if as in most cases the buildout results will serve as a springboard to land use commission<br />
discussions, public meetings and public hearing, the ability to visualize the impacts predicted by your<br />
analysis is critical to engendering understanding and forward progress.<br />
Use: The CLEAR <strong>NEMO</strong> program has conducted many town-level buildout analyses, starting with our<br />
impervious surface buildout analysis over 15 years ago, and more recently using CommunityViz to do<br />
geographically-specific buildouts in towns like East Haddam and the towns in the Niantic watershed. Our<br />
experience has been that by stimulating discussion these analyses, like many other good tools, actually<br />
create more questions than they answer. However, that is the nature <strong>of</strong> local land use planning. A wellconstructed<br />
buildout analysis provides important fodder for discussion about plans, regulations and<br />
policies.<br />
<strong>About</strong> <strong>Buildouts</strong> 17
Getting Started<br />
The hardest part <strong>of</strong> any complicated job is getting started and a buildout analysis for a community can be<br />
a daunting task. The key to success is to be organized and have very clear goals. We would suggest<br />
organizing a small workgroup comprised <strong>of</strong> people with backgrounds in the technical (i.e. people familiar<br />
with GIS or spreadsheets) and policy aspects <strong>of</strong> the analysis. Start by discussing why a buildout is<br />
necessary and what questions you would like answered by the analysis. Are you concerned about<br />
environmental impacts, fiscal impacts or school planning With a clear idea <strong>of</strong> what you want to<br />
accomplish, the data needed and the process will fall into place.<br />
Of course, once you have completed your analysis don’t hide your accomplishments – show it to the<br />
world! In particular keep your town commissions informed about what you are doing and what you have<br />
found. Be up-front about your assumptions. Interacting with town citizens and commissions will help to<br />
improve your analysis through critical inquiry and discussion. These analyses are <strong>of</strong>tentimes iterative<br />
processes that require several passes before a good final product is produced. Feel free to use the<br />
examples and explanations in this guide to help you communicate the process to your fellow citizens.<br />
That’s what its for.<br />
The key is to get started. Ask questions <strong>of</strong> pr<strong>of</strong>essionals in town or at the regional planning agency. They<br />
are trained in these analyses and may be able to help. In the back <strong>of</strong> this guide are some other resources<br />
to help guide you in the process. Good luck and happy analyzing!<br />
Assemble<br />
Workgroup<br />
Final Analysis<br />
Develop Goals<br />
Public Input<br />
Assign Tasks<br />
and Deadlines<br />
Preliminary<br />
Analysis<br />
<strong>About</strong> <strong>Buildouts</strong> 18
Appendices<br />
Appendix 1: Sources <strong>of</strong> GIS data used in the analyses in this booklet<br />
Listing <strong>of</strong> GIS data used and sources <strong>of</strong> the information.<br />
Method 1: Simple Mathematical Model<br />
Local zoning<br />
COGCNV’s uniform zoning<br />
Method 2: Basic GIS Method<br />
Local zoning<br />
COGCNV’s uniform zoning<br />
Slope<br />
U.S. Geological Service Digital Elevation Model<br />
100-year Floodplains Federal Emergency Management Agency, 1998<br />
Wetlands<br />
U.S.Department <strong>of</strong> Agriculture Soils Survey<br />
Hydrology<br />
<strong>Connecticut</strong> Department <strong>of</strong> Environmental Protection<br />
Committed Open Space COGCNV’s uniform zoning<br />
Developed Land<br />
COGCNV’s 2004 Land Use<br />
Method 3: Spatially Specific GIS Method<br />
All the data layers used in Method 2, plus:<br />
Parcels<br />
Building points<br />
Town <strong>of</strong> Woodbury<br />
Town <strong>of</strong> Woodbury<br />
<strong>About</strong> <strong>Buildouts</strong> 19
Appendix 2: Resources and References<br />
<strong>Connecticut</strong> Center for Land Use Education and Research<br />
(CLEAR)<br />
<strong>Connecticut</strong> Community Resource Inventory Online<br />
U.S. EPA Green Communities: How to do a buildout<br />
analysis<br />
State <strong>of</strong> Massachusetts Smart Growth and Urban Environments:<br />
Buildout Book<br />
<strong>Connecticut</strong> Department <strong>of</strong> Environmental Protection:<br />
Tools for Municipalities<br />
<strong>Connecticut</strong> Office <strong>of</strong> Policy and Management, Office <strong>of</strong><br />
Responsible Growth (state plan <strong>of</strong> conservation and development)<br />
<strong>Connecticut</strong> Department <strong>of</strong> Economic and Community<br />
Development (census information and town pr<strong>of</strong>iles)<br />
http://clear.uconn.edu<br />
http://clear.uconn.edu/projects/cri/<br />
http://www.epa.gov/greenkit/build_out.htm<br />
http://commpres.env.state.ma.us/content/buildout<br />
book.asp#<br />
http://www.ct.gov/dep/cwp/view.aspa=2703&q=3902<br />
48&depNav_GID=1634&depNav=|<br />
http://www.ct.gov/opm/cwp/view.aspa=2990&q=<br />
385462&opmNav_GID=1807<br />
http://www.ct.gov/ecd/cwp/view.aspa=1106&q=2<br />
51024&ecdNav=|<br />
<strong>About</strong> <strong>Buildouts</strong> 20
<strong>About</strong> <strong>Buildouts</strong> 21
<strong>NEMO</strong> is an educational program <strong>of</strong> the <strong>University</strong> <strong>of</strong> <strong>Connecticut</strong>, Cooperative Extension System, <strong>Connecticut</strong> Sea Grant College Program and the Natural Resources<br />
Management and Engineering Department. In addition to support from UConn, <strong>NEMO</strong> is funded by grants from the CT DEP Nonpoint Source Program,<br />
the NOAA <strong>Connecticut</strong> Sea Grant College Program and the CT Office <strong>of</strong> Policy and Management. <strong>NEMO</strong> is a program <strong>of</strong> the Center for Land Use Education and<br />
Reasearch (CLEAR) Land, Sea and Space Grant collaborating. For more informaiton about CLEAR visit clear.uconn.edu. 07-07 CLEAR publication #081015.1<br />
© 2008 <strong>University</strong> <strong>of</strong> <strong>Connecticut</strong>. The <strong>University</strong> <strong>of</strong> <strong>Connecticut</strong> supports all state and federal laws that promote equal opportunity and prohibit discrimination.