Clinical Rehabilitation - King's College London
Clinical Rehabilitation - King's College London
Clinical Rehabilitation - King's College London

You also want an ePaper? Increase the reach of your titles
YUMPU automatically turns print PDFs into web optimized ePapers that Google loves.
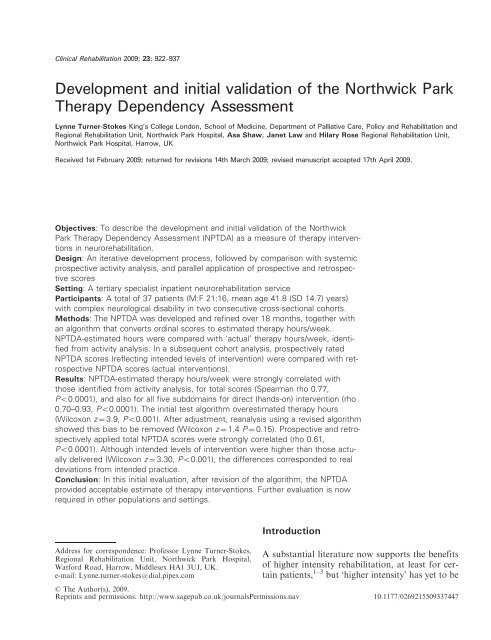
<strong>Clinical</strong> <strong>Rehabilitation</strong> 2009; 23: 922–937<br />
Development and initial validation of the Northwick Park<br />
Therapy Dependency Assessment<br />
Lynne Turner-Stokes King’s <strong>College</strong> <strong>London</strong>, School of Medicine, Department of Palliative Care, Policy and <strong>Rehabilitation</strong> and<br />
Regional <strong>Rehabilitation</strong> Unit, Northwick Park Hospital, Asa Shaw, Janet Law and Hilary Rose Regional <strong>Rehabilitation</strong> Unit,<br />
Northwick Park Hospital, Harrow, UK<br />
Received 1st February 2009; returned for revisions 14th March 2009; revised manuscript accepted 17th April 2009.<br />
Objectives: To describe the development and initial validation of the Northwick<br />
Park Therapy Dependency Assessment (NPTDA) as a measure of therapy interventions<br />
in neurorehabilitation.<br />
Design: An iterative development process, followed by comparison with systemic<br />
prospective activity analysis, and parallel application of prospective and retrospective<br />
scores<br />
Setting: A tertiary specialist inpatient neurorehabilitation service<br />
Participants: A total of 37 patients (M:F 21:16, mean age 41.8 (SD 14.7) years)<br />
with complex neurological disability in two consecutive cross-sectional cohorts.<br />
Methods: The NPTDA was developed and refined over 18 months, together with<br />
an algorithm that converts ordinal scores to estimated therapy hours/week.<br />
NPTDA-estimated hours were compared with ‘actual’ therapy hours/week, identified<br />
from activity analysis. In a subsequent cohort analysis, prospectively rated<br />
NPTDA scores (reflecting intended levels of intervention) were compared with retrospective<br />
NPTDA scores (actual interventions).<br />
Results: NPTDA-estimated therapy hours/week were strongly correlated with<br />
those identified from activity analysis, for total scores (Spearman rho 0.77,<br />
P50.0001), and also for all five subdomains for direct (hands-on) intervention (rho<br />
0.70–0.93, P50.0001). The initial test algorithm overestimated therapy hours<br />
(Wilcoxon z ¼ 3.9, P50.001). After adjustment, reanalysis using a revised algorithm<br />
showed this bias to be removed (Wilcoxon z ¼ 1.4 P ¼ 0.15). Prospective and retrospectively<br />
applied total NPTDA scores were strongly correlated (rho 0.61,<br />
P50.0001). Although intended levels of intervention were higher than those actually<br />
delivered (Wilcoxon z ¼ 3.30, P50.001), the differences corresponded to real<br />
deviations from intended practice.<br />
Conclusion: In this initial evaluation, after revision of the algorithm, the NPTDA<br />
provided acceptable estimate of therapy interventions. Further evaluation is now<br />
required in other populations and settings.<br />
Address for correspondence: Professor Lynne Turner-Stokes,<br />
Regional <strong>Rehabilitation</strong> Unit, Northwick Park Hospital,<br />
Watford Road, Harrow, Middlesex HA1 3UJ, UK.<br />
e-mail: Lynne.turner-stokes@dial.pipex.com<br />
Introduction<br />
A substantial literature now supports the benefits<br />
of higher intensity rehabilitation, at least for certain<br />
patients, 1–3 but ‘higher intensity’ has yet to be<br />
ß The Author(s), 2009.<br />
Reprints and permissions: http://www.sagepub.co.uk/journalsPermissions.nav 10.1177/0269215509337447
Development of Northwick Park Therapy Dependency Assessment 923<br />
properly defined. Patients with neurological disabilities<br />
have widely varying needs for rehabilitation,<br />
often involving several disciplines. Simply<br />
recording hours of therapy input has little meaning<br />
unless the nature of interventions can be also<br />
be described. Many authors have called for<br />
practice-based research to ‘open the black box’,<br />
in order to provide clearer description of the rehabilitation<br />
content. 4 A number of tools have been<br />
developed to facilitate the systematic recording of<br />
therapy interventions, 5–12 which include tools to<br />
describe the type of interventions offered for<br />
patients with stroke 5,7–10 and spinal cord<br />
injury. 11,12 However, these can only be applied to<br />
describe interventions that were actually given,<br />
rather than looking at what might be needed.<br />
Moreover, existing tools focus only on physical<br />
interventions (physiotherapy, occupational therapy<br />
and in some cases speech and language<br />
therapy 8 ) and omit other interventions such as<br />
psychology, dietetics and social work, which play<br />
an important role in holistic neurological rehabilitation<br />
programmes.<br />
Since the mid-1990s, work has been underway at<br />
Northwick Park Hospital in the UK to develop a<br />
comprehensive set of tools for rehabilitation,<br />
which are practical to apply in the course of routine<br />
clinical practice; and which may be used to<br />
measure nursing and therapy intervention, in<br />
relation to need, and to quantify this in terms of<br />
staff time. A common underlying principle of these<br />
instruments is that they are designed to be applied<br />
both prospectively to measure ‘needs’ for rehabilitation<br />
intervention, and retrospectively to<br />
describe what the patient actually ‘gets’, so that<br />
in future they could be applied as a framework<br />
for quantifying gaps in service provision. They<br />
also include a computerized algorithm, which<br />
translates the description of dependency into a<br />
generic estimation of implications for staff time.<br />
The Northwick Park Nursing Dependency Scale<br />
(NPDS) was published in 1999 as a tool to assess<br />
nursing needs of patients in rehabilitation settings.<br />
It translates, by means of a computerized<br />
algorithm (the Northwick Park Care Needs<br />
Assessment) into an estimate of care hours<br />
required. 13 It is shown to be a valid measure of<br />
nursing needs 14,15 and has been increasingly<br />
applied in the context of routine clinical practice<br />
in the UK, 16 as well as abroad. 17<br />
In 2004, a project grant was awarded by the UK<br />
Department of Health (Grant ref. 030/0066) to<br />
develop an equivalent tool to assess therapy<br />
dependency. 18 The Northwick Park Therapy<br />
Dependency Assessment (NPTDA) was developed<br />
through an iterative process over two years.<br />
This paper provides a brief description of its<br />
development and initial validation.<br />
Methods<br />
Tool development<br />
The setting for this development and initial<br />
evaluation was the Regional <strong>Rehabilitation</strong> Unit<br />
at Northwick Park Hospital. The unit provides a<br />
tertiary specialist inpatient neurorehabilitation<br />
service for younger adults (mainly aged 16–65<br />
years) with complex neurological disabilities. An<br />
experienced multidisciplinary staff team includes<br />
specialty-trained rehabilitation doctors and<br />
nurses; and a range of allied health professions<br />
which include physiotherapy, occupational therapy,<br />
speech and language therapy, psychology,<br />
dietetics, and social work, all of whom contributed<br />
to the project. Ethics permission was obtained<br />
from the Local Research Ethics Committee.<br />
Development of the NPTDA involved an<br />
iterative process of consultation with senior<br />
multidisciplinary team members to identify the<br />
factors that describe requirements for different<br />
levels of therapy intervention. This led to the<br />
development of a draft tool in 2004. Over the<br />
next 18 months, successive periods of crosssectional<br />
application of the tool provided an extensive<br />
prospective observational dataset. Refinement<br />
through serial analysis and team reflection in the<br />
context of clinical use ensured content validity for<br />
this setting, and the NPTDA evolved to its final<br />
form in late 2005. A full description of the early<br />
development and testing process is beyond the<br />
scope of this article, but is detailed in the Department<br />
of Health project report. 18<br />
The Northwick Park Therapy Dependency<br />
Assessment (NPTDA) tool<br />
The NPTDA is a measure of therapy intervention<br />
designed for use in specialist neuro-rehabilitation<br />
settings, where high intensity rehabilitation is<br />
provided by a multidisciplinary team.
924 L Turner-Stokes et al.<br />
Key principles of the tool are as follows:<br />
It includes 30 items of therapy dependency<br />
in seven domains (A–G), which are shown in<br />
Appendix 1. The total range of the score is<br />
0–100.<br />
– Items in domains A–E record direct ‘handson’<br />
patient care. They are each scored on a<br />
range of 0–4, according to the general scale<br />
structure illustrated in Appendix 1.<br />
– Items in domain F record indirect patientrelated<br />
care (e.g. attending meetings, writing<br />
reports, etc. which may be conducted away<br />
from the patients), and additional activities<br />
such as groups or staff-escorted clinic attendance.<br />
These items are scored on a range of<br />
0–2.<br />
– Items in domain G are ‘text only’ and record<br />
the use of special facilities/equipment, investigations<br />
and procedures, for the purpose of<br />
audit and coding.<br />
Each patient is rated individually, the scores for<br />
each item being based on the interventions for a<br />
one-week period. A scoring manual provides<br />
detailed level descriptions for each item.<br />
Therapists are encouraged to rely primarily on<br />
these descriptions, but in order to provide a<br />
rough guide to assist scoring, approximate<br />
time ranges have also been ascribed to each<br />
scoring level (see Appendix 1b). These were<br />
defined through observational analysis during<br />
development and they vary somewhat across<br />
the different items.<br />
The data are entered into an electronic database<br />
which applies a computerized algorithm to estimate<br />
the therapy hours for each level of each<br />
item. (This paper will describe how the algorithm<br />
was developed.)<br />
– For score levels 1–3, the algorithm applies<br />
predetermined hours which are allocated to<br />
the lead discipline identified. A default lead<br />
discipline is suggested for each item, but this<br />
may be changed to reflect normal practice<br />
within a given setting.<br />
– Level 4 (and level 3.5, which was added as a<br />
result of this evaluation) reflect<br />
interdisciplinary working where several different<br />
disciplines are working in collaboration<br />
on the same task area (item). In this<br />
case, the hours are specified individually for<br />
each discipline on the scoring sheet at the<br />
time of rating.<br />
The allocated times are summed to provide an<br />
estimate of the total therapy hours and also provide<br />
a breakdown of hours for each discipline.<br />
As noted above, the NPTDA is designed to be<br />
applied in various ways depending on the intended<br />
purpose of measurement. For the assessment<br />
of therapy needs, NPTDA scores may be applied<br />
prospectively, based on the judgement of the therapy<br />
team in respect of the level of input required.<br />
For the assessment of therapy interventions,<br />
NPTDA scores may be applied retrospectively,<br />
based on the levels of intervention actually<br />
provided. In this way it is theoretically possible<br />
to record both, and to compare the needs for intervention<br />
with the levels of input provided<br />
(see Discussion).<br />
Validation<br />
This initial validation took part in two stages:<br />
1) In the first stage, we validated the NPTDA<br />
scores, and refined the conversion algorithm<br />
for translating raw scores into therapy hours,<br />
by comparing retrospectively applied NPTDA<br />
estimates of therapy intervention with the<br />
actual hours of therapy intervention –<br />
recorded through parallel systematic activity<br />
analysis.<br />
2) In the second stage, using a subsequent cohort<br />
of patients, we compared prospective and retrospective<br />
NPTDA ratings, recorded in parallel<br />
for the same treatment period, to examine<br />
the validity of prospective application.<br />
Stage 1: Comparison of NPTDA-estimated hours<br />
with activity analysis<br />
Design and participants<br />
In a cross-sectional cohort analysis, routinely<br />
rated NPTDA scores for all inpatients on the
Development of Northwick Park Therapy Dependency Assessment 925<br />
unit were compared with the results of activity<br />
analysis for the same period (four consecutive<br />
working weeks between 21 November 2005 and<br />
16 December 2005). All 24 therapists (20.3<br />
whole-time equivalents) working on the unit at<br />
the time participated. Disciplines included physiotherapy,<br />
occupational therapy, speech and language<br />
therapy, dietetics, psychology and social<br />
work. The patient cohort consisted of 8 women<br />
and 9 men: mean age 45.5 years (SD 17.1). All<br />
had complex neurological disabilities arising<br />
from acquired brain injury (8 strokes, 5 traumatic),<br />
spinal cord injury (n ¼ 2) or Guillain-<br />
Barre´ syndrome (n ¼ 2).<br />
Data collection<br />
Data were collected in the course of routine clinical<br />
practice. Patients on the unit are normally<br />
divided into two teams (‘Red’ and Blue’) and the<br />
weekly ward round alternates between the teams,<br />
so that each patient is reviewed fortnightly.<br />
Inevitably there were admissions and discharges<br />
during the four-week study period, so that 12<br />
patients were rated on two occasions and 5 were<br />
rated only once, giving a total of 29 parallel sets of<br />
ratings of NPTDA scores with activity analysis for<br />
the corresponding period.<br />
NPTDA scores were applied during the weekly<br />
ward round, by the treating team. They were rated<br />
retrospectively for each patient to reflect a week’s<br />
therapy intervention, based on the average of the<br />
previous two weeks, thus allowing for weekto-week<br />
fluctuations. Scoring took 5–10 minutes<br />
per patient, and this time reduced as therapists<br />
became familiar with the tool.<br />
NPTDA algorithm to calculate estimated therapy<br />
hours: In order to calculate ‘estimated therapy<br />
hours/week’ from the NPTDA scores, we applied<br />
a test algorithm. Within the NPTDA manual, each<br />
item scoring level carries an approximate range of<br />
hours per week (see Appendix 1b). Our first ‘test<br />
algorithm’ simply applied the mid-point time value<br />
for each range (e.g. for a time range 3–4 hours,<br />
value 3.5; range 1–2 hours, value 1.5, etc.). Only<br />
direct interventions could be compared, as the<br />
NPTDA did not record hours for indirect interventions<br />
at this point in its development.<br />
Activity analysis: Over the same four-week<br />
period, each therapist systematically recorded all<br />
activity at half-hourly intervals throughout their<br />
working week. Activity was coded by each therapist<br />
onto a pre-piloted daily timesheet. Activity<br />
codes (full list available from the authors on<br />
request) were divided into patient-related and<br />
non-patient-related activity. Patient-related activity<br />
codes were designed to reflect the NPTDA item<br />
headings. Patient identity codes were used to<br />
assign activities to each individual patient. For<br />
simplicity and practical utility in the context of a<br />
busy service, where more than one therapeutic<br />
activity was undertaken within one 30-minute session,<br />
therapists recorded only the principal activity.<br />
Completed timesheets were handed at the end<br />
of each day and retained by the independent investigator,<br />
so that NPTDA estimations at the subsequent<br />
ward round were conducted independently<br />
of the activity analysis. Out of over 420 timesheets<br />
due for the four-week period, only two were<br />
missing.<br />
Data were collated for each patient under each<br />
item heading in the NPTDA, to build up a series<br />
of individual patient records of therapy intervention<br />
received over the two-week period. The times<br />
were then halved to derive the average hours per<br />
week. As well as recording the ‘actual hours’ per<br />
item for each patient, we also mapped these by<br />
reverse transcription to derive NPTDA scores<br />
from the activity analysis (‘activity analysisderived<br />
NPTDA’ scores), using the time range<br />
stated for each scoring level (see Appendix 1b)<br />
which, as noted above, varies somewhat for the<br />
different items.<br />
Data analysis<br />
Data were collated in specifically developed<br />
software written in Microsoft Excel, and transferred<br />
to SPSS version 11.5 or STATA version 8<br />
for statistical handling.<br />
The association between ordinal NPTDA<br />
scores and actual hours of therapy intervention<br />
(derived from activity analysis) was examined<br />
using Spearman rank correlations.<br />
To evaluate the algorithm for converting raw<br />
NPTDA scores to therapy hours, the median
926 L Turner-Stokes et al.<br />
NPTDA-estimated hours/week were compared<br />
with the median ‘actual’ hours/week identified<br />
from the activity analysis. Comparisons were<br />
made for individual items, for each subscale,<br />
and for the total. Associations were tested<br />
using Spearman rank correlations, and significant<br />
differences were tested by paired Wilcoxon<br />
signed rank tests.<br />
We also compared agreement between the<br />
‘activity analysis-derived NPTDA’ scores and<br />
the ‘team-rated NPTDA’ scores in an item-byitem<br />
analysis. Agreement was tested using<br />
linear-weighted Cohen’s kappa statistics<br />
(STATA) and interpreted according to<br />
Landis and Koch. 19 Significant differences<br />
were tested by paired Wilcoxon signed rank<br />
tests.<br />
The cut-off point for significance was adjusted<br />
to P50.01 to account for multiple tests.<br />
Results<br />
There was a moderately strong correlation<br />
between total NPTDA ordinal scores and the<br />
total intervention hours, as recorded through<br />
activity analysis (rho 0.64 P50.0001).<br />
Table 1a shows the comparison of the ‘NPTDAestimated’<br />
therapy hours for direct intervention<br />
subscales with ‘actual’ hours of therapy identified<br />
by activity analysis. There was a strong correlation<br />
in total hours (rho 0.77, P50.0001, see Figure 1a),<br />
and in all five subscores A–E (rho 0.70–0.93,<br />
all P50.0001). However, the total NPTDAestimated<br />
therapy hours were significantly<br />
higher than the ‘actual’ hours (median 24<br />
versus 17; Wilcoxon z ¼ –3.9, P50.001) in this<br />
analysis. The same trend was observed for all the<br />
subscale scores, except for ‘activities of daily<br />
living’.<br />
Table 2 compares NPTDA scores rated by<br />
the team, with scores derived from activity analysis<br />
by reverse transcription. Nine of the 22 direct<br />
intervention items achieved ‘substantial’ or<br />
‘almost perfect’ agreement (weighted kappa<br />
40.65), a further eight achieved moderate<br />
agreement. Four direct intervention items and<br />
two indirect intervention achieved only fair<br />
agreement (kappa 0.2–0.4). Amongst these ‘personal<br />
self-care’, ‘formal family support’, and<br />
‘key-working’ also showed significant bias<br />
60<br />
a) Using mid-point algorithm b) Using revised algorithm<br />
60<br />
50<br />
50<br />
Total hours: activity analysis<br />
40<br />
30<br />
20<br />
10<br />
Total hours: Activity analysis<br />
40<br />
30<br />
20<br />
10<br />
0<br />
0<br />
−10<br />
−10<br />
−10 0 10 20 30 40 50 60 −10 0 10 20 30 40 50 60<br />
Total hours estimated by NPTDA<br />
Total hours estimated by NPTDA<br />
Figure 1 Scattergrams comparing estimations of therapy hours recorded from activity analysis compared with those<br />
estimated by the Northwick Park Therapy Dependency Assessment using the two algorithms. In these ’Sunflower’<br />
plots, each ’petal’ represents a single data pair. The scattergrams demonstrate a reasonably close association. The systematic<br />
bias towards overestimation of hours by the mid-point algorithm (a), compared with records of activity analysis is<br />
reduced using the revised algorithm (b) (Appendix 2).
Development of Northwick Park Therapy Dependency Assessment 927<br />
Table 1 Comparison NPTDA-estimated hours and actual hours of therapy intervention identified from activity analysis, within<br />
each direct intervention subscale<br />
Therapy dependency<br />
subscale<br />
Estimated hours/week<br />
From NPTDA<br />
Actual hours/week<br />
From activity analysis<br />
Comparative analysis<br />
Median<br />
(IQR)<br />
Range<br />
Median<br />
(IQR)<br />
Range<br />
Wilcoxon<br />
Z-value<br />
P-value<br />
Spearman<br />
rho<br />
P-value<br />
a) Estimates using the mid-point algorithm<br />
Physical subscale 10.0 (7–11.8) 0–18 7.0 (6–9.1) 0–16 3.4 0.001 0.71 50.0001<br />
Basic functions 2.0 (0.8–5.3) 0–15 1.5 (0.4–3.8) 0–6.5 4.2 50.001 0.93 50.0001<br />
Activities of daily living 1.5 (0.4–4.8) 0–7.5 2.0 (0.1–3.1) 0–6.0 1.8 0.07 0.71 50.0001<br />
Cognitive 4.0 (1.3–6) 0–21.5 1.8 (0.5–3.1) 0–8.3 3.9 50.001 0.70 50.0001<br />
Discharge planning 2.0 (1–7.6) 0–14.5 2.0 (0.4–3.5) 0–10.5 3.6 50.001 0.88 50.0001<br />
Total 24.2 (16.9–27.4) 0–51.5 17.3 (14.6–26.4) 0–40 3.9 50.001 0.77 50.0001<br />
b) Estimates using the revised algorithm<br />
Physical subscale 8.8 (5.6–10.6) 0–18 7.0 (6–9.1) 0–16 1.7 0.09 0.69 50.0001<br />
Basic functions 1.3 (0.4–4.3) 0–13.5 1.5 (0.4–3.8) 0–6.5 2.0 0.05 0.94 50.001<br />
Activities of daily living 2.3 (2–5) 0–8 2.0 (0.1–3.1) 0–6.0 2.6 0.011 0.30 0.118<br />
Cognitive 1.0 (0.3–3.8) 0–21 1.7 (0.5–3.1) 0–8.3 0.2 0.86 0.45 0.014<br />
Discharge planning 2.0 (1–6.1) 0–13.5 2.0 (0.4–3.5) 0–10.5 3.3 0.001 0.66 50.0001<br />
Total 20.3 (16–24.9) 0–51.2 17.3 (14.6–26.4) 0–40 1.4 0.15 0.70 50.0001<br />
NPTDA, Northwick Park Therapy Dependency Assessment.<br />
towards higher ratings on the team-rated NPTDA<br />
scores.<br />
Adjustment of the algorithm and re-testing<br />
In summary, using the algorithm that applied<br />
the mid-point time values, we found a strong overall<br />
relationship between the therapy hours identified<br />
through activity analysis, and those estimated<br />
from the NPTDA, but the latter were consistently<br />
higher than those observed.<br />
We therefore explored a number of different<br />
algorithms. Simply using the low point of the<br />
time range provided a better match overall, but<br />
led to underestimation of therapy hours for some<br />
items. Our final algorithm was therefore based on<br />
a mixture of low and mid-point time values<br />
informed by our activity analysis. The algorithm<br />
times for each item scoring level are shown in<br />
Appendix 2. Figure 1 compares scattergrams of<br />
the therapy hours estimated by the two algorithms,<br />
and the results of re-analysis using the<br />
revised algorithm to compare NPTDA-estimated<br />
hours with those derived from activity analysis are<br />
summarized in Tables 1b and 3.<br />
Using this algorithm, the match appears to be<br />
closer. Table 1b demonstrates that there is now no<br />
significant difference between the NPTDA-estimated<br />
and actual total therapy hours. Although<br />
the correlations for each subscale are somewhat<br />
less strong than with the mid-point algorithm,<br />
the correlation between the total estimates of therapy<br />
time remains high (rho 0.70, P50.0001).<br />
Similarly, on item-by-item analysis (Table 3), correlations<br />
between estimates of therapy time were<br />
significant for all direct intervention items (rho<br />
0.49–0.89, P50.001), with the exception of two<br />
items only (‘benefits and finances’ and ‘key-working’<br />
– see Discussion).<br />
Stage 2: Comparison of prospective and retrospectively<br />
rated scores<br />
Before the NPTDA can be applied to a hypothetical<br />
situation to assess ‘needs’ for rehabilitation,<br />
it was necessary to determine the extent<br />
to which prospective application NPTDA<br />
provides a valid advance prediction of the levels<br />
of therapy intervention under existing conditions.<br />
We compared prospectively rated ‘intended<br />
levels of intervention’ with retrospective ratings<br />
of ‘actual intervention’. We anticipated an approximate<br />
relationship but not an exact one, as<br />
there are often unpredicted changes in timetabling
928 L Turner-Stokes et al.<br />
Table 2 Agreement between Northwick Park Therapy Dependency Assessment (NPTDA) scores rated by the team and<br />
NPTDA scores derived by reverse transcription from activity analysis<br />
Therapy dependency item<br />
Team-rated<br />
NPTDA scores<br />
Activity analysis-derived<br />
NPTDA scores<br />
Significant<br />
differences<br />
Agreement<br />
Median<br />
(IQR)<br />
Range<br />
Median<br />
(IQR)<br />
Range<br />
Wilcoxon<br />
Z-score<br />
P-value Weighted<br />
kappa<br />
Level of<br />
agreement<br />
1) Medical management a 1 (0–2) 0–4 – – – – – –<br />
2a) Splinting/orthotics upper limb 1 (0–2) 0–4 0 (0–2) 0–3 2.8 0.005 0.75 Substantial<br />
2b) Splinting/orthotics lower limb 0 (0–1) 0–3 0 (0–1) 0–2 0.7 0.480 0.75 Substantial<br />
3) Seating/wheelchair 2 (1–3) 0–4 1 (0–2) 0–2 3.1 0.002 0.49 Moderate<br />
4) Physical therapy 4 (3–4) 0–4 3 (2–4) 0–4 2.1 0.032 0.47 Moderate<br />
5) Trachestomy management 0 (0–0) 0–4 0 (0–0) 0–2 0.3 0.785 0.65 Substantial<br />
6) Swallowing 0 (0–1) 0–3 0 (0–1) 0–2 1.6 0.102 0.80 Substantial<br />
7) Nutrition 1 (1–2) 0–4 1 (0–2) 0–4 2.2 0.029 0.80 Substantial<br />
8) Supported communication 0 (0–2) 0–4 0 (0–1) 0–3 1.8 0.070 0.48 Moderate<br />
9) Speech and language 2 (1–2) 0–4 1 (0–2) 0–3 2.4 0.017 0.65 Substantial<br />
interventions<br />
10) Personal/self-care 2 (1–3) 0–4 1 (1–2) 0–3 3.4 0.001 0.41 Fair<br />
11) Domestic/communitybased<br />
0 (0–1) 0–4 0 (0–1) 0–3 1.8 0.070 0.69 Substantial<br />
activities<br />
12) Vocational/leisure/<br />
2 (0–2) 0–4 2 (1–2) 0 2 0.2 0.850 0.57 Moderate<br />
computers/driving<br />
13) Cognitive interventions 0 (0–1) 0–4 0 (0–1) 0–2 2.0 0.047 0.46 Moderate<br />
14) Behavioural management 0 (0–0) 0–4 0 (0–0) 0–4 0.4 0.705 0.84 Almost Perfect<br />
15) Emotional/mood 0 (0–2) 0–4 1 (0–2) 0–2 1.3 0.203 0.55 Moderate<br />
16) Formal family support 0 (0–2) 0–4 0 (0–1) 0–2 2.6 0.009 0.32 Fair<br />
17) Emotional load on staff b 1 (0–2) 0–4 – – – – – –<br />
18) Planning discharge/ 1 (0–2) 0–4 0 (0–2) 0–4 2.2 0.029 0.60 Moderate<br />
housing/care package<br />
19) Benefits and finances 1 (0–1) 0–4 0 (0–1) 0–2 1.2 0.244 0.31 Fair<br />
20) Equipment/adaptation 0 (0–1) 0–3 0 (0–0) 0–2 2.1 0.037 0.43 Moderate<br />
for home<br />
21) Community/home visits 0 (0–0) 0–4 0 (0–0) 0–4 7.1 0.480 0.81 Almost Perfect<br />
22) Key-working 2 (1–3) 0–4 1 (0–2) 0–3 3.7 50.001 0.32 Fair<br />
23) Multidisciplinary meetings 2 (0–2) 0–2 2 (0–2) 0–2 1.7 0.096 0.35 Fair<br />
24) Reports 0 (0–2) 0–2 0 (0–0) 0–2 2.1 0.040 0.23 Fair<br />
25) Groups/extra therapies 2 (1–2) 0–2 2 (0–2) 0–2 2.1 0.038 0.73 Substantial<br />
a Medical staff were excluded from this particular analysis due to staff absence, but they have been included in a subsequent<br />
analysis.<br />
b ‘Emotional load on staff’ does not carry a time computation and so could not be compared in this analysis.<br />
and staff availability. Moreover, patients’<br />
needs can sometimes change, and a flexible rehabilitation<br />
team should be able to adjust<br />
interventions in response to changing need. Any<br />
useful measure of therapy intervention, however,<br />
should be able to identify and describe these<br />
differences.<br />
Design and participants<br />
Stage 2 was undertaken in a second<br />
cross-sectional cohort analysis, during the subsequent<br />
15-week period (January–April 2006).<br />
We compared the parallel application of prospective<br />
and retrospective NPTDA scores. In order to<br />
avoid excessive rating burden for the team, instead<br />
of applying the NPTDA retrospectively at each<br />
fortnightly meeting, prospective and retrospective<br />
scoring were alternated as illustrated in Figure 2.<br />
Again all patients were included, but only if they<br />
were present on the ward for the full two weeks. In<br />
total, 51 paired ratings were collected from a total<br />
of 31 patients – 16 males and 15 females; mean age<br />
39.2 years (SD 14.6). Twenty-seven had acquired<br />
brain injury (14 strokes, 7 traumatic, 6 other,<br />
including hypoxia, inflammation and tumour),
Development of Northwick Park Therapy Dependency Assessment 929<br />
Table 3 Comparison between ‘NPTDA-estimated’ and ‘actual’ hours of therapy intervention using the revised algorithm<br />
Therapy dependency item Estimated hours/week<br />
From NPTDA<br />
Actual hours/week<br />
From activity<br />
analysis<br />
Comparative analysis<br />
Median (IQR) Range Median (IQR) Range Wilcoxon<br />
Z-value<br />
P-value Spearman<br />
rho<br />
P-value<br />
1) Medical management 0.3 (0–2) 0–6 – – – – – –<br />
2a) Splinting/orthotics<br />
0.3 (0–1) 0–5 0.0 (0–1.5) 0–3 0.8 0.41 0.77 50.0001<br />
upper limb<br />
2b) Splinting/orthotics<br />
0.0 (0–0.5) 0–3 0.0 (0–0.5) 0–2.5 0.4 0.71 0.64 50.0001<br />
lower limb<br />
3) Seating/wheelchair 1.0 (0–3) 0–5 0.8 (0–2) 0–2.5 2.2 0.03 0.74 50.0001<br />
4) Physical therapy 4.0 (3–6.5) 0–11.5 4.5 (3.1–5.5) 0–8 1.1 0.27 0.58 50.001<br />
5) Trachestomy management 0.0 (0–0) 0–10 0.0 (0–0) 0–2 0.0 1.00 0.58 50.001<br />
6) Swallowing 0.0 (0–0.3) 0–3 0.0 (0–0.3) 0–2.5 0.6 0.56 0.80 50.0001<br />
7) Nutrition 0.3 (0.1–0.3) 0–7 0.3 (0–0.8) 0–4.5 0.9 0.35 0.60 50.0001<br />
8) Supported communication 0.0 (0–1) 0–5 0.0 (0–0.4) 0–3.5 1.7 0.09 0.60 50.0001<br />
9) Speech and language<br />
1.1 (0–1) 0–5 0.8 (0–1.5) 0–4 0.2 0.88 0.73 50.0001<br />
interventions<br />
10) Personal/self-care 2.0 (0.3–4) 0–6 0.8 (0.3–2.0) 0–4.5 2.4 0.02 0.69 50.0001<br />
11) Domestic/communitybased<br />
activities<br />
0.0 (0–0.3) 0–4 0.0 (0–2.5) 0–3 1.1 0.27 0.70 50.0001<br />
12) Vocational/leisure/<br />
computers/driving<br />
1.0 (0–1) 0–3 1.0 (0.3–1.8) 0–2.5 1.9 0.05 0.55 50.001<br />
13) Cognitive interventions 0.0 (0–0.3) 0–4.5 0.0 (0–0.1) 0–1.5 1.3 0.20 0.57 50.001<br />
14) Behavioural management 0.0 (0–0) 0–5 0.0 (0–0) 0–5 0.1 0.89 0.89 50.0001<br />
15) Emotional/mood 0.0 (0–1) 0–14 0.3 (0–0.8) 0–1.5 1.3 0.18 0.65 50.0001<br />
16) Formal family support 0.0 (0–0.6) 0–6 0.0 (0–0.3) 0–1.5 2.4 0.02 0.49 0.008<br />
17) Emotional load on staff<br />
18) Planning discharge/<br />
0.3 (0–1) 0–5 0.0 (0–1.5) 0–4.5 0.5 0.64 0.69 50.0001<br />
housing/care package<br />
19) Benefits and finances 0.3 (0–0.3) 0–1 0.0 (0–0.5) 0–1.5 0.5 0.60 0.42 0.023<br />
20) Equipment/adaptation for<br />
home<br />
0.0 (0–0.3) 0–3 0.0 (0–0) 0–1 1.9 0.05 0.55 50.001<br />
21) Community/home visits 0.0 (0–0) 0–8 0.0 (0–0) 0–7.5 0.9 0.34 0.84 50.0001<br />
22) Key-working 1.0 (0.5–2) 0–5 0.5 (0.3–1.1) 0–3.5 2.5 0.012 0.45 0.015<br />
NPTDA, Northwick Park Therapy Dependency Assessment.
930 L Turner-Stokes et al.<br />
two had spinal cord injury and two Guillain–Barre´<br />
syndrome.<br />
Data collection<br />
At the beginning of each two-week block, the<br />
treating team rated ‘prospective NPTDA’ scores<br />
for each patient, based on the average level of<br />
input per week they intended to give for each<br />
item during that period. Scores were rated during<br />
the routine goal-planning meeting, during which<br />
the team normally sets short-term goals and<br />
plans treatment for the coming fortnight. At the<br />
end of the same period, ‘retrospective NPTDA’<br />
scores were assigned by the team based on the<br />
average level of interventions actually given over<br />
that same two-week period. NPTDA scores were<br />
retained by the investigator rather than being filed<br />
in the patient records, so that at each scoring<br />
point, therapists were unable to refer to any previous<br />
scores, and in this sense were ‘blinded’ to the<br />
scores they had given two weeks earlier.<br />
Data analysis<br />
As for stage 1, associations between prospective<br />
and retrospective scores or hours were tested using<br />
Spearman rank correlations. Agreement was<br />
tested using linear-weighted Cohen’s kappa statistics.<br />
Significant differences were tested by paired<br />
Wilcoxon signed rank tests. The cut-off point for<br />
significance was again adjusted to P50.01 to<br />
account for multiple tests. In the absence of preexisting<br />
data to make a formal power calculation,<br />
our sample size was based on the crude calculation<br />
of 2K 2 which, for a 5-point scale, is 50.<br />
Results<br />
Table 4 summarizes the comparison between<br />
prospective and retrospectively rated scores.<br />
There was a strong association between the total<br />
NPTDA scores (rho 0.61, P50.0001, see Figure 3)<br />
and subscale scores were also significantly correlated<br />
(rho 0.44–0.81, all P50.001). On item-byitem<br />
analysis, weighted kappas ranged from 0.28<br />
to 0.77, with 12/22 direct intervention items showing<br />
‘moderate’ to ‘substantial’ agreement (kappa<br />
40.40), but 10 showed only ‘fair’ agreement.<br />
Agreement for the subscale scores was ‘fair’ to<br />
‘moderate.’<br />
Overall there was a small tendency to overestimate<br />
predicted input through prospective scoring,<br />
leading to a significant difference in total<br />
scores (Wilcoxon z ¼ –3.30, P50.001). There was<br />
some considerable variation, however. Within the<br />
individual items, only scores for ‘equipment provision’<br />
were significantly different.<br />
Discussion and conclusions<br />
In the absence of an established gold standard<br />
against which to test criterion validity of the<br />
NPTDA, we used activity analysis to examine concurrent<br />
validity in stage 1. We found a strong overall<br />
relationship between the two estimates of<br />
therapy hours. However, those derived from the<br />
NPTDA using the mid-point algorithm were consistently<br />
higher than those observed through activity<br />
analysis, and there were several possible<br />
explanations for this bias:<br />
1) Activity recording may have been incomplete,<br />
2) The NPTDA may have overestimated therapy<br />
intervention, either because the rating therapists<br />
over-estimated scores or this ‘mid-point’<br />
algorithm overestimated the time taken.<br />
Strenuous efforts had been made to ensure<br />
complete recording of activity analysis, with only<br />
two forms missing over the study period. The<br />
decision to record only the dominant activity<br />
for each session may have led to some inaccuracies,<br />
but should have equally under- and overestimated<br />
time for different activities, so avoiding<br />
systematic bias. However, short activities such as<br />
phone calls may not have been adequately captured,<br />
which might explain the poor correlation<br />
in items such as key-working and discharge<br />
planning.<br />
Review discussions with the team revealed the<br />
following:<br />
1) Overestimation by scoring therapists was<br />
problematic in certain areas – especially<br />
those where intervention is mainly
Development of Northwick Park Therapy Dependency Assessment 931<br />
Table 4 Summary of comparison for prospective and retrospective Northwick Park Therapy Dependency Assessment scores<br />
Therapy dependency item Prospective scores Retrospective scores Comparison<br />
Median<br />
(IQR)<br />
Range Median<br />
(IQR)<br />
Range Wilcoxon<br />
Z-value<br />
P-value Spearman<br />
rho<br />
P-value Weighted<br />
kappa<br />
Level of<br />
agreement<br />
1) Medical management 2 (2–3) 0–4 2 (1–3) 0–4 1.61 0.11 0.50 50.0001 0.40 Fair<br />
2a) Splinting/orthotics<br />
1 (0–3) 0–4 0 (0–2) 0–4 1.27 0.21 0.79 50.0001 0.63 Substantial<br />
upper limb<br />
2b) Splinting/orthotics<br />
lower limb<br />
1 (0–2) 0–3 1 (0–2) 0–3 0.47 0.64 0.45 50.0001 0.40 Fair<br />
3) Seating/wheelchair 2 (1–2) 0–4 2 (1–2) 0–4 1.18 0.24 0.63 50.0001 0.48 Moderate<br />
4) Physical therapy 3.5 (3–4) 0–4 3.5 (3–4) 0–4 0.25 0.81 0.24 0.08 0.28 Fair<br />
5) Trachestomy management 0 (0–0) 0–0 0 (0–0) 0–0 0.00 1.00 N/A a N/A N/A N/A<br />
6) Swallowing 0 (0–0) 0–3 0 (0–0) 0–4 1.07 0.29 0.75 50.0001 0.64 Substantial<br />
7) Nutrition 1 (0–2) 0–4 1 (0–2) 0–4 2.23 0.03 0.47 50.0001 0.43 Moderate<br />
8) Supported communication 0 (0–0) 0–4 0 (0–0) 0–2 0.81 0.42 0.73 50.0001 0.48 Moderate<br />
9) Speech and language 2 (0–3) 0–4 2 (0–3) 0–4 0.91 0.37 0.90 50.0001 0.77 Substantial<br />
interventions<br />
10) Personal/self-care 2 (2–2) 0–4 2 (1–2) 0–4 1.18 0.24 0.49 50.0001 0.35 Fair<br />
11) Domestic/communitybased<br />
activities<br />
12) Vocational/leisure/<br />
computers/driving<br />
2 (0–2) 0–4 1 (0–2) 0–4 1.62 0.10 0.29 0.04 0.29 Fair<br />
2 (0–2) 0–3 2 (0–2) 0–4 0.69 0.49 0.37 50.0001 0.34 Fair<br />
13) Cognitive interventions 0 (0–2) 0–4 0 (0–1) 0–4 1.19 0.23 0.45 50.0001 0.47 Moderate<br />
14) Behavioural management 0 (0–0) 0–4 0 (0–0) 0–4 1.29 0.20 0.67 50.0001 0.61 Substantial<br />
15) Emotional/mood 1 (0–2) 0–4 2 (0–2) 0–4 0.84 0.40 0.67 50.0001 0.66 Substantial<br />
16) Formal family support 0 (0–1) 0–4 0 (0–1) 0–4 0.31 0.76 0.46 50.0001 0.39 Fair<br />
17) Emotional load on staff 0 (0–2) 0–4 0 (0–2) 0–4 0.46 0.65 0.66 50.0001 0.52 Moderate<br />
18) Planning discharge/housing/<br />
care package<br />
2 (1–3) 0–4 1 (0–3) 0–4 0.63 0.53 0.46 50.0001 0.41 Moderate<br />
19) Benefits and finances 1 (1–2) 0–3 1 (1–2) 0–4 0.13 0.90 0.55 50.0001 0.50 Moderate<br />
1 (0–2) 0–4 0 (0–2) 0–3 2.95 0.003 0.42 50.0001 0.31 Fair<br />
20) Equipment/adaptation<br />
for home<br />
21) Community/home visits 0 (0–3) 0–4 0 (0–2) 0–4 1.71 0.09 0.38 0.006 0.38 Fair<br />
22) Key-working 2 (1–2) 0–4 2 (1–2) 1–3 1.19 0.24 0.35 0.012 0.31 Fair<br />
23) Multidisciplinary meetings 2 (0–2) 0–2 2 (0–2) 0–2 0.00 1.00 0.77 50.0001 0.77 Substantial<br />
24) Reports 1 (0–1) 0–2 0 (0–2) 0–2 2.51 0.012 0.59 50.0001 0.50 Moderate<br />
25) Groups/extra therapies 2 (2–2) 0–2 2 (2–2) 0–2 0.56 0.57 0.35 0.012 0.30 Fair<br />
26) Clinics 0 (0–2) 0–2 0 (0–2) 0–2 0.63 0.53 0.60 50.0001 0.60 Moderate<br />
Subscale scores<br />
Physical subscale 9.5 (8–11) 3–15 9.5 (7–11.5) 3–16 1.76 0.08 0.71 50.0001 0.52 Moderate<br />
Basic functions 4 (1–5.5) 0–9 3 (2–5) 0–8 1.57 0.12 0.81 50.0001 0.54 Moderate<br />
ADL 5 (3–6) 1–9 4 (2–6) 1–10 2.01 0.05 0.44 50.001 0.29 Fair<br />
Cognitive 2 (1–6) 0–16 3 (1–6) 0–13 0.57 0.57 0.64 50.0001 0.55 Moderate<br />
Discharge planning 7 (5–9.5) 1–15 6 (4–8) 1–13 2.53 0.011 0.53 50.0001 0.31 Fair<br />
Indirect interventions 4 (3.5–6) 2–8 4 (3–6) 0–8 0.74 0.46 0.55 50.0001 0.44 Moderate<br />
Total NPTDA 35 (28–38.5) 16–45 30 (26.6–35.5) 18–43 3.30 50.001 0.61 50.0001 0.38 Fair<br />
a In this particular series, unlike the earlier one, no patient had a tracheostomy.
932 L Turner-Stokes et al.<br />
RED TEAM<br />
Date<br />
10.1.06<br />
Application<br />
Prospective<br />
Reference<br />
period<br />
Weeks 1–2<br />
Date<br />
BLUE TEAM<br />
Application<br />
Reference<br />
period<br />
17.1.06<br />
Prospective<br />
Weeks 2–3<br />
24.1.06<br />
Retrospective<br />
Weeks 1–2<br />
31.1.06<br />
Retrospective<br />
Weeks 2–3<br />
7.2.06<br />
Prospective<br />
Weeks 5–6<br />
14.2.06<br />
Prospective<br />
Weeks 6–7<br />
21.2.06<br />
Retrospective<br />
Weeks 5–6<br />
28.2.06<br />
Retrospective<br />
Weeks 6–7<br />
7.3.06<br />
Prospective<br />
Weeks 9–10<br />
13.3.06<br />
Prospective<br />
Weeks 10–11<br />
20.3.06<br />
Retrospective<br />
Weeks 9–10<br />
27.3.06<br />
Retrospective<br />
Weeks 10–11<br />
4.4.06<br />
Prospective<br />
Weeks 13–14<br />
11.4.06<br />
Prospective<br />
Weeks 14–15<br />
18.4.06<br />
Retrospective<br />
Weeks 13–14<br />
25.4.06<br />
Retrospective<br />
Weeks 14–15<br />
Figure 2 Scoring programme for prospective and retrospective rating. The alternating rating system was employed to<br />
avoid excessive rating burden for the team. For any one patient, both prospectively and retrospectively applied scores were<br />
collected for the first fortnight of each four-week period, but no scores for the second fortnight.<br />
undertaken by assistant staff who are not<br />
present during scoring in the main ward<br />
round (interventions for ‘personal self-care’<br />
and ‘benefits and finances’ were examples of<br />
this).<br />
2) Overall, however, the team agreed that the<br />
mid-point algorithm overestimated times<br />
and required readjustment.<br />
3) There were large variations in therapy<br />
hours where a score of 4 was applied, as<br />
some interdisciplinary interventions involved<br />
only short periods. A ‘3.5 level’ was therefore<br />
introduced to identify short interdisciplinary<br />
interventions, and to avoid overestimation<br />
of therapy needs in these<br />
circumstances.<br />
In stage 2, there was a strong relationship between<br />
prospectively allocated and retrospective scores, but<br />
prospective scores were fairly consistently higher.<br />
Again there may be several reasons:<br />
1) Staff may be over-optimistic about their ability<br />
to fit all their duties into the time available<br />
2) Planned sessions may be cancelled because of<br />
patient illness, refusal or unavailability; staff<br />
sickness or unexpected leave; or other crisis<br />
intervention.<br />
3) Staff may fail to remember all their interventions,<br />
and so rate lower scores retrospectively.<br />
Team debriefing identified a number of issues that<br />
were thought to have contributed to the discrepancy:<br />
1) The study period coincided with a new<br />
UK-wide policy, requiring staff to re-negotiate<br />
their working contracts. Staff frequently<br />
complained that the extra administration<br />
involved impacted on the clinical care of<br />
patients during this period.
Development of Northwick Park Therapy Dependency Assessment 933<br />
50<br />
Total NPTDA score: prospective<br />
40<br />
30<br />
20<br />
10<br />
10<br />
20<br />
30<br />
40<br />
Total NPTDA score: retrospective<br />
50<br />
Figure 3 Scattergram of prospective versus retrospective total Northwick Park Therapy Dependency Assessment scores.<br />
The scattergram demonstrates a reasonably close association between prospectively-rated ‘intended levels of intervention’<br />
with retrospective ratings of ‘actual intervention’. Where intended levels of intervention were higher than those actually<br />
delivered, the differences corresponded to real deviations from intended practice in most instances.<br />
2) Other departures from expected plans<br />
included:<br />
a) unexpected absence of one staff member on<br />
long-term compassionate leave,<br />
b) some documented episodes of intercurrent<br />
illness (for both patients and staff)<br />
c) failure of delivery of specialist equipment<br />
items, requiring discharge planning<br />
arrangements to be altered.<br />
After reviewing the scores for specific instances<br />
of disagreement, the team agreed that, in the<br />
majority of cases, discrepancies between NPTDA<br />
scores had appropriately identified a real deviation<br />
from the level of intervention intended. This<br />
provides some support for the notion that the<br />
tool may have potential future application in<br />
describing the difference between the level of<br />
input provided, and hypothetical situations such<br />
as level of service ‘intended’ (as tested here) or<br />
the level of services ‘needed’ – although this must<br />
be tested separately. In the meantime, it underlines<br />
the importance of specifying the mode of application<br />
when results are reported.<br />
In comparison with the NPDS, on which<br />
the NPTDA is modelled, it is important to recognize<br />
that the estimation of ‘requirements for therapy’<br />
is inevitably more subjective than that<br />
for ‘basic care needs’ which most people would<br />
reasonably regard as essential. Previous experience<br />
suggests that these tools continue to evolve<br />
and develop over a decade or more, and much<br />
wider testing and validation will required<br />
before the NPTDA can be accepted on a similar<br />
footing to the NPDS as an estimation of ‘needs’.<br />
That said, the potential for hypothetical application<br />
makes the NPTDA unique, in comparison<br />
with other existing tools 5,7–12 which can only<br />
be applied to describe interventions that were actually<br />
given. However, these other tools offer the<br />
advantage of more detailed analysis of specific<br />
therapy interventions than is possible with<br />
the broad-brush approach of the NPTDA.<br />
In this respect, the two different approaches<br />
may be found to complement each other and<br />
may usefully be applied in combination in future<br />
attempts to characterize black box of<br />
rehabilitation. 20
934 L Turner-Stokes et al.<br />
There are a number of clear limitations to this<br />
study:<br />
1) This first validation study forms only one part<br />
of the on-going evaluation of the tool; other<br />
aspects such as reliability, responsiveness, utility,<br />
etc. are currently being addressed and<br />
will be presented for publication separately.<br />
2) There were a number of methodological<br />
challenges:<br />
a) Rating bias: we recognize a potential for<br />
bias as the same therapists had to record<br />
their NPTDA scores and the activity analysis<br />
(in stage 1) and both prospective and retrospective<br />
ratings (in stage 2). In order to<br />
reduce bias, ratings were handed in to the<br />
investigator as soon as they were completed,<br />
and so were not available to staff<br />
when subsequent ratings were made. In<br />
addition, the data volumes were large –<br />
during a two-week period each full-time<br />
therapist would record some 160 items of<br />
activity analysis across their caseload –<br />
making it unlikely that they would carry<br />
these in their memory whilst rating the<br />
NPTDA scores. Nevertheless some potential<br />
for rating bias must inevitably exist.<br />
b) Incomplete capture of activities: The decision<br />
to record only the dominant activity in<br />
each 30-minute period may have underestimated<br />
time spent on short tasks during the<br />
activity analysis. From the information perspective,<br />
shorter sample periods (e.g. every<br />
10–15 minutes) are ideal, but are even more<br />
burdensome to collect in the course of routine<br />
practice, and may well have been more inaccurate<br />
in the end due to clinician burn-out.<br />
c) Sample size: Activity analysis is time-consuming<br />
both for clinicians and for therapists.<br />
Whilst our analysis captured<br />
activity for approximately 420 therapistdays<br />
over the study period (20 working<br />
days for 20.3 WTE) generating a large<br />
quantity of data, this was in reality a<br />
small sample involving just 17 different<br />
patients on a single unit, and caution<br />
must be applied in generalizing these findings<br />
to other services.<br />
The NPTDA has been developed in the context<br />
of post-acute inpatient neurological rehabilitation.<br />
This particular service was chosen for its cohort of<br />
patients with complex rehabilitation needs, but further<br />
work is now required to test the algorithm in<br />
different settings, with different teams and different<br />
patient groups and other areas of rehabilitation.<br />
We have started to explore its adaptation for use<br />
with children and cognitive behavioural settings.<br />
Despite the recognized limitations, this article<br />
describes the initial development of a potentially<br />
important tool to inform clinical practice. The<br />
results presented provide encouraging early support<br />
for its potential to provide a reasonable estimate<br />
of therapy interventions, which is practical to<br />
apply in the context of routine clinical care. Further<br />
exploration and evaluation is now warranted.<br />
<strong>Clinical</strong> messages<br />
The Northwick Park Therapy Dependency<br />
Assessment is a tool to measure therapy<br />
needs and interventions in neurorehabilitation<br />
and to quantify these in terms of staff<br />
time.<br />
In this first evaluation study it provided a<br />
reasonable estimate of therapy hours.<br />
Further development and evaluation are<br />
now underway.<br />
Full details of the NPTDA and computerized software<br />
are available from the corresponding author.<br />
Acknowledgements<br />
The authors would like to thank all the<br />
patients and staff who took part in this study.<br />
Special thanks are due to the senior therapy<br />
staff on the Regional <strong>Rehabilitation</strong> Unit,<br />
who contributed to the development of the various<br />
versions of the NPTDA score over the course of<br />
this project. They include: Frances Clegg,<br />
Beverley Fielding, Jane Johnson, Sarah Harris<br />
and Pip Taylor. Heather Williams has also<br />
played a major part in to the on-going tool development.<br />
We are grateful to the Department of<br />
Health for providing funding for the project<br />
(Grant ref 030/0066) and to the Luff Foundation
Development of Northwick Park Therapy Dependency Assessment 935<br />
who provided support for the preparation for this<br />
manuscript.<br />
Competing interests<br />
The authors are the originators of the<br />
NPTDA and are naturally keen to encourage<br />
its wider use, but have no financial or other<br />
competing interests.<br />
References<br />
1 Kwakkel G. Impact of intensity of practice after<br />
stroke: issues for consideration. Disabil Rehabil<br />
2006; 28: 823–30.<br />
2 Shiel A, Burn JPS, Henry D et al. The effects of<br />
increased rehabilitation therapy after brain injury:<br />
results of a prospective controlled trial.<br />
Clin Rehabil 2001; 15: 501–14.<br />
3 Slade A, Chamberlain MA, Tennant A. A randomised<br />
controlled trial to determine the effect of<br />
intensity of therapy on length of stay in a neurological<br />
rehabilitation setting. J Rehabil Med 2002;<br />
34: 260–66.<br />
4 Gladman J, Barer D, Langhorne P. Specialist rehabilitation<br />
after stroke (editorial). BMJ 1996; 312:<br />
1623–24.<br />
5 Ballinger C, Ashburn A, Low J, Roderick P.<br />
Unpacking the black box of therapy–a pilot study<br />
to describe occupational therapy and physiotherapy<br />
interventions for people with stroke.<br />
Clin Rehabil 1999; 13: 301–309.<br />
6 De Jong G, Horn SD, Gassaway JA, Slavin MD,<br />
Dijkers MP. Toward a taxonomy of rehabilitation<br />
interventions: Using an inductive approach to<br />
examine the ‘black box’of rehabilitation. Arch Phys<br />
Med Rehabil 2004; 85: 678–86.<br />
7 De Wit L, Kamsteegt H, Yadav B, Verheyden G,<br />
Feys H, De Weerdt W. Defining the content of<br />
individual physiotherapy and occupational therapy<br />
sessions for stroke patients in an inpatient rehabilitation<br />
setting. Development, validation and interrater<br />
reliability of a scoring list. Clin Rehabil 2007;<br />
21: 450–59.<br />
8 Bode RK, Heinemann AW, Semik P, Mallinson T.<br />
Patterns of therapy activities across length of stay<br />
and impairment levels: peering inside the ‘black<br />
box’ of inpatient stroke rehabilitation. Arch Phys<br />
Med Rehabil 2004; 85: 1901–908.<br />
9 Latham NK, Jette DU, Slavin M et al. Physical<br />
therapy during stroke rehabilitation for people<br />
with different walking abilities. Arch Phys Med<br />
Rehabil 2005; 86(suppl 2): S41–S50.<br />
10 Richards LG, Latham NK, Jette DU,<br />
Rosenberg L, Smout RJ, DeJong G.<br />
Characterizing occupational therapy practice in<br />
stroke rehabilitation. Arch Phys Med Rehabil<br />
2005; 86(suppl 2): S51–S60.<br />
11 van Langeveld SA, Post MW, van Asbeck FW,<br />
Postma K, Leenders J, Pons K. Feasibility of a<br />
classification system for physical therapy, occupational<br />
therapy, and sports therapy interventions<br />
for mobility and self-care in spinal cord injury<br />
rehabilitation. Arch Phys Med Rehabil 2008; 89:<br />
1454–59.<br />
12 van Langeveld SA, Post MW, van Asbeck FW,<br />
Postma K, Ten Dam D, Pons K. Development<br />
of a classification of physical, occupational,<br />
and sports therapy interventions to<br />
document mobility and self-care in spinal<br />
cord injury rehabilitation. J Neurol Phys Ther<br />
2008; 32: 2–7.<br />
13 Turner-Stokes L, Tonge P, Nyein K, Hunter M,<br />
Nielson S, Robinson. The Northwick Park<br />
Dependency Score (NPDS): a measure of nursing<br />
dependency in rehabilitation. Clin Rehabil 1998;<br />
12: 304–18.<br />
14 Post MW, Visser-Meily JM, Gispen LS.<br />
Measuring nursing needs of stroke patients<br />
in clinical rehabilitation: a comparison<br />
of validity and sensitivity to change between<br />
the Northwick Park Dependency Score<br />
and the Barthel Index. Clin Rehabil 2002; 16:<br />
182–89.<br />
15 Hatfield A, Hunt S, Wade DT. The Northwick<br />
Park Dependency Score and its relationship to<br />
nursing hours in neurological rehabilitation.<br />
J Rehabil Med 2003; 35: 116–20.<br />
16 Skinner A, Turner-Stokes L. The use of standardised<br />
outcome measures for rehabilitation in the<br />
UK. Clin Rehabil 2005; 20: 609–15.<br />
17 Svensson S, Sonn U, Sunnerhagen KS. Reliability<br />
and validity of the Northwick Park Dependency<br />
Score (NPDS) Swedish version 6.0. Clin Rehabil<br />
2005; 19: 419–25.<br />
18 Turner-Stokes L. The Northwick Park Therapy<br />
Dependency Score (NPTDA): Development, preliminary<br />
evaluation and application. Department<br />
of Health R&D Project Grant Report ref. 030/<br />
0066; 2006.<br />
19 Landis JR, Koch GG. The measurement of observer<br />
agreement for categorical data. Biometrics<br />
1977; 33: 159–74.<br />
20 Khan F, Pallant JF, Zhang N, Turner-Stokes L.<br />
<strong>Clinical</strong> practice improvement approach in multiple<br />
sclerosis rehabilitation: a pilot study.<br />
Submitted 2009.
936 L Turner-Stokes et al.<br />
Appendix 1a<br />
Domains of the Northwick Park Therapy Dependency Assessment (NPTDA)<br />
Domain Items Lead discipline Scores Totals<br />
A: Physical handing programme 1) Medical management Doctor 0–4<br />
2a) Splinting orthotics (upper limb) O/T 0–4<br />
2b) Splinting orthotics (lower limb) Physio 0–4<br />
3) Seating/wheelchair O/T 0–4<br />
4) Physical therapy–active/passive handling Physio 0–4 0–20<br />
B: Basic functions 5) Tracheostomy management SLT 0–4<br />
6) Swallowing SLT 0–4<br />
7) Nutrition Dietitian 0–4<br />
8) Supported communication SLT 0–4<br />
9) Speech and language interventions SLT 0–4 0–20<br />
C: Activities of daily living 10) Personal/self-care O/T 0–4<br />
11) Domestic/community-based activities O/T 0–4<br />
12) Vocational/leisure/computers/driving O/T 0–4 0–12<br />
D: Cognitive/psychosocial/<br />
family support<br />
13) Cognitive interventions Psychology 0–4<br />
14) Behavioural management Psychology 0–4<br />
15) Emotional/mood Psychology 0–4<br />
16) Formal family support Psychology 0–4<br />
17) Emotional load on staff Psychology 0–4 0–20<br />
E: Preparing for discharge 18) Planning discharge/housing/care package SW 0–4<br />
19) Benefits and finances SW 0–4<br />
20) Equipment/adaptations for home O/T 0–4<br />
21) Community/home visits O/T 0–4<br />
22) Key-working ... 0–4 0–20<br />
F: Indirect interventions þ<br />
additional activities<br />
23) Multidisciplinary meetings State 0–2<br />
24) Reports State 0–2<br />
25) Groups/extra therapies State 0–2<br />
26) (Accompanied) clinic attendance State 0–2 0–8<br />
G: Special input 27) Special facilities (Select from lists) Text<br />
28) Special equipment hire (Select from lists) Text<br />
29) Investigations (Select from lists) Text<br />
30) Procedures (Select from lists) Text<br />
Total 0–100<br />
O/T, occupational therapist; SLT, speech and language therapist; SW, social worker.<br />
Appendix 1b<br />
Example of the general scale structure for most items<br />
Score<br />
Approximate hours/week a<br />
(Example only)<br />
Range<br />
Descriptor<br />
Level description of therapy input<br />
0 0 None Not relevant, or no planned therapy at the current time<br />
1 51 Low Minimal intervention, or review only<br />
2 1–2 Medium Basic intervention, or intervention by assistant only<br />
3 3–4 High More intensive intervention by qualified therapist þ/ assistant<br />
3.5 b 54 Interdisciplinary Interdisciplinary intervention, but for limited total time<br />
4 44 Complex Interdisciplinary intervention, and/or very high intensity input<br />
a The ‘approximate hours/week’ varies for the different items. Therapists are encouraged to rely primarily on the level descriptions<br />
for scoring, but the time range is designed to provide a rough guide to assist scoring. Times were derived in development<br />
through observational analysis.<br />
b The initial version used in our first validation study did not include a 3.5 score. This was added subsequently to avoid<br />
overestimation of therapy needs requiring simultaneous intervention from several disciplines, but only for a short period.
Development of Northwick Park Therapy Dependency Assessment 937<br />
Appendix 2<br />
Revised algorithm for NPTDA estimation of hours/week in relation to scores<br />
Items<br />
Lead<br />
discipline<br />
Hours per week<br />
ascribed to lead discipline<br />
Individually recorded<br />
hours per discipline<br />
0 1 2 3 3.5 4<br />
1) Medical management Doctor 0 1 2.5 4.5 (–) 6<br />
2a) Splinting orthotics (upper limb) O/T 0 0.5 1 3 Individualized<br />
2b) Splinting orthotics (lower limb) Physio 0 0.5 1 3 Individualized<br />
3) Seating/wheelchair O/T 0 0.5 1 3 Individualized<br />
4) Physical therapy – active/passive handling Physio 0 1 2.5 4.5 Individualized<br />
5) Tracheostomy management SLT 0 0.5 1 3 Individualized<br />
6) Swallowing SLT 0 0.5 1 3 Individualized<br />
7) Nutrition Dietitian 0 0.25 0.75 2 Individualized<br />
8) Supported communication SLT 0 0.5 1 3 Individualized<br />
9) Speech and language interventions SLT 0 0.5 1 3 Individualized<br />
10) Personal/self-care O/T 0 0.5 1 3 Individualized<br />
11) Domestic/community-based activities O/T 0 0.5 1 3 Individualized<br />
12) Vocational/leisure/computers/driving O/T 0 0.5 1 3 Individualized<br />
13) Cognitive interventions Psychology 0 0.5 1 3 Individualized<br />
14) Behavioural management Psychology 0 0.5 1 3 Individualized<br />
15) Emotional/mood Psychology 0 0.5 1 3 Individualized<br />
16) Formal family support Psychology 0 0.5 1 3 Individualized<br />
17) Emotional load on staff Psychology – – – – Individualized<br />
18) Planning discharge/housing/care package SW 0 0.5 1 3 Individualized<br />
19) Benefits and finances SW 0 0.5 1 3 Individualized<br />
20) Equipment/adaptations for home O/T 0 0.5 1 3 Individualized<br />
21) Community/home visits O/T 0 1 3 5 Individualized<br />
22) Key-working ... 0 0.5 1 3 Individualized<br />
23) Multidisciplinary meetings State 0 Individualized (–) (–) (–)<br />
24) Reports State 0 Individualized (–) (–) (–)<br />
25) Groups/extra therapies State 0 Individualized (–) (–) (–)<br />
26) (Accompanied) clinic attendance State 0 Individualized (–) (–) (–)<br />
O/T, occupational therapist; SLT, speech and language therapist; SW, social worker.<br />
The algorithm is designed to provide a generic estimate of the implications for staff time associated with each item level of the<br />
NPTDA. The times were derived from the initial activity analysis presented in this article, but require testing and further<br />
development for other settings.<br />
The computerized NPTDA data entry sheet automatically ascribes the hours of intervention shown for each level to the lead<br />
discipline as shown for levels 0–3. When levels 3.5 or 4 are entered staff are prompted to supply the estimated times for each<br />
discipline involved.