The Rehabilitation Complexity Scale - King's College London
The Rehabilitation Complexity Scale - King's College London
The Rehabilitation Complexity Scale - King's College London
- No tags were found...
You also want an ePaper? Increase the reach of your titles
YUMPU automatically turns print PDFs into web optimized ePapers that Google loves.
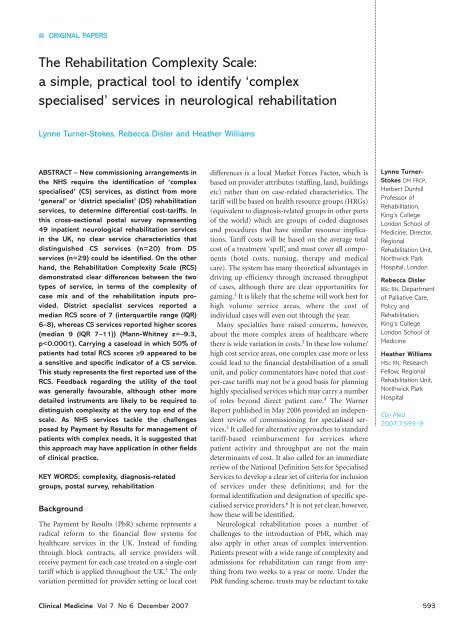
■ ORIGINAL PAPERS<strong>The</strong> <strong>Rehabilitation</strong> <strong>Complexity</strong> <strong>Scale</strong>:a simple, practical tool to identify ‘complexspecialised’ services in neurological rehabilitationLynne Turner-Stokes, Rebecca Disler and Heather WilliamsABSTRACT – New commissioning arrangements inthe NHS require the identification of ‘complexspecialised’ (CS) services, as distinct from more‘general’ or ‘district specialist’ (DS) rehabilitationservices, to determine differential cost-tariffs. Inthis cross-sectional postal survey representing49 inpatient neurological rehabilitation servicesin the UK, no clear service characteristics thatdistinguished CS services (n=20) from DSservices (n=29) could be identified. On the otherhand, the <strong>Rehabilitation</strong> <strong>Complexity</strong> <strong>Scale</strong> (RCS)demonstrated clear differences between the twotypes of service, in terms of the complexity ofcase mix and of the rehabilitation inputs provided.District specialist services reported amedian RCS score of 7 (interquartile range (IQR)6–8), whereas CS services reported higher scores(median 9 (IQR 7–11)) (Mann-Whitney z=–9.3,p
Lynne Turner-Stokes, Rebecca Disler and Heather Williamson the more complex cases unless there are arrangements inplace to ensure adequate reimbursement, and this poses thethreat of discrimination to an already vulnerable and needygroup of patients.<strong>The</strong> National Definition Set for Specialised Services in BrainInjury and Complex <strong>Rehabilitation</strong>, defines three levels ofservice in neurological rehabilitation (Fig 1): 71 Local general (LG) rehabilitation services which are nonspecialistservices mainly provided at primary care trust orcommunity team level.2 District specialist (DS) services – usually a consultant-ledservice covering a population of 300,000–500,000.3 Complex specialised (CS) services – tertiary or regionalservices providing for people with more complexrehabilitation needs – usually serving a population of1–3 million.It is the latter group which have been earmarked for ‘specialisedcommissioning’, according to the Warner Report. 2<strong>The</strong> UK network of neurological rehabilitation servicesincludes both CS and DS services. <strong>The</strong> distinction is blurred,however, because, in some areas, the DS services have developedto a level where they have many of the same facilities and cantake on quite complex cases, albeit in smaller numbers than theCS services. <strong>The</strong> problem is confounded by the fact thatrehabilitation is only included in the Department of Health’scurrent health coding system (ICD 10 codes) as additional‘z codes’ which are rarely reported in practice, and so almost noinformation exists centrally on which to base tariff costs forrehabilitation.To date, HRGs have been developed only for inpatientservices. <strong>The</strong> HRG set for rehabilitation (version 4.0) specificallyexcludes CS rehabilitation. According to the National DefinitionSet, this would exclude CS services, but not DS services, fromthese HRGs. <strong>The</strong> Expert Working Group for HRGs in rehabilitationtherefore endorsed the current HRG set with the provisothat further work be done to develop a transparent system todetermine banded tariffs for different levels of complexity, andto define CS services in terms of demonstrated service deliveryat the complex end of the spectrum.<strong>The</strong> <strong>Rehabilitation</strong> <strong>Complexity</strong> <strong>Scale</strong> (RCS) (Appendix 1) hasbeen designed to provide a simple classification of case mix interms of rehabilitation inputs provided. It was developed tostand alongside the new rehabilitation HRGs to provide verysimple coding information with regard to complexity that couldinform tariff banding in district and general rehabilitationsettings. If there are differences in case mix between DS and CSservices, however, one would expect it also to be sensitive tothese.<strong>The</strong> aims of this study were:• to identify any service characteristics that distinguishinpatient CS neurorehabilitation services from DS servicesin the UK• to explore utility of the RCS and to determine whether itcould be used to identify differences in the case mix of thetwo types of service.MethodsStudy designA cross-sectional survey of consultant members of the BritishSociety for <strong>Rehabilitation</strong> Medicine (BSRM), the principalprofessional society for doctors specialising in rehabilitationmedicine in the UK, was conducted by postal questionnaire.Service characteristics of a complex specialisedrehabilitation serviceProposed defining characteristics for complex specialised rehabilitationservices were drawn from the National Definition Setnumber 7. 7 A questionnaire was drafted to include the following:• Definitions of the different service types were given andrespondents were asked whether they considered theirinpatient neurological rehabilitation service to be a CSservice, a DS service or a LG service.• Details were requested about their service, including thenumber of beds, staffing levels in different disciplines, andapproximate length of stay (LOS). Also about anyreduction in bed capacity in the last two years.• Respondents were asked to tick service characteristics,facilities and procedures on a checklist, and to add anyother features which might distinguish a CS service.<strong>The</strong> questionnaire was approved by the BSRM Research andClinical Standards Committee. Following piloting in 10 centres,it was sent out to all consultant members of the BSRM. Thosenot involved in providing neurological rehabilitation serviceswere asked to indicate this and return the questionnaire. Wherea service had more than one consultant, respondents were askedto collaborate with colleagues to provide a single response.Those working in more than one centre, however, were invitedto provide a response for each service.Exploratory use of the RCS to examine case mixdifferences<strong>The</strong> RCS is a 15-point measure made up of four differentsubscales:• C: basic care and support needs (range 0–3)• N: nursing interventions (range 0–3)• T: intensity of total therapy intervention (range 0–6)• M: medical intervention (range 0–3).It should be reported in a manner analogous to the GlasgowComa <strong>Scale</strong>, eg RCS 7 (C2 N1 T3 M1).Consultants were asked to apply the RCS in a single snapshotcross-sectional survey of their current inpatient caseload during asingle week, and also to provide feedback about the scale,including: how easy it was to apply; whether or not they thoughtit was useful in distinguishing more complex cases; and whetherthey would be prepared to apply it on a regular basis to informcosting tariffs. <strong>The</strong>y were also asked to provide general qualitativecomment and feedback.594 Clinical Medicine Vol 7 No 6 December 2007
<strong>The</strong> <strong>Rehabilitation</strong> <strong>Complexity</strong> <strong>Scale</strong><strong>Complexity</strong> of needBanding:NPDSNPTDALevel of service specialisationCS rehabilitationUsual catchment population ~1–3 millionBanding:RCSScoreDS rehabilitationUsual catchment population ~300,000–500,000LG servicesLocal PCT and community areaAreascoveredbyproposedHRGSFig 1. Banding for different levels of complexity in rehabilitation. <strong>The</strong> version 4.0 health resource groups (HRGs) exclude complexspecialised (CS) rehabilitation services. Nevertheless they cover a wide range of complexity with wide cost variations. <strong>The</strong> <strong>Rehabilitation</strong><strong>Complexity</strong> <strong>Scale</strong> (RCS) may potentially be used for banding tariffs in the low–medium complexity range, and for identifying thoseservices which carry a highly complex caseload. More detailed tools such as the Northwick Park Dependency Score (NPDS) 8 andNorthwick Park <strong>The</strong>rapy Dependency Score (NPTDS) 9 or equivalent, are currently in development to band tariffs for more complex cases.DS = district specialist; LG = local general; PCT = primary care trust.Data handling and statisticsData were entered into a spreadsheet in Microsoft Excel, andtransferred to SPSS v11.5 for analysis. <strong>The</strong> DS and CS servicegroups were compared using chi-squared tests for dichotomouschecklist variables, and Mann-Whitney U tests for ordinal andcontinuous variables. Qualitative comments were collated usingsimple content analysis to identify main themes.ResultsFifty-eight responses were received. Nine of these were excludedas they did not provide inpatient neurological rehabilitationservices (8) or provided LG services (1). Of the remaining 49, 29described their service as DS and 20 as CS. Previous studiesthrough the BSRM suggest that its consultant membersrepresent about 120 different neurological rehabilitationservices in the UK, so this response rate represents about 40% ofthat pool.Table 1. Principal service characteristics compared between district specialist (DS) and complexspecialised (CS) services.DS services CS servicesMain service characteristics (n=29) (n=20) Mann-Whitney SignificanceMedian (IQR) Median (IQR) z value p valueTotal number of beds 16 (12–20) 21 (15–31) –1.8 0.07Bed reductions in the last 2 years 5 (4–6) 5 (2–7)in 6 unitsin 4 unitsStaffing WTE:Total medical staff (WTE) 2.3 (1.9–3.2) 4.0 (2.0–5.7) –2.11 0.03Medical staff to bed ratio 0.17 (0.10–0.19) 0.14 (0.10–0.26) –0.18 0.86Total nursing staff (WTE) 20.0 (14.0–26.0) 28.0 (21.2–46.5) –2.34 0.02Nursing staff to bed ratio 1.3 (1.0–1.8) 1.5 (1.2–2.2) –1.68 0.92Total therapy staff (WTE) 7.0 (5.4–11.6) 14.0 (8.0–16.2) –2.9 0.004<strong>The</strong>rapy staff to bed ratio 0.52 (0.33–0.67) 0.67 (0.50–0.77) –1.9 0.055Average LOS (weeks) 9 (7–13) 12 (8–16) –1.2 0.23Minimum LOS (weeks) 1 (1–5) 1 (1–2) –1.3 0.20Maximum LOS (weeks) 38 (20–72) 52 (26–58) –0.38 0.72IQR = interquartile range; LOS = length of stay; WTE = whole time equivalents.Clinical Medicine Vol 7 No 6 December 2007 595
Lynne Turner-Stokes, Rebecca Disler and Heather WilliamsTable 2. Analysis of distinguishing features of a complex specialised (CS) rehabilitation service.DS CSservices servicesService characteristics (%) (%) χ 2 p valueStaffingConsultant in rehabilitation 100 100 NA 1.0medicineConsultant in neuro- 62 79 1.35 0.24psychiatry/neuropsychology<strong>Rehabilitation</strong>-trained nurses 85 90 0.24 0.62AHPs at clinical specialist/ 37 70 5.00 0.02consultant gradeWorking practice and staff developmentMD case notes 81 90 0.66 0.41MD ward round/treatment 100 100 NA 1.0planningMD goal setting 100 100 NA 1.0MD outcome evaluation 77 75 0.50 0.82Specialist staff training offered 59 85 3.64 0.06Specialist registrar training 59 65 0.16 0.70programmeActive research >4 papers 11 25 1.57 0.26per yearRegular presentation at 33 70 6.18 0.01rehabilitation conferencesCaseloadMore than a third of caseload 74 90 1.88 0.26need ≥2 for most care tasksTake patients requiring 74 70 0.95 0.76one-to-one special nursingTake patients with tracheostomy 63 80 1.59 0.21Able to manage patients with 37 40 0.04 0.84aggressive behaviour>a third of caseload require 82 90 3.03 0.22MD input from >3 disciplines>a third of caseload require 63 80 1.59 0.21intensive input >4 hoursper daySpecial facilitiesLight workshop 26 45 2.39 0.30Heavy workshop 11 20 0.90 0.64Music therapy 7 0 1.62 0.44Art therapy 15 20 0.43 0.81Hydrotherapy 37 75 7.74 0.02Harness-treadmill training 26 55 4.75 0.09Custom-made splints/orthotics 85 95 1.30 0.52Patient computer facilities 66 90 6.4 0.04DS CSservices servicesService characteristics (%) (%) χ 2 p valueSpecial facilities – continuedElectro-assistive technology 55 70 2.56 0.28(eg environmental controlsystems)Special seating and wheelchair 66 85 4.70 0.09systems providedAssessment and demonstration 18 16 0.27 0.87of communication aidsSpecialist programmes of treatment offeredInpatient complex rehabilitation 81 90 0.84 0.66assessmentComa-arousal programme 15 20 4.63 0.10Specialist spasticity management 96 90 0.84 0.65Tracheopharyngeal 26 70 10.20 0.006managementGroup therapy programmes 48 55 1.23 0.54Cognitive/behavioural 51 70 2.99 0.22rehabilitation programmeTreatment under sections ofthe Mental Health Act 1983 18 5 2.07 0.36Sexual counselling 26 35 0.88 0.64Formal family support and 30 60 5.62 0.06counsellingComplex discharge planning 85 95 1.30 0.52Back to work programmes 30 55 3.76 0.15Medical support and facilitiesCT imaging 84 95 1.40 0.49MRI 84 95 1.40 0.49MRA 65 75 0.93 0.63Doppler vascular studies 85 85 0.18 0.91EMG 73 90 5.71 0.06EEG 73 80 3.26 0.1924-hour medical cover 78 85 0.63 0.7324-hour consultant on call 74 95 3.82 0.15Able to manage patients with 52 70 2.25 0.32acute intercurrent illnessNerve blocks 40 70 5.05 0.08Botulinum toxin injections 88 95 0.35 0.84Perendoscopic gastrostomy 78 80 3.03 0.86insertion/removalTendon release procedures 51 55 0.91 0.63Suprapubic catheter insertion 65 75 0.93 0.54Intrathecal pump insertion and 38 50 0.89 0.64maintenancePressure sore grafting 38 45 0.89 0.64AHPs = allied health professionals; CT = computed tomography; DS = district specialist; EEG = electroencephalography; EMG = electromyography;MD = multidisciplinary; MRA = magnetic resonance angiography; MRI = magnetic resonance imaging; NA = not applicable.596 Clinical Medicine Vol 7 No 6 December 2007
<strong>The</strong> <strong>Rehabilitation</strong> <strong>Complexity</strong> <strong>Scale</strong>Table 3. Comparison of <strong>Rehabilitation</strong> <strong>Complexity</strong> <strong>Scale</strong> (RCS) scores between the districtspecialist (DS) services and complex specialised (CS) services.DS services CS services(n=358) (n=297) Mann-Whitney SignificanceParameter Median Median(IQR) Range (IQR) Range z value p valueCare score 1(1–2) 0–3 2 (1–2) 0–3 –2.24 p=0.025Nursing score 2 (1–2) 0–3 2 (2–3) 0–3 –4.61 p
Lynne Turner-Stokes, Rebecca Disler and Heather WilliamsFeedback regarding utility of the RCSFeedback about the RCS from the 49 centres was generally positive.In all, 76% reported that it was very easy or fairly easy tocomplete, and only one said it was ‘fairly hard’; 55% thought itdistinguished complex cases and 81% said that they would bewilling to record this for all inpatients on a regular basis if it wereused as the basis for banded tariffs. Only 4% said they would notbe prepared to use the scale.Many qualitative comments were also received – not all ofthem related to the score itself. A brief summary of contentanalysis was as follows:• six respondents provided spontaneously positive comments(‘A very sensible approach to tackle such a difficultproblem’; ‘Very useful – just what is needed’)• fifteen (mainly from CS services) commented that it didnot provide enough detail in nursing (5), medical (4) ortherapy (6) needs, especially at the top end of the scale. Onthe other hand, one respondent (from a DS service) said,‘Please don’t make it any more complicated!’• eight expressed concern that, at least as used in thiscontext, the RCS score was dictated by delivery rather thanneed (‘I think 8/9 scores would be 10 or more if we hadmore therapists. MD team agree’; ‘We scored according towhat was provided. Patients would have benefited frommore’)• four stressed that rehabilitation complexity alone could notreplace LOS as a cost-determining factor• four commented on the timing of measurement, notingthat individuals’ need for intervention changes over time,so ideally the score needs to be applied on a repeated basis.Discussion<strong>The</strong>se results demonstrate that there are no clearly defined servicecharacteristics that can be used to distinguish a CS rehabilitationservice from a DS service per se. On the other hand, theRCS demonstrated very clear differences in the complexity ofcase mix and of the rehabilitation inputs provided. From the datapresented here, it would appear that carrying a caseload in which50% of patients have a total RCS score ≥9 is a reasonably sensitiveand specific indicator of a CS service. Respondents generallyfound the scale easy to use, and gave positive feedback regardingits usefulness in this context. Although it was developed in thecontext of neurological rehabilitation, the RCS may also haveapplication in other areas of rehabilitation, and possibly also inother areas of MD clinical practice, such as palliative care or careof the elderly.<strong>The</strong> most frequent comment, mainly coming from consultantsin CS services, was that the RCS did not provide sufficientdetail in the content or extent of input. In this context it isimportant to note that the scale was designed primarily to providea simple classification of rehabilitation needs in the contextof DS services (Fig 1). At the most complex end of the spectrum,more detailed evaluation will be needed to determine those lowvolume/high cost cases which lie outside these HRGs and meetthe requirements for CS rehabilitation. In neurorehabilitationsettings, the Northwick Park nursing Dependency <strong>Scale</strong> 8 and theNorthwick Park <strong>The</strong>rapy Dependency Assessment 9 have beendeveloped specifically to provide this greater level of detail. It isalso recognised within the HRG Expert Working Group thatequivalent instruments will need to be developed for otherspecialist areas of rehabilitation.Respondents also commented that the RCS as applied heremeasured the inputs delivered, as opposed to those needed. Thisis appropriate if the scale is used to provide information toinform tariff costs, which are based on actual service delivery. Itwould certainly be inappropriate to reward services for keepingcomplex patients in a local service which is not able to meet theirneeds, instead of referring them to the relevant CS service. On theother hand, the RCS could potentially be applied both to describethe level of input provided, and that required, in order to makethe case for funding a referral – or indeed on a population basisto argue for appropriate local resources.A recognised limitation of this study is that the respondentpool represents only about 40% of the total service pool in theUK. This may partly reflect the fact that the participationinvolved, not only filling in a questionnaire, but actually collectinglive data – and on a fairly tight timescale. On the otherhand, the responses came from a wide geographic spread coveringboth urban and rural areas, and a preliminary analysis ofthe first 36 drew similar conclusions, suggesting that the datahad largely reached saturation. <strong>The</strong> RCS itself has yet to be subjectedto full psychometric evaluation, but preliminary testingagainst the previously mentioned dependency scales suggests agood level of concurrent validity. 10In this study, CS services were identified on the basis of theresponders’ report, and in the absence of any previous benchmarkingsystem, it is possible that not all of these would qualifyon closer inspection. It is clearly not appropriate, however, to saythat a unit does or does not qualify for the status of a CS serviceon the basis of a single snapshot of data and more targeted workis required to determine precise criteria, and also whether thereare different cut-off points for different categories of rehabilitationservice, for example units catering for the walking woundedcategory of brain-injured patient, as opposed to post-acute neurorehabilitation.It is a matter of considerable concern, however,that 10 units reported a reduction in their inpatient bed base forspecialist/specialised neurological rehabilitation of up to 30%over the last two years. <strong>The</strong>se services are potentially vulnerableunder the new funding streams, and are vital to maintainthrough-flow of patients back to the community to relieve pressureon the acute neurosciences services. This underlines theimportance of developing suitable banded tariff systems forreimbursement within the PbR scheme in order to avoid furtherattrition in a service area which is already underprovided.AcknowledgementsWe are grateful to all the clinicians who responded to this survey,and to the MD teams who worked together to produce the data.598 Clinical Medicine Vol 7 No 6 December 2007
<strong>The</strong> <strong>Rehabilitation</strong> <strong>Complexity</strong> <strong>Scale</strong>Grateful thanks are particularly due to Dr David Cohen and tomembers of the <strong>Rehabilitation</strong> HRG Expert Working Group, inparticular Brigitt Bailey, Julia Bott, Barbara Howe and SallyHolman who provided input and comment in the early developmentof the RCS. Funding for the survey and for preparationof this manuscript was kindly provided by the Luff Foundation.Conflict of interestProfessor Turner-Stokes is the originator of the RCS, but has nofinancial interest in the tool, which is freely available.References1 Department of Health. Reforming NHS financial flows: payment byresults. <strong>London</strong>: DH, 2002.2 Rogers R, Williams S, Jarman B, Aylin P. ‘HRG drift’ and payment byresults. BMJ 2005;330:12.3 Read G. Payment by results: not what it seems. Clin Oncol 2006;18:1–2.4 Dixon J. Payment by results – new financial flows in the NHS. BMJ2004;328:969–70.5 Department of Health. Review of commissioning arrangements forspecialised services. <strong>The</strong> Warner Report. <strong>London</strong>: DH, 2006.6 Department of Health. Specialised Services National Definition Set.<strong>London</strong>: DH, 2002.7 Department of Health. Specialised Services National Definition SetNo 7: Complex specialised rehabilitation for brain injury and complexdisability (adult). <strong>London</strong>: DH, 2002.8 Turner-Stokes L, Tonge P, Nyein K et al. <strong>The</strong> Northwick ParkDependency Score (NPDS): a measure of nursing dependency inrehabilitation. Clin Rehabil 1998;12:304–18.9 Turner-Stokes L, Shaw A. <strong>The</strong> Northwick Park <strong>The</strong>rapy DependencyScore (NPTDA): development, preliminary evaluation and application.A report for the Department of Health project Grant 030/0066.<strong>London</strong>: King’s <strong>College</strong> <strong>London</strong>, 2006.10 Turner-Stokes L, Shetty S, Saulat A, Thu A. Exploratory audit ofpatient complexity in a complex specialised neurorehabilitationservice. In: British Society of <strong>Rehabilitation</strong> Medicine Newsletter,December 2006. www.bsrm.co.uk/news/Newsletter-Dec2006.pdfAppendix 1. <strong>The</strong> <strong>Rehabilitation</strong> <strong>Complexity</strong> <strong>Scale</strong>.Patient identificationName: Hospital No: Date of score:…../…../…….For each subscale, circle highest level applicableBasic care and support needsDescribes the approximate level of intervention for basic self-careC 0 Largely independent in basic care activitiesC 1 Requires help from 1 person for most basic care needsC 2 Requires help from 2 people for most basic care needsC 3 Requires help from >2 people for basic care needsOR Requires constant 1:1 supervisionSkilled nursing needsDescribes the level of intervention from qualified or skilledrehabilitation nursing staffN 0 No needs for skilled nursingN 1 Requires intervention from a qualified nurse (eg formonitoring, medication, dressings etc)N 2 Requires intervention from trained rehabilitation nursingstaffN 3 Requires highly specialist nursing care(eg for tracheostomy, behavioural management etc)<strong>The</strong>rapy interventionDescribes the approximate level of input that is given from therapydisciplinesState number of different therapy disciplines involved:≤2 3 4 ≥5 (Circle)T 0 No therapy intervention (eg awaiting discharge)T 1 Total therapy intervention ≤4 hours per week(or 25 hours per week(or >5 hrs/day)Medical interventionDescribes the approximate level of medical care environmentrequired for medical/surgical managementM 0 No active medical intervention(Could be managed by GP on basis of occasional visits)M 1 Basic investigation/monitoring/treatment(Requiring non-acute hospital care, could be delivered in acommunity hospital with day time medical cover)M 2 Specialist medical intervention(Requiring inpatient hospital care in DGH or specialisthospital setting)M 3 Acutely sick or potentially unstable medical condition(Requiring 24-hour on-site acute medical cover)Total C: N: T: M: Summed score: /15C = care; DGH = district general hospital; GP = general practitioner; M =medical; N = nursing; T = therapy.Clinical Medicine Vol 7 No 6 December 2007 599


