Modeling Heat and Mass Transfer in Bread during ... - COMSOL.com
Modeling Heat and Mass Transfer in Bread during ... - COMSOL.com
Modeling Heat and Mass Transfer in Bread during ... - COMSOL.com

Create successful ePaper yourself
Turn your PDF publications into a flip-book with our unique Google optimized e-Paper software.
<strong>Bread</strong> swell<strong>in</strong>g<br />
To simulate the volume expansion of the<br />
bread, different mechanical models exist (Zhang<br />
[13], Van<strong>in</strong> [8]). In first approximation, we<br />
<strong>in</strong>troduced <strong>in</strong>to the model a deformation of the<br />
bread <strong>com</strong><strong>in</strong>g from numerical results (Zhang<br />
[13]). In this case, the volume expansion is a<br />
function of time <strong>and</strong> is given by a radius<br />
expression:<br />
α<br />
( t)<br />
⎛V0 α(<br />
t)<br />
⎞<br />
R ( t)<br />
= ⎜ ⎟ with:<br />
⎝ π ⎠<br />
5<br />
4<br />
⎧<br />
⎫<br />
-4⎛<br />
t ⎞<br />
-3⎛<br />
t ⎞<br />
⎪- 210 ⎜ ⎟ + 510 ⎜ ⎟ ⎪<br />
⎪ ⎝ 60 ⎠ ⎝ 60 ⎠ ⎪<br />
⎪<br />
3 ⎪<br />
⎪<br />
-2⎛<br />
t ⎞<br />
- 4.4910 ⎜ ⎟ ⎪<br />
⎪ ⎝ 60 ⎠ ⎪<br />
⎪<br />
⎬ for t ≤ 360 s<br />
=<br />
2<br />
⎨<br />
-1⎛<br />
t ⎞ ⎪<br />
⎪+1.51710<br />
⎜ ⎟ ⎪<br />
⎪ ⎝ 60 ⎠ ⎪<br />
⎪<br />
-3⎛<br />
t ⎞<br />
⎪<br />
⎪+ 4.810 ⎜ ⎟ + 0.9968 ⎪<br />
⎪ ⎝ 60 ⎠<br />
⎭<br />
⎪<br />
⎩1.7132<br />
for t > 360 s<br />
4. Numerical model<br />
0.5<br />
equilibrium approach <strong>in</strong> <strong>com</strong>mercial software<br />
due to divergence of heat source term<br />
correspond<strong>in</strong>g to phase change. The choice of<br />
general form makes it possible to <strong>in</strong>troduce this<br />
approach.<br />
<strong>Heat</strong> source term has been modified to<br />
correspond to the PDE general form:<br />
∂T<br />
r r<br />
ρ C<br />
p<br />
+ ∇ ⋅<br />
l<br />
∂t<br />
r r<br />
W<br />
a ∂W<br />
− Dl<br />
∇W<br />
⋅∇Lv<br />
+ ρ<br />
s<br />
Lv<br />
∂t<br />
5. Results<br />
W<br />
( − λ∇T<br />
+ D L ∇W<br />
)<br />
v<br />
= −ρ<br />
C<br />
g<br />
r r<br />
⋅∇T<br />
p, gv g<br />
Simulation has been realised for a 15 m<strong>in</strong><br />
bak<strong>in</strong>g <strong>in</strong> an oven at 190°C. Simulated results are<br />
<strong>com</strong>pared with Zhang <strong>and</strong> Datta [13]<br />
experimental data.<br />
Figure 5 presents the evolution of<br />
temperature obta<strong>in</strong>ed <strong>in</strong> the center <strong>and</strong> at 1.5 mm<br />
of the surface.<br />
140<br />
120<br />
100<br />
r<br />
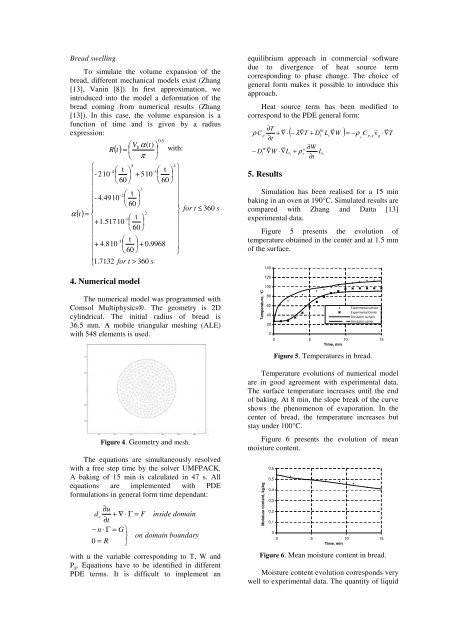
The numerical model was programmed with<br />
Comsol Multiphysics®. The geometry is 2D<br />
cyl<strong>in</strong>drical. The <strong>in</strong>itial radius of bread is<br />
36.5 mm. A mobile triangular mesh<strong>in</strong>g (ALE)<br />
with 548 elements is used.<br />
Temperature, °C<br />
80<br />
60<br />
40<br />
20<br />
0<br />
Experimental surface<br />
Experimental Center<br />
Simulation surface<br />
Simulation center<br />
0 5 10 15<br />
Time, m<strong>in</strong><br />
Figure 5. Temperatures <strong>in</strong> bread.<br />
Figure 4. Geometry <strong>and</strong> mesh.<br />
The equations are simultaneously resolved<br />
with a free step time by the solver UMFPACK.<br />
A bak<strong>in</strong>g of 15 m<strong>in</strong> is calculated <strong>in</strong> 47 s. All<br />
equations are implemented with PDE<br />
formulations <strong>in</strong> general form time dependant:<br />
∂u<br />
d a<br />
+ ∇ ⋅ Γ = F <strong>in</strong>side doma<strong>in</strong><br />
∂t<br />
− n ⋅ Γ = G⎫<br />
⎬ on doma<strong>in</strong> boundary<br />
0 = R ⎭<br />
with u the variable correspond<strong>in</strong>g to T, W <strong>and</strong><br />
P g . Equations have to be identified <strong>in</strong> different<br />
PDE terms. It is difficult to implement an<br />
Temperature evolutions of numerical model<br />
are <strong>in</strong> good agreement with experimental data.<br />
The surface temperature <strong>in</strong>creases until the end<br />
of bak<strong>in</strong>g. At 8 m<strong>in</strong>, the slope break of the curve<br />
shows the phenomenon of evaporation. In the<br />
center of bread, the temperature <strong>in</strong>creases but<br />
stay under 100°C.<br />
Figure 6 presents the evolution of mean<br />
moisture content.<br />
Moisture content, kg/kg<br />
0,6<br />
0,5<br />
0,4<br />
0,3<br />
0,2<br />
0,1<br />
0<br />
0 5 10 15<br />
Time, m<strong>in</strong><br />
Figure 6. Mean moisture content <strong>in</strong> bread.<br />
Moisture content evolution corresponds very<br />
well to experimental data. The quantity of liquid