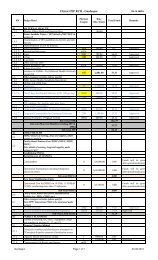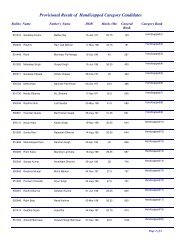
Data Quality and Validation
Data Quality and Validation
Data Quality and Validation

You also want an ePaper? Increase the reach of your titles
YUMPU automatically turns print PDFs into web optimized ePapers that Google loves.
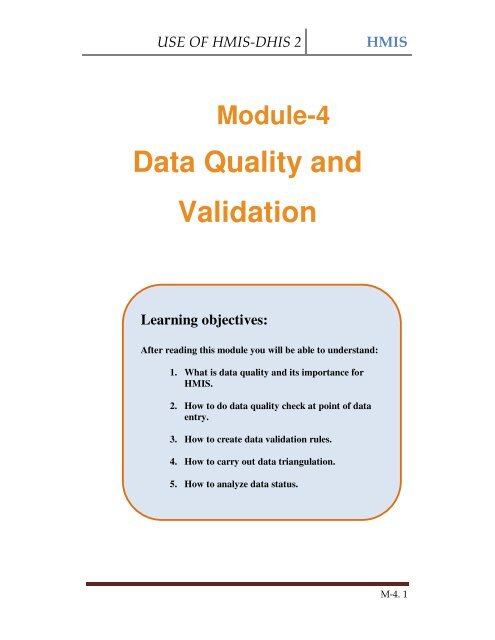
USE OF HMIS-DHIS 2<br />
HMIS<br />
Module-4<br />
<strong>Data</strong> <strong>Quality</strong> <strong>and</strong><br />
<strong>Validation</strong><br />
Learning objectives:<br />
After reading this module you will be able to underst<strong>and</strong>:<br />
1. What is data quality <strong>and</strong> its importance for<br />
HMIS.<br />
2. How to do data quality check at point of data<br />
entry.<br />
3. How to create data validation rules.<br />
4. How to carry out data triangulation.<br />
5. How to analyze data status.<br />
M-4. 1
USE OF HMIS-DHIS 2<br />
HMIS<br />
4.1 Overview of data quality check<br />
Ensuring data quality is a key concern in building an effective HMIS. <strong>Data</strong><br />
quality has different dimensions including:<br />
• Correctness: <strong>Data</strong> should be within the normal range for data<br />
collected at that facility. There should be no gross discrepancies<br />
when compared with data from related data elements.<br />
• Completeness: <strong>Data</strong> for all data elements for all health<br />
facilities/blocks/Taluka/districts should have been submitted.<br />
• Consistency: <strong>Data</strong> should be consistent with data entered during<br />
earlier months <strong>and</strong> years while allowing for changes with<br />
reorganization, increased work load, etc. <strong>and</strong> consistent with other<br />
similar facilities.<br />
• Timeliness: All data from all health facilities/blocks/Taluka/districts<br />
should be submitted at the appointed time.<br />
If we have poor quality data, we will have “garbage in <strong>and</strong> garbage out”<br />
situations. Use of poor quality data leads to ill informed decisions. So, the<br />
HMIS software should be built in with different tools to do data quality<br />
checks <strong>and</strong> validation.<br />
4.1.1 <strong>Data</strong> quality checks<br />
<strong>Data</strong> quality checking can be done through various means, including:<br />
1. At point of data entry, the software can check the data entered to<br />
see if it falls within the min-max ranges of that data element over<br />
the last six months or as defined by the user.<br />
M-4. 2
USE OF HMIS-DHIS 2<br />
HMIS<br />
2. Defining various validation rules, which can be run once the user<br />
has finished data entry. The user can also check the entered data<br />
for a particular period <strong>and</strong> Organization Unit(s) against the<br />
validation rules, <strong>and</strong> display the violations for these validation rules.<br />
3. Analysis of data sets, ie, examining gaps in data.<br />
4. <strong>Data</strong> triangulation which is comparing the same data or indicator<br />
from different sources.<br />
4.2 <strong>Data</strong> quality check at the point of data entry<br />
<strong>Data</strong> quality can be checked at the point of data entry in the following two<br />
ways:<br />
a) By setting the minimum <strong>and</strong> maximum value range for each element<br />
manually. Or<br />
b) Generating the min-max values using the DHIS 2 if there is historical<br />
data available for that data element.<br />
a) Setting the minimum <strong>and</strong> maximum value range manually<br />
If you are using the default entry screen click on the element for which you<br />
want to set the min-max value, as shown below.<br />
M-4. 3
USE OF HMIS-DHIS 2<br />
HMIS<br />
A pop up window will appear as shown below. Here you can enter the<br />
min-max values.<br />
On subsequent data entry if the value entered does not fall within the set<br />
min-max range the text box will change colour to red. The user will also<br />
M-4. 4
USE OF HMIS-DHIS 2<br />
HMIS<br />
get a popup as shown below. This change in colour is a prompt to check<br />
the data entered <strong>and</strong> make necessary correction.<br />
On the data entry screen the users also have the option to add a comment<br />
on how the discrepant figure might be explained (if required). This you can<br />
do by using the drop down menu of the ‘comment’ box.<br />
In case you are using the custom data entry screen which is displayed<br />
when you deselect the ‘default data entry form’ option on the top right<br />
M-4. 5
USE OF HMIS-DHIS 2<br />
HMIS<br />
corner of the screen. In this case the minimum <strong>and</strong> maximum values can<br />
be added by double-clicking on the data entry box instead of the data<br />
element.<br />
b) Generated min-max values<br />
If you have a minimum of six months of your data entered in the DHIS2 it<br />
is possible to generate the min-max value, element-wise, using the<br />
DHIS2. In such case you merely need to click on the ‘Generate min-max’<br />
tab as shown below.<br />
In case of default data entry screen the min <strong>and</strong> max values, when<br />
generated, will appear on the left <strong>and</strong> right side of the data entry box.<br />
In case you deselect the default data entry form the generated values will<br />
appear on the top right end of the screen as shown in the following<br />
screenshot.<br />
M-4. 6
USE OF HMIS-DHIS 2<br />
HMIS<br />
M-4. 7
USE OF HMIS-DHIS 2<br />
HMIS<br />
4.3 Defining <strong>Validation</strong> Rules<br />
<strong>Validation</strong> rules are data quality check mechanism based on verification of<br />
the logic of relation between related data elements. <strong>Validation</strong> rules are<br />
relational expressions comprising of related data elements <strong>and</strong> an<br />
operator that states the expected / logical relation between the elements.<br />
For example number of infant deaths cannot be greater than the number<br />
of deliveries. As can be seen from the example a validation rule comprises<br />
of a left <strong>and</strong> a right side. On the left side of the expression, there must be<br />
a data element or a combination of data elements, <strong>and</strong> the same on the<br />
right side. The left <strong>and</strong> right h<strong>and</strong> sides of the expression are separated<br />
with a validation operator which states the realtion between the elements.<br />
As validation rules have a relational property there must be atleast two<br />
data elements for which the validation rules may be applied.<br />
4.3.1 Types of validation operators (equal to, less than,<br />
greater than):<br />
Following are some validation operators used for data quality analysis in<br />
DHIS.<br />
• Equal to: It will validate the validation rule only if both sides are<br />
equal.<br />
• Not Equal to: It will validate the rule if both the sides Not Equal<br />
• Greater Than: It will validate the rule if the left side is greater than<br />
the right side.<br />
• Greater Than Equal to: It will validate the rule, if the left side is<br />
Greater or Equal to the right h<strong>and</strong> side.<br />
M-4. 8
USE OF HMIS-DHIS 2<br />
HMIS<br />
• Less Than: It will validate the rule if the left side is smaller than the<br />
right h<strong>and</strong> side.<br />
• Less Than Equal to: It will validate the rule if the left side is either<br />
smaller or equal to the right side.<br />
4.3.2 Adding new validation rule<br />
Follow the steps below to add a new valiadtion rule.<br />
First select the <strong>Data</strong> <strong>Quality</strong> module from the drop down menu of the<br />
Services module located on the main tool bar.<br />
M-4. 9
USE OF HMIS-DHIS 2<br />
HMIS<br />
In the screen that is displayed – <strong>Validation</strong> Rule Management screen, click<br />
on ‘Add new’<br />
The following screen will appear.<br />
M-4. 10
USE OF HMIS-DHIS 2<br />
HMIS<br />
Enter the first three fields specifically validation rule name, description of<br />
the validation rule <strong>and</strong> select the particular operator that forms the<br />
validation rule. Next click on the Edit left side button to enter the ‘left side’<br />
details of the concerned validation rule.<br />
The following steps can be used by the user:<br />
1. Add Description<br />
2. Select data element from the Available <strong>Data</strong> Elements options<br />
shown on the right side.<br />
3. Add Operators in between the data elements to generate the<br />
desired formula.<br />
M-4. 11
USE OF HMIS-DHIS 2<br />
HMIS<br />
4. When you have entered the required fields click on ‘update’. This<br />
will return you to the previous window. Here click on the ‘Edit right<br />
side’ <strong>and</strong> follow the steps that you followed for the ‘Edit left’.<br />
4.4 <strong>Validation</strong> Checks<br />
When you open the <strong>Data</strong> <strong>Quality</strong> module you will see a menu on the left<br />
side that lists different options related to validation rules. For purposes of<br />
validation checks you will need to use the ‘Run validation’ option. This is<br />
described below.<br />
4.4.1 Run validation:<br />
1. If you select the run validation option the following screen will be<br />
displayed.<br />
M-4. 12
USE OF HMIS-DHIS 2<br />
HMIS<br />
2. You will be required to specify the period for which you want to run the<br />
validation check by selecting the start <strong>and</strong> end dates. This you can do by<br />
using the drop down calender provided for the date fields.<br />
3. Next select the particular organisation unit (s) for which you want to run<br />
the validation.<br />
4. Finally click on the ‘validate’ tab.<br />
5. When you click on ‘Validate’ (Number 5 on the screenshot) button the<br />
following popup will be displayed which will list the validation rules that are<br />
violated with data values of the elements constituting the particular<br />
validation rule.<br />
M-4. 13
USE OF HMIS-DHIS 2<br />
HMIS<br />
4.4 Diagnosing the source of the validation<br />
violation:<br />
This you can accomplish by selecting the ‘Run validation by avergae’<br />
option. You can run this validation after entering the required fields of the<br />
‘run validation’ screen which includes the organisation units(s) <strong>and</strong> the<br />
period for which you want to run the validation. The result of ‘Run<br />
validation by average’ is a pop up screen (see screenshot below) that<br />
displays the percentage of validation rules violated by the selected<br />
orgnaisation unit(s).<br />
Amogst the Orgunits showing violation, select the one which has<br />
maximum violation percentange, <strong>and</strong> drill down to get its detailed<br />
M-4. 14
USE OF HMIS-DHIS 2<br />
HMIS<br />
validation list. You could do the same for any other organisation unit as<br />
well.<br />
The screen that gets displayed presents the list of validation rules that<br />
have been violated by the specific orgnaisation unit (see screenshot<br />
below).<br />
M-4. 15
USE OF HMIS-DHIS 2<br />
HMIS<br />
To get drilldown for one validation, click on any validation rule, it will give<br />
you the detailed validation analysis for the selected orgunit <strong>and</strong> its<br />
immediate children.<br />
M-4. 16
USE OF HMIS-DHIS 2<br />
HMIS<br />
If you click on any orgunit you can drilldown to its children.<br />
4.5 Analysis of data status<br />
The purpose of analysis of data status is to see what is the percentage of<br />
missing or unreported data either by data elements or by facilities.<br />
4.5.1 Types of missing data<br />
Missing data can be listed by facilities <strong>and</strong> or data elements. Missing data<br />
creates different kinds of problems, such as:<br />
1. Incomplete reports.<br />
2. Indicator calculations will be misleading as there will be some<br />
numerator or denominator that is missing.<br />
3. Effective decisions cannot be based on incomplete data.<br />
M-4. 17
USE OF HMIS-DHIS 2<br />
HMIS<br />
4. Probably, the facility which is not reporting data is the one which<br />
needs more care <strong>and</strong> support.<br />
4.5.2 Generating missing data reports by facilities, data<br />
elements <strong>and</strong> periods<br />
‘<strong>Data</strong> Status’ option provides us the tool to analyze how much data is<br />
entered. You can find this option in Dashboard Module which is inturn<br />
displayed in the drop down menu of the services module.<br />
Clicking on the dashboard module will lead to the following screen where<br />
you can find the ‘<strong>Data</strong> status’ option.<br />
M-4. 18
USE OF HMIS-DHIS 2<br />
HMIS<br />
Once you click on ‘<strong>Data</strong> Status’ option you will get the following screen<br />
where you can select orgunit, dataset, period for which you want to<br />
generate the data status. Once you have done this click on ‘View data<br />
status’ as shown below.<br />
M-4. 19
USE OF HMIS-DHIS 2<br />
HMIS<br />
You will get the following output.<br />
From here you can go drill down to its immediate children by clicking any<br />
orgunit to obtain more detailed sub facility wise data status.<br />
M-4. 20
USE OF HMIS-DHIS 2<br />
HMIS<br />
4.6 <strong>Data</strong> Triangulation<br />
<strong>Data</strong> (for example on institutional deliveries) is collected from different<br />
sources such as routine health data <strong>and</strong> NFHS surveys. By plotting data<br />
on this data element across the three surveys <strong>and</strong> juxtaposing it with<br />
routine data, we can have a method of data triangulation.<br />
Da t a ::Tr ia ngul a t ion<br />
Routine<br />
Health<br />
<strong>Data</strong><br />
Routine Health data.<br />
Collected <strong>and</strong> reported<br />
routinely every month<br />
NFHS<br />
Large scale, multi-round<br />
survey conducted in a<br />
representative sample of<br />
households throughout<br />
India. Once in 5 years.<br />
Census<br />
largest single source<br />
of a variety of<br />
statistical information<br />
on different<br />
characteristics of the<br />
people of India once in<br />
10 years<br />
Trends in Institutional Deliveries (%)<br />
80<br />
70<br />
60<br />
50<br />
40<br />
30<br />
20<br />
10<br />
37<br />
46<br />
55<br />
70<br />
0<br />
NFHS 1 NFHS 2 NFHS 3 Apr-Aug 07<br />
37 46 55 70<br />
In the boxes below, the NFHS trends in institutional delivery are compared with<br />
trends of monthly figures from the state routine HMIS.<br />
Trends in Institutional Deliveries (% )<br />
Institutional Deliveries (%)<br />
80<br />
70<br />
70<br />
60<br />
55<br />
50<br />
46<br />
40<br />
37<br />
30<br />
20<br />
10<br />
0<br />
NFHS 1 NFHS 2 NFHS 3 Apr-Aug 07<br />
Institutional Delivery 37 46 55 70<br />
74<br />
73<br />
72<br />
71<br />
70<br />
69<br />
68<br />
67<br />
66<br />
65<br />
64<br />
63<br />
73.2<br />
70.7<br />
70.3<br />
69<br />
66.9<br />
M-4. 21<br />
Apr-07 May-07 Jun-07 Jul-07 Aug-07