The State of Arsenic in Nepal - 2003 - Harvard University ...
The State of Arsenic in Nepal - 2003 - Harvard University ...
The State of Arsenic in Nepal - 2003 - Harvard University ...

Create successful ePaper yourself
Turn your PDF publications into a flip-book with our unique Google optimized e-Paper software.
Mahendrakot VDC <strong>of</strong> Kapilbastu and the sixth one (571 ppb)<br />
was observed <strong>in</strong> Sarwal VDC <strong>of</strong> Nawalparasi. <strong>The</strong> arsenic<br />
concentration at each <strong>of</strong> 20 districts <strong>of</strong> the Terai is shown <strong>in</strong><br />
Figure 7.5.<br />
Table 7.3.<br />
Basic statistics <strong>of</strong> arsenic concentration<br />
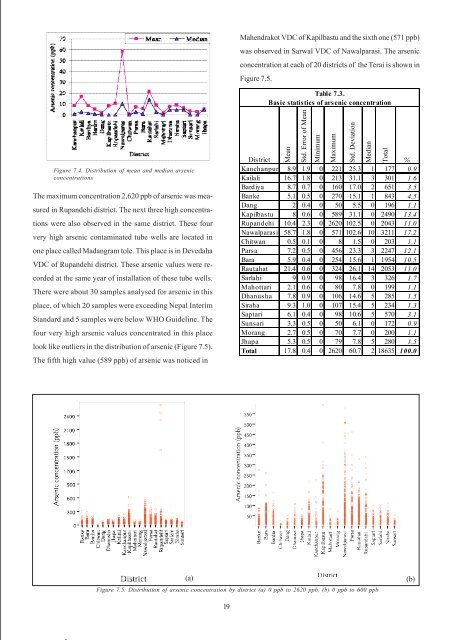
Figure 7.4. Distribution <strong>of</strong> mean and median arsenic<br />
concentrations<br />
<strong>The</strong> maximum concentration 2,620 ppb <strong>of</strong> arsenic was measured<br />
<strong>in</strong> Rupandehi district. <strong>The</strong> next three high concentrations<br />
were also observed <strong>in</strong> the same district. <strong>The</strong>se four<br />
very high arsenic contam<strong>in</strong>ated tube wells are located <strong>in</strong><br />
one place called Madangram tole. This place is <strong>in</strong> Devedaha<br />
VDC <strong>of</strong> Rupandehi district. <strong>The</strong>se arsenic values were recorded<br />
at the same year <strong>of</strong> <strong>in</strong>stallation <strong>of</strong> these tube wells.<br />
<strong>The</strong>re were about 30 samples analysed for arsenic <strong>in</strong> this<br />
place, <strong>of</strong> which 20 samples were exceed<strong>in</strong>g <strong>Nepal</strong> Interim<br />
Standard and 5 samples were below WHO Guidel<strong>in</strong>e. <strong>The</strong><br />
four very high arsenic values concentrated <strong>in</strong> this place<br />
look like outliers <strong>in</strong> the distribution <strong>of</strong> arsenic (Figure 7.5).<br />
<strong>The</strong> fifth high value (589 ppb) <strong>of</strong> arsenic was noticed <strong>in</strong><br />
Mean<br />
Std. Error <strong>of</strong> Mean<br />
M<strong>in</strong>imum<br />
Maximum<br />
Std. Deviation<br />
Median<br />
Total<br />
District<br />
%<br />
Kanchanpur 8.9 1.9 0 221 25.3 1 177 0.9<br />
Kailali 16.7 1.8 0 213 31.1 3 301 1.6<br />
Bardiya 8.7 0.7 0 160 17.0 2 651 3.5<br />
Banke 5.1 0.5 0 270 15.1 1 843 4.5<br />
Dang 2 0.4 0 50 5.5 0 196 1.1<br />
Kapilbastu 8 0.6 0 589 31.1 0 2490 13.4<br />
Rupandehi 10.4 2.3 0 2620 102.5 0 2043 11.0<br />
Nawalparasi 58.7 1.8 0 571 102.6 10 3211 17.2<br />
Chitwan 0.5 0.1 0 8 1.5 0 203 1.1<br />
Parsa 7.2 0.5 0 456 23.3 3 2247 12.1<br />
Bara 5.9 0.4 0 254 15.6 1 1954 10.5<br />
Rautahat 21.4 0.6 0 324 26.1 14 2053 11.0<br />
Sarlahi 9 0.9 0 98 16.4 3 326 1.7<br />
Mahottari 2.1 0.6 0 80 7.8 0 199 1.1<br />
Dhanusha 7.8 0.9 0 106 14.6 5 285 1.5<br />
Siraha 9.3 1.0 0 107 15.4 5 234 1.3<br />
Saptari 6.1 0.4 0 98 10.6 5 570 3.1<br />
Sunsari 3.3 0.5 0 50 6.1 0 172 0.9<br />
Morang 2.7 0.5 0 70 7.7 0 200 1.1<br />
Jhapa 5.3 0.5 0 79 7.8 5 280 1.5<br />
Total 17.8 0.4 0 2620 60.7 2 18635 100.0<br />
(a)<br />
Figure 7.5. Distribution <strong>of</strong> arsenic concentration by district (a) 0 ppb to 2620 ppb, (b) 0 ppb to 600 ppb<br />
(b)<br />
19