India Monetary Policy Review – June 2013 - Business Research ...
India Monetary Policy Review – June 2013 - Business Research ...
India Monetary Policy Review – June 2013 - Business Research ...

Create successful ePaper yourself
Turn your PDF publications into a flip-book with our unique Google optimized e-Paper software.
International Economics > <strong>India</strong> 20 <strong>June</strong> <strong>2013</strong><br />
<strong>India</strong> <strong>–</strong> <strong>Monetary</strong> <strong>Policy</strong> <strong>Review</strong><br />
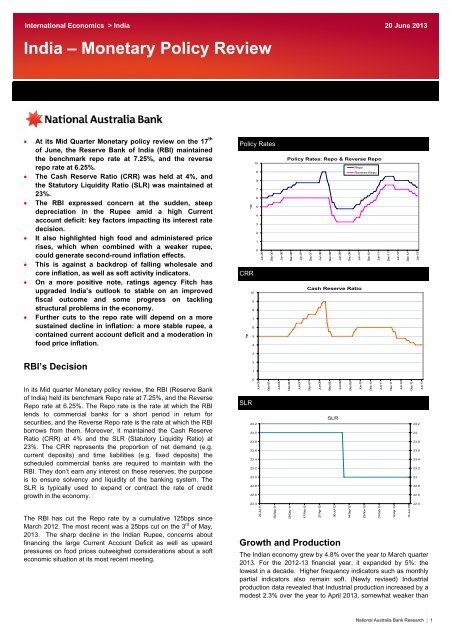
• At its Mid Quarter <strong>Monetary</strong> policy review on the 17 th<br />
of <strong>June</strong>, the Reserve Bank of <strong>India</strong> (RBI) maintained<br />
the benchmark repo rate at 7.25%, and the reverse<br />
repo rate at 6.25%.<br />
• The Cash Reserve Ratio (CRR) was held at 4%, and<br />
the Statutory Liquidity Ratio (SLR) was maintained at<br />
23%.<br />
• The RBI expressed concern at the sudden, steep<br />
depreciation in the Rupee amid a high Current<br />
account deficit: key factors impacting its interest rate<br />
decision.<br />
• It also highlighted high food and administered price<br />
rises, which when combined with a weaker rupee,<br />
could generate second-round inflation effects.<br />
• This is against a backdrop of falling wholesale and<br />
core inflation, as well as soft activity indicators.<br />
• On a more positive note, ratings agency Fitch has<br />
upgraded <strong>India</strong>’s outlook to stable on an improved<br />
fiscal outcome and some progress on tackling<br />
structural problems in the economy.<br />
• Further cuts to the repo rate will depend on a more<br />
sustained decline in inflation: a more stable rupee, a<br />
contained current account deficit and a moderation in<br />
food price inflation.<br />
<strong>Policy</strong> Rates<br />
%ge<br />
CRR<br />
%ge<br />
10<br />
9<br />
8<br />
7<br />
6<br />
5<br />
4<br />
10<br />
9<br />
8<br />
7<br />
6<br />
5<br />
4<br />
3<br />
2<br />
1<br />
0<br />
Jun-05<br />
Dec-05<br />
Jun-06<br />
<strong>Policy</strong> Rates: Repo & Reverse Repo<br />
Repo<br />
Reverse Repo<br />
Dec-06<br />
Jun-07<br />
Dec-07<br />
Jun-08<br />
Dec-08<br />
Jun-09<br />
Dec-09<br />
Jun-10<br />
Dec-10<br />
Jun-11<br />
Cash Reserve Ratio<br />
Dec-11<br />
Jun-12<br />
Dec-12<br />
Jun-13<br />
3<br />
RBI’s Decision<br />
2<br />
1<br />
In its Mid quarter <strong>Monetary</strong> policy review, the RBI (Reserve Bank<br />
of <strong>India</strong>) held its benchmark Repo rate at 7.25%, and the Reverse<br />
Repo rate at 6.25%. The Repo rate is the rate at which the RBI<br />
lends to commercial banks for a short period in return for<br />
securities, and the Reverse Repo rate is the rate at which the RBI<br />
borrows from them. Moreover, it maintained the Cash Reserve<br />
Ratio (CRR) at 4% and the SLR (Statutory Liquidity Ratio) at<br />
23%. The CRR represents the proportion of net demand (e.g.<br />
current deposits) and time liabilities (e.g. fixed deposits) the<br />
scheduled commercial banks are required to maintain with the<br />
RBI. They don’t earn any interest on these reserves; the purpose<br />
is to ensure solvency and liquidity of the banking system. The<br />
SLR is typically used to expand or contract the rate of credit<br />
growth in the economy.<br />
The RBI has cut the Repo rate by a cumulative 125bps since<br />
March 2012. The most recent was a 25bps cut on the 3 rd of May,<br />
<strong>2013</strong>. The sharp decline in the <strong>India</strong>n Rupee, concerns about<br />
financing the large Current Account Deficit as well as upward<br />
pressures on food prices outweighed considerations about a soft<br />
economic situation at its most recent meeting.<br />
SLR<br />
0<br />
24.2<br />
24.0<br />
23.8<br />
23.6<br />
23.4<br />
23.2<br />
23.0<br />
22.8<br />
22.6<br />
22.4<br />
Jun-05<br />
22-Jul-11<br />
Dec-05<br />
30-Sep-11<br />
Jun-06<br />
Dec-06<br />
09-Dec-11<br />
Jun-07<br />
Dec-07<br />
Jun-08<br />
Dec-08<br />
SLR<br />
Growth and Production<br />
17-Feb-12<br />
27-Apr-12<br />
06-Jul-12<br />
The <strong>India</strong>n economy grew by 4.8% over the year to March quarter<br />
<strong>2013</strong>. For the 2012-13 financial year, it expanded by 5%: the<br />
lowest in a decade. Higher frequency indicators such as monthly<br />
partial indicators also remain soft. (Newly revised) Industrial<br />
production data revealed that Industrial production increased by a<br />
modest 2.3% over the year to April <strong>2013</strong>, somewhat weaker than<br />
Jun-09<br />
Dec-09<br />
14-Sep-12<br />
Jun-10<br />
23-Nov-12<br />
Dec-10<br />
Jun-11<br />
01-Feb-13<br />
Dec-11<br />
12-Apr-13<br />
Jun-12<br />
17-Jun-13<br />
Dec-12<br />
24.2<br />
24<br />
23.8<br />
23.6<br />
23.4<br />
23.2<br />
23<br />
22.8<br />
22.6<br />
22.4<br />
Jun-13<br />
National Australia Bank <strong>Research</strong> | 1
<strong>India</strong> Update 20 <strong>June</strong> <strong>2013</strong><br />
the 3.4% over the year to March <strong>2013</strong>. Mining was particularly<br />
weak once again, contracting by -3%; manufacturing was also<br />
muted, rising by 2.8%. One somewhat bright spot was the 4.2%<br />
rise in electricity production, the highest since January <strong>2013</strong>. By<br />
use, the volatile capital goods production showed a marked<br />
slowdown: increasing by 1% c.f. the 9% expansion in March. The<br />
RBI highlighted these figures as evidence of ‘damped investment<br />
demand’. Intermediate goods, a sort of leading indicator of<br />
downstream production, rose by 2.4%, in line with the overall<br />
average. Consumer goods production rose to 2.8% (from 1.8% in<br />
March), driven largely by an increase in production of nondurables.<br />
This could indicate a tentative improvement in<br />
consumer confidence, but it’s still way too early to say much<br />
definite with passenger car sales falling by -6.6% over the year to<br />
May <strong>2013</strong>.<br />
Prices<br />
Wholesale price inflation continued its downtrend in May: it rose<br />
by 4.7% over the year to May <strong>2013</strong>, below the 4.9% outcome<br />
recorded in April. Moreover, core inflation too trended lower: it<br />
increased by 2.5% over the year to May <strong>2013</strong>, well below recent<br />
outcomes. These results could indicate a lack of pricing power<br />
among <strong>India</strong>n businesses. However, prices remain elevated with<br />
respect to food (13.9%) and electricity (27.9%) as the<br />
Government allows an increase in cost recovery from electric<br />
utilities. In the food category, prices for cereals (rice, bajra and<br />
wheat) and protein based foods (fish and meat) remain<br />
particularly high.<br />
Headline and Core Inflation<br />
GDP<br />
12<br />
<strong>India</strong>n WPI: Core and Headline<br />
12<br />
Real GDP: Factor Cost<br />
10<br />
Headline<br />
Core<br />
8<br />
10<br />
6<br />
8<br />
4<br />
%ge YOY<br />
6<br />
4.8%<br />
2<br />
0<br />
4<br />
-2<br />
2<br />
0<br />
-4<br />
May-05<br />
Nov-05<br />
May-06<br />
Nov-06<br />
May-07<br />
Nov-07<br />
May-08<br />
Nov-08<br />
May-09<br />
Nov-09<br />
May-10<br />
Nov-10<br />
May-11<br />
Nov-11<br />
May-12<br />
Nov-12<br />
May-13<br />
Mar-08<br />
Sep-08<br />
Mar-09<br />
Sep-09<br />
Mar-10<br />
Sep-10<br />
Mar-11<br />
Sep-11<br />
Mar-12<br />
Sep-12<br />
Mar-13<br />
WPI Components<br />
Industrial Production: Sectoral<br />
Industrial Production: Sectoral<br />
30<br />
IP<br />
25<br />
Mfg<br />
Mining<br />
Electricity<br />
%ge YOY<br />
30.00<br />
25.00<br />
20.00<br />
<strong>India</strong>n WPI: Components<br />
Core<br />
Food<br />
Electricity<br />
20<br />
15.00<br />
15<br />
10.00<br />
%ge YOY<br />
10<br />
5<br />
5.00<br />
0.00<br />
0<br />
-5.00<br />
May-05<br />
Nov-05<br />
May-06<br />
Nov-06<br />
May-07<br />
Nov-07<br />
May-08<br />
Nov-08<br />
May-09<br />
Nov-09<br />
May-10<br />
Nov-10<br />
May-11<br />
Nov-11<br />
May-12<br />
Nov-12<br />
May-13<br />
-5<br />
-10<br />
-15<br />
Apr-07<br />
Oct-07<br />
Apr-08<br />
Oct-08<br />
Apr-09<br />
Oct-09<br />
Apr-10<br />
Oct-10<br />
Apr-11<br />
Oct-11<br />
Apr-12<br />
Industrial Production <strong>–</strong> Use Based<br />
Industrial Production: Use-Based<br />
Oct-12<br />
Apr-13<br />
Retail inflation (measured by the CPI) edged lower to 9.3%, the<br />
second successive month it has remained below 10%. The<br />
relatively higher weight for food in the CPI basket helps account<br />
for the differential between the WPI and CPI measures more<br />
broadly.<br />
WPI and CPI<br />
80<br />
60<br />
Basic<br />
Inter<br />
Capital<br />
Consumer<br />
%ge YOY<br />
18<br />
16<br />
WPI<br />
New CPI<br />
<strong>India</strong>n Inflation: WPI vs CPI<br />
40<br />
14<br />
12<br />
Industrial Workers<br />
CPI<br />
%ge YOY<br />
20<br />
10<br />
8<br />
0<br />
6<br />
4<br />
-20<br />
2<br />
0<br />
-2<br />
-40<br />
Apr-07<br />
Oct-07<br />
Apr-08<br />
Oct-08<br />
Apr-09<br />
Oct-09<br />
Apr-10<br />
Oct-10<br />
Apr-11<br />
Oct-11<br />
Apr-12<br />
Oct-12<br />
Apr-13<br />
May-05<br />
Nov-05<br />
May-06<br />
Nov-06<br />
May-07<br />
Nov-07<br />
May-08<br />
Nov-08<br />
Whilst the RBI would be encouraged by the moderation in<br />
wholesale and core inflation, it would like to see further downward<br />
pressure on food prices as well as consumer prices.<br />
May-09<br />
Nov-09<br />
May-10<br />
Nov-10<br />
May-11<br />
Nov-11<br />
May-12<br />
Nov-12<br />
May-13<br />
20 <strong>June</strong> <strong>2013</strong> National Australia Bank <strong>Research</strong> | 2
<strong>India</strong> Update 20 <strong>June</strong> <strong>2013</strong><br />
External Situation<br />
The RBI’s hand has been stayed primarily due to external events,<br />
the most notable being the sharp fall in the Rupee. Between 22 nd<br />
of May and the 11 th of <strong>June</strong> the rupee depreciated by 6%. It is<br />
currently trading around INR58/USD. Comments by the Federal<br />
Reserve Chairman, Ben Bernanke, about possibly ‘tapering’ the<br />
USD85 billion/month Quantitative Easing program has set off<br />
alarm bells in financial markets, triggering a sharp sell-off in<br />
emerging market currencies, including the <strong>India</strong>n Rupee.<br />
<strong>India</strong>n Rupee to US Dollar<br />
Current Account Deficit<br />
%ge<br />
15.0<br />
10.0<br />
5.0<br />
0.0<br />
-5.0<br />
-10.0<br />
Components of the Current Account: Ratio to GDP<br />
30<br />
INR/USD<br />
30<br />
-15.0<br />
Services<br />
Trade<br />
Transfers<br />
Income<br />
-20.0<br />
35<br />
35<br />
Jun-09<br />
Sep-09<br />
Dec-09<br />
Mar-10<br />
Jun-10<br />
Sep-10<br />
Dec-10<br />
Mar-11<br />
Jun-11<br />
Sep-11<br />
Dec-11<br />
Mar-12<br />
Jun-12<br />
Sep-12<br />
Dec-12<br />
40<br />
45<br />
50<br />
55<br />
Depreciation<br />
40<br />
45<br />
50<br />
55<br />
A significant development has been the decision by ratings<br />
agency, Fitch to upgrade <strong>India</strong>’s outlook to Stable from Negative.<br />
The contained fiscal deficit, as well as progress made in removing<br />
structural bottlenecks had been cited as Fitch as factors<br />
supporting the upgrade. Moreover, the Finance Minister, P<br />
Chidambaram is expected to announce measures around the end<br />
of <strong>June</strong> to spur foreign investor interest including relaxing limits on<br />
FDI participation in various sectors.<br />
60<br />
21-Jul-09<br />
11-Dec-09<br />
04-May-10<br />
22-Sep-10<br />
10-Feb-11<br />
A weakening rupee could generate import price inflation.<br />
Moreover, it could also weaken the allure of holding <strong>India</strong>n assets<br />
among overseas investors, as the Rupee depreciates and<br />
becomes more volatile. Foreign Institutional Investors have pulled<br />
out nearly USD3.8bn from the <strong>India</strong>n debt market during <strong>June</strong> 3-<br />
<strong>June</strong> 17. Were this trend to be sustained over a longer period, it<br />
could generate some problems as <strong>India</strong> has a high Current<br />
Account Deficit (CAD). The CAD came in at 6.7% of GDP during<br />
the December quarter, 2012. For the 2012-13 financial year, it is<br />
anticipated to be in excess of 5% of GDP.<br />
01-Jul-11<br />
25-Nov-11<br />
19-Apr-12<br />
07-Sep-12<br />
28-Jan-13<br />
18-Jun-13<br />
60<br />
Volatility Index<br />
%ge Index<br />
40<br />
35<br />
30<br />
25<br />
20<br />
15<br />
10<br />
5<br />
Volatility: NIFTY VIX<br />
More recent trade data too hasn’t been very encouraging: <strong>India</strong>’s<br />
trade deficit in the month of May rose to USD20.1bn, up from<br />
USD17.8bn in April. It is expected that the trade and Current<br />
account position will gradually improve over the course of the<br />
<strong>2013</strong>-14 financial year. The main reason is the expected decline<br />
in gold imports due to policy changes by the Government and the<br />
RBI: import duties on gold have risen to 8%; it is more difficult for<br />
banks and trading houses to import gold; and there are<br />
restrictions on bank lending against gold.<br />
The significance of the high CAD and weakening rupee in<br />
determining the RBI’s decision can be summarised by the<br />
following comment by Duvvuri Subbarao, RBI’s Governor: ‘Shifts<br />
in global market sentiment can trigger sudden stop and reversal<br />
of capital from a broad swath of emerging markets, swiftly<br />
amplifying risks to the outlook. <strong>India</strong> is not an exception’.<br />
0<br />
18-Jul-11<br />
26-Sep-11<br />
05-Dec-11<br />
13-Feb-12<br />
23-Apr-12<br />
The <strong>India</strong> VIX (Volatility Index), an indicator of expected market<br />
volatility over the ensuring 30 days, rose in the aftermath of<br />
tensions in currency markets. It appears that some of the volatility<br />
has spilled over into equity markets. The index reached a high of<br />
19.49% on the 11 th of <strong>June</strong>, the day the <strong>India</strong>n rupee plunged to<br />
its lowest level. The index has since eased somewhat, but<br />
remains high relative to levels in the early part of <strong>2013</strong>.<br />
John Sharma<br />
Economist <strong>–</strong> Sovereign Risk<br />
john.sharma@nab.com.au<br />
Tom Taylor<br />
Head of International Economics<br />
02-Jul-12<br />
10-Sep-12<br />
19-Nov-12<br />
28-Jan-13<br />
08-Apr-13<br />
17-Jun-13<br />
Tom_Taylor@national.com.au<br />
20 <strong>June</strong> <strong>2013</strong> National Australia Bank <strong>Research</strong> | 3
<strong>India</strong> Update 20 <strong>June</strong> <strong>2013</strong><br />
Global Markets <strong>Research</strong><br />
Group Economics<br />
Peter Jolly<br />
Global Head of <strong>Research</strong><br />
+61 2 9237 1406<br />
Australia<br />
Economics<br />
Rob Henderson<br />
Chief Economist, Markets<br />
+61 2 9237 1836<br />
Spiros Papadopoulos<br />
Senior Economist<br />
+61 3 8641 0978<br />
David de Garis<br />
Senior Economist<br />
+61 3 8641 3045<br />
FX Strategy<br />
Ray Attrill<br />
Global Co-Head of FX Strategy<br />
+61 2 9237 1848<br />
Emma Lawson<br />
Senior Currency Strategist<br />
+61 2 9237 8154<br />
Interest Rate Strategy<br />
Skye Masters<br />
Head of Interest Rate Strategy<br />
+61 2 9295 1196<br />
Rodrigo Catril<br />
Interest Rate Strategist<br />
+61 2 9293 7109<br />
Credit <strong>Research</strong><br />
Michael Bush<br />
Head of Credit <strong>Research</strong><br />
+61 3 8641 0575<br />
Ken Hanton<br />
Senior Credit Analyst<br />
+61 2 9237 1405<br />
New Zealand<br />
Stephen Toplis<br />
Head of <strong>Research</strong>, NZ<br />
+64 4 474 6905<br />
Craig Ebert<br />
Senior Economist<br />
+64 4 474 6799<br />
Doug Steel<br />
Markets Economist<br />
+64 4 474 6923<br />
Mike Jones<br />
Currency Strategist<br />
+64 4 924 7652<br />
Kymberly Martin<br />
Strategist<br />
+64 4 924 7654<br />
UK/Europe<br />
Nick Parsons<br />
Head of <strong>Research</strong>, UK/Europe,<br />
and Global Co-Head of FX Strategy<br />
+ 44 207 710 2993<br />
Gavin Friend<br />
Markets Strategist<br />
+44 207 710 2155<br />
Tom Vosa<br />
Head of Market Economics<br />
+44 207 710 1573<br />
Simon Ballard<br />
Senior Credit Strategist<br />
+44 207 710 2917<br />
Derek Allassani<br />
<strong>Research</strong> Production Manager<br />
+44 207 710 1532<br />
Alan Oster<br />
Group Chief Economist<br />
+61 3 8634 2927<br />
Tom Taylor<br />
Head of Economics, International<br />
+61 3 8634 1883<br />
Rob Brooker<br />
Head of Australian Economics<br />
+61 3 8634 1663<br />
Alexandra Knight<br />
Economist <strong>–</strong> Australia<br />
+(61 3) 9208 8035<br />
Vyanne Lai<br />
Economist <strong>–</strong> Agribusiness<br />
+(61 3) 8634 0198<br />
Dean Pearson<br />
Head of Industry Analysis<br />
+(61 3) 8634 2331<br />
Robert De Iure<br />
Senior Economist <strong>–</strong> Property<br />
+(61 3) 8634 4611<br />
Brien McDonald<br />
Economist <strong>–</strong> Industry Analysis<br />
+(61 3) 8634 3837<br />
Gerard Burg<br />
Economist <strong>–</strong> Industry Analysis<br />
+(61 3) 8634 2778<br />
John Sharma<br />
Economist <strong>–</strong> Sovereign Risk<br />
+(61 3) 8634 4514<br />
James Glenn<br />
Economist <strong>–</strong> Asia<br />
+(61 3) 9208 8129<br />
Tony Kelly<br />
Economist <strong>–</strong> International<br />
+(61 3) 9208 5049<br />
Equities<br />
Peter Cashmore<br />
Senior Real Estate Equity Analyst<br />
+61 2 9237 8156<br />
Jenny Khamphet<br />
Senior Real Estate Equity Analyst<br />
+61 2 9237 9538<br />
Important Notice<br />
This document has been prepared by National Australia Bank Limited ABN 12 004 044 937 AFSL 230686 ("NAB"). Any advice<br />
contained in this document has been prepared without taking into account your objectives, financial situation or needs. Before acting<br />
on any advice in this document, NAB recommends that you consider whether the advice is appropriate for your circumstances. NAB<br />
recommends that you obtain and consider the relevant Product Disclosure Statement or other disclosure document, before making<br />
any decision about a product including whether to acquire or to continue to hold it.<br />
20 <strong>June</strong> <strong>2013</strong> National Australia Bank <strong>Research</strong> | 4
<strong>India</strong> Update 20 <strong>June</strong> <strong>2013</strong><br />
Important Notices<br />
Disclaimer: This document has been prepared by National Australia Bank Limited ABN 12 004 044 937 AFSL 230686 ("NAB"). Any advice contained<br />
in this document has been prepared without taking into account your objectives, financial situation or needs. Before acting on any advice in this<br />
document, NAB recommends that you consider whether the advice is appropriate for your circumstances. NAB recommends that you obtain and<br />
consider the relevant Product Disclosure Statement or other disclosure document, before making any decision about a product including whether to<br />
acquire or to continue to hold it. Products are issued by NAB unless otherwise specified.<br />
So far as laws and regulatory requirements permit, NAB, its related companies, associated entities and any officer, employee, agent, adviser or<br />
contractor thereof (the "NAB Group") does not warrant or represent that the information, recommendations, opinions or conclusions contained in this<br />
document ("Information") is accurate, reliable, complete or current. The Information is indicative and prepared for information purposes only and does<br />
not purport to contain all matters relevant to any particular investment or financial instrument. The Information is not intended to be relied upon and in<br />
all cases anyone proposing to use the Information should independently verify and check its accuracy, completeness, reliability and suitability obtain<br />
appropriate professional advice. The Information is not intended to create any legal or fiduciary relationship and nothing contained in this document will<br />
be considered an invitation to engage in business, a recommendation, guidance, invitation, inducement, proposal, advice or solicitation to provide<br />
investment, financial or banking services or an invitation to engage in business or invest, buy, sell or deal in any securities or other financial<br />
instruments.<br />
The Information is subject to change without notice, but the NAB Group shall not be under any duty to update or correct it. All statements as to future<br />
matters are not guaranteed to be accurate and any statements as to past performance do not represent future performance.<br />
The NAB Group takes various positions and/or roles in relation to financial products and services, and (subject to NAB policies) may hold a position or<br />
act as a price-maker in the financial instruments of any company or issuer discussed within this document, or act and receive fees as an underwriter,<br />
placement agent, adviser, broker or lender to such company or issuer. The NAB Group may transact, for its own account or for the account of any<br />
client(s), the securities of or other financial instruments relating to any company or issuer described in the Information, including in a manner that is<br />
inconsistent with or contrary to the Information.<br />
Subject to any terms implied by law and which cannot be excluded, the NAB Group shall not be liable for any errors, omissions, defects or<br />
misrepresentations in the Information (including by reasons of negligence, negligent misstatement or otherwise) or for any loss or damage (whether<br />
direct or indirect) suffered by persons who use or rely on the Information. If any law prohibits the exclusion of such liability, the NAB Group limits its<br />
liability to the re-supply of the Information, provided that such limitation is permitted by law and is fair and reasonable.<br />
This document is intended for clients of the NAB Group only and may not be reproduced or distributed without the consent of NAB. The Information is<br />
governed by, and is to be construed in accordance with, the laws in force in the State of Victoria, Australia.<br />
Analyst Disclaimer: The Information accurately reflects the personal views of the author(s) about the securities, issuers and other subject matters<br />
discussed, and is based upon sources reasonably believed to be reliable and accurate. The views of the author(s) do not necessarily reflect the views<br />
of the NAB Group. No part of the compensation of the author(s) was, is, or will be, directly or indirectly, related to any specific recommendations or<br />
views expressed. <strong>Research</strong> analysts responsible for this report receive compensation based upon, among other factors, the overall profitability of the<br />
Global Markets Division of NAB.<br />
United Kingdom: If this document is distributed in the United Kingdom, such distribution is by National Australia Bank Limited, 88 Wood Street,<br />
London EC2V 7QQ. Registered in England BR1924. Head Office: 800 Bourke Street, Docklands, Victoria, 3008. Incorporated with limited liability in<br />
the State of Victoria, Australia. Authorised and regulated by the Australian Prudential Regulation Authority. Authorised in the UK by the Prudential<br />
Regulation Authority. Subject to regulation by the Financial Conduct Authority and limited regulation by the Prudential Regulation Authority.<br />
Details about the extent of our regulation by the Prudential Regulation Authority are available from us on request.<br />
USA: If this document is distributed in the United States, such distribution is by nabSecurities, LLC. This document is not intended as an offer or<br />
solicitation for the purchase or sale of any securities, financial instrument or product or to provide financial services. It is not the intention of<br />
nabSecurities to create legal relations on the basis of information provided herein.<br />
Hong Kong: In Hong Kong this document is for distribution only to "professional investors" within the meaning of Schedule 1 to the Securities and<br />
Futures Ordinance (Cap. 571, Laws of Hong Kong) ("SFO") and any rules made thereunder and may not be redistributed in whole or in part in Hong<br />
Kong to any person. Issued by National Australia Bank Limited, a licensed bank under the Banking Ordinance (Cap. 155, Laws of Hong Kong) and a<br />
registered institution under the SFO (central entity number: AAO169).<br />
New Zealand: This publication has been provided for general information only. Although every effort has been made to ensure this publication is<br />
accurate the contents should not be relied upon or used as a basis for entering into any products described in this publication. To the extent that any<br />
information or recommendations in this publication constitute financial advice, they do not take into account any person’s particular financial situation<br />
or goals. Bank of New Zealand strongly recommends readers seek independent legal/financial advice prior to acting in relation to any of the matters<br />
discussed in this publication. Neither Bank of New Zealand nor any person involved in this publication accepts any liability for any loss or damage<br />
whatsoever may directly or indirectly result from any advice, opinion, information, representation or omission, whether negligent or otherwise,<br />
contained in this publication. National Australia Bank Limited is not a registered bank in New Zealand.<br />
Japan: National Australia Bank Ltd. has no license of securities-related business in Japan. Therefore, this document is only for your information<br />
purpose and is not intended as an offer or solicitation for the purchase or sale of the securities described herein or for any other action.<br />
20 <strong>June</strong> <strong>2013</strong> National Australia Bank <strong>Research</strong> | 5