Nab Online Retail Sales Index - Business Research and Insights ...
Nab Online Retail Sales Index - Business Research and Insights ...
Nab Online Retail Sales Index - Business Research and Insights ...

Create successful ePaper yourself
Turn your PDF publications into a flip-book with our unique Google optimized e-Paper software.
NAB <strong>Online</strong> <strong>Retail</strong> <strong>Sales</strong> <strong>Index</strong><br />
Indepth report – October 2012<br />
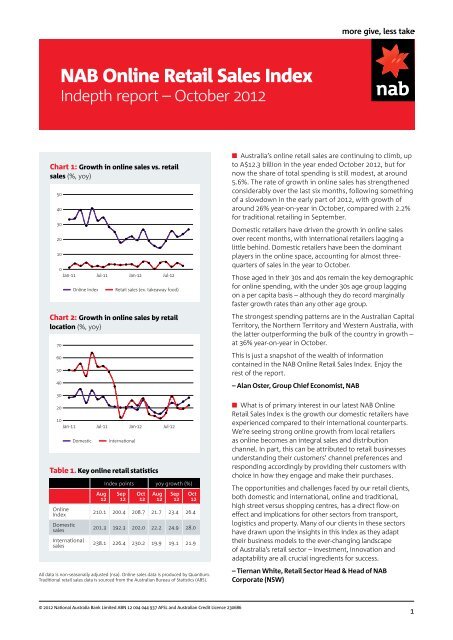
Chart 1: Growth in online sales vs. retail<br />
sales (%, yoy)<br />
50<br />
40<br />
30<br />
20<br />
10<br />
0<br />
Jan-11 Jul-11 Jan-12 Jul-12<br />
<strong>Online</strong> <strong>Index</strong><br />
<strong>Retail</strong> sales (ex. takeaway food)<br />
Chart 2: Growth in online sales by retail<br />
location (%, yoy)<br />
70<br />
60<br />
50<br />
40<br />
30<br />
20<br />
10<br />
Jan-11 Jul-11 Jan-12 Jul-12<br />
Domestic<br />
International<br />
Table 1. Key online retail statistics<br />
<strong>Online</strong><br />
<strong>Index</strong><br />
Domestic<br />
sales<br />
International<br />
sales<br />
Aug<br />
12<br />
<strong>Index</strong> points yoy growth (%)<br />
Sep<br />
12<br />
Oct<br />
12 Aug<br />
12<br />
Sep<br />
12<br />
© 2012 National Australia Bank Limited ABN 12 004 044 937 AFSL <strong>and</strong> Australian Credit Licence 230686<br />
Oct<br />
12<br />
210.1 200.4 208.7 21.7 23.4 26.4<br />
201.3 192.3 202.0 22.2 24.9 28.0<br />
238.1 226.4 230.2 19.9 19.1 21.9<br />
All data is non-seasonally adjusted (nsa). <strong>Online</strong> sales data is produced by Quantium.<br />
Traditional retail sales data is sourced from the Australian Bureau of Statistics (ABS).<br />
n Australia’s online retail sales are continuing to climb, up<br />
to A$12.3 billion in the year ended October 2012, but for<br />
now the share of total spending is still modest, at around<br />
5.6%. The rate of growth in online sales has strengthened<br />
considerably over the last six months, following something<br />
of a slowdown in the early part of 2012, with growth of<br />
around 26% year-on-year in October, compared with 2.2%<br />
for traditional retailing in September.<br />
Domestic retailers have driven the growth in online sales<br />
over recent months, with international retailers lagging a<br />
little behind. Domestic retailers have been the dominant<br />
players in the online space, accounting for almost threequarters<br />
of sales in the year to October.<br />
Those aged in their 30s <strong>and</strong> 40s remain the key demographic<br />
for online spending, with the under 30s age group lagging<br />
on a per capita basis – although they do record marginally<br />
faster growth rates than any other age group.<br />
The strongest spending patterns are in the Australian Capital<br />
Territory, the Northern Territory <strong>and</strong> Western Australia, with<br />
the latter outperforming the bulk of the country in growth –<br />
at 36% year-on-year in October.<br />
This is just a snapshot of the wealth of information<br />
contained in the NAB <strong>Online</strong> <strong>Retail</strong> <strong>Sales</strong> <strong>Index</strong>. Enjoy the<br />
rest of the report.<br />
– Alan Oster, Group Chief Economist, NAB<br />
n What is of primary interest in our latest NAB <strong>Online</strong><br />
<strong>Retail</strong> <strong>Sales</strong> <strong>Index</strong> is the growth our domestic retailers have<br />
experienced compared to their international counterparts.<br />
We’re seeing strong online growth from local retailers<br />
as online becomes an integral sales <strong>and</strong> distribution<br />
channel. In part, this can be attributed to retail businesses<br />
underst<strong>and</strong>ing their customers’ channel preferences <strong>and</strong><br />
responding accordingly by providing their customers with<br />
choice in how they engage <strong>and</strong> make their purchases.<br />
The opportunities <strong>and</strong> challenges faced by our retail clients,<br />
both domestic <strong>and</strong> international, online <strong>and</strong> traditional,<br />
high street versus shopping centres, has a direct flow-on<br />
effect <strong>and</strong> implications for other sectors from transport,<br />
logistics <strong>and</strong> property. Many of our clients in these sectors<br />
have drawn upon the insights in this <strong>Index</strong> as they adapt<br />
their business models to the ever-changing l<strong>and</strong>scape<br />
of Australia’s retail sector – investment, innovation <strong>and</strong><br />
adaptability are all crucial ingredients for success.<br />
– Tiernan White, <strong>Retail</strong> Sector Head & Head of NAB<br />
Corporate (NSW)<br />
1
NAB <strong>Online</strong> <strong>Retail</strong> <strong>Sales</strong> <strong>Index</strong><br />
2<br />
At a glance<br />
Traditional vs online (nsa, October yoy)<br />
Growth in traditional<br />
retail sales (September)<br />
5.6%<br />
2.2%<br />
Growth in online<br />
retail sales<br />
26%<br />
<strong>Online</strong> purchases hit A$12.3bn or<br />
5.6% of the size of traditional retailing<br />
Share of total online spend by sector <strong>and</strong> age group<br />
Share of spend (%)<br />
All<br />
ages<br />
<strong>Online</strong> <strong>Retail</strong> <strong>Sales</strong> <strong>Index</strong><br />
continues to trend higher<br />
The NAB <strong>Online</strong> <strong>Retail</strong> <strong>Sales</strong> <strong>Index</strong> has continued<br />
to trend upwards in recent months, to 209 points<br />
in October 2012 (chart 3).<br />
During the 12 months to October 2012, Australia’s<br />
online retail spending totalled around A$12.3 billion.<br />
When compared with traditional bricks & mortar<br />
retail sales, the level of online spending remains<br />
quite modest. For the year to September 2012,<br />
traditional retail sales* totalled A$221 billion –<br />
indicating that online sales are equivalent to<br />
around 5.6% of the traditional sector.<br />
As detailed on page 4, the composition of<br />
traditional <strong>and</strong> online retail sales differs notably.<br />
When food & beverages are excluded from both<br />
series, online retail sales increases to almost 9.1%<br />
of total non-food spending (up from 8.7% in July).<br />
<strong>Online</strong> sales record a pickup<br />
in growth rates – up 26% yoy<br />
in October<br />
The rate of growth in online sales has strengthened<br />
considerably over the last six months, following a<br />
slowdown in the early part of 2012.<br />
In October, online retail sales grew by around 26%<br />
year-on-year, compared with the low point of just<br />
14% year-on-year in May (chart 4).<br />
Growth rates for the traditional retail sector are<br />
far more modest – coming off a considerably larger<br />
base – with an increase of 2.2% year-on-year in<br />
September (on a non-seasonally adjusted basis).<br />
When seasonal factors are included, growth rates<br />
for the traditional sector have eased slightly in<br />
recent months, back to around 3% year-on-year<br />
in October.<br />
* Traditional retail sales exclude cafés, restaurants <strong>and</strong> takeaway food to create a<br />
like-for-like comparison.<br />
Chart 3: <strong>Online</strong> index vs. retail sales<br />
(nsa, monthly)<br />
240<br />
200<br />
160<br />
120<br />
80<br />
Jan-10 Jul-10 Jan-11 Jul-11 Jan-12 Jul-12<br />
50<br />
40<br />
30<br />
20<br />
10<br />
<strong>Online</strong> <strong>Index</strong><br />
ABS retail sales (ex. takeaway food)<br />
Chart 4: Growth in online sales vs. retail<br />
sales (%, yoy)<br />
0<br />
Jan-11 Jul-11 Jan-12 Jul-12<br />
70<br />
60<br />
50<br />
40<br />
30<br />
20<br />
<strong>Online</strong> <strong>Index</strong><br />
<strong>Retail</strong> sales (ex. takeaway food)<br />
Chart 5: Growth in online sales by retail<br />
location (%, yoy)<br />
10<br />
Jan-11 Jul-11 Jan-12 Jul-12<br />
Domestic<br />
Indepth report – October 2012<br />
International<br />
3
NAB <strong>Online</strong> <strong>Retail</strong> <strong>Sales</strong> <strong>Index</strong><br />
4<br />
Chart 6: <strong>Online</strong> index by retail location<br />
(nsa, monthly)<br />
240<br />
200<br />
160<br />
120<br />
80<br />
Jan-10 Jul-10 Jan-11 Jul-11 Jan-12 Jul-12<br />
0.80<br />
0.75<br />
0.70<br />
0.65<br />
Domestic<br />
International<br />
Chart 7: Share of online sales by retail<br />
location (nsa, monthly)<br />
0.60<br />
Jan-10 Jul-10 Jan-11 Jul-11 Jan-12 Jul-12<br />
Domestic (LHS)<br />
International (RHS)<br />
Chart 8: <strong>Online</strong> index by category<br />
(nsa, monthly)<br />
240<br />
220<br />
200<br />
180<br />
160<br />
140<br />
120<br />
100<br />
80<br />
Jan-10 Jul-10 Jan-11 Jul-11 Jan-12 Jul-12<br />
Sector 1 Sector 2 Sector 3 Sector 4<br />
0.40<br />
0.35<br />
0.30<br />
0.25<br />
0.20<br />
Domestic retailers driving<br />
growth, with international<br />
marginally softer<br />
Recent months have seen a steady increase in the<br />
growth rates for domestic sales, while international<br />
online retail sales have lagged marginally. This is in<br />
contrast to the period between November 2011 <strong>and</strong><br />
July 2012, when there was a close relationship between<br />
the two series (chart 5).<br />
Domestic sales increased by 28% year-on-year in<br />
October 2012, while international sales increased<br />
by 22% year-on-year.<br />
As we have previously noted, the large divergence<br />
in growth rates in the first half of 2011 was related<br />
to a one-off surge in international sales in late 2010.<br />
International index more volatile in<br />
2012, <strong>and</strong> a little softer since August<br />
The international index has been far more volatile over<br />
the last six months – reflecting the relatively subdued<br />
growth rates for most of this period (compared with<br />
domestic), along with the spike in growth in July.<br />
Since August, the trend for international sales has been<br />
comparatively softer. The international index was at 230<br />
points in October, compared with 202 points for the<br />
domestic sales index (chart 6).<br />
Domestic retailers continue to<br />
control the majority of sales<br />
Domestic retailers – defined in our index as those that<br />
are Australian for tax purposes – control the majority<br />
of online retail sales in Australia. From late 2010, the<br />
share of domestic sales has trended around 73%,<br />
reflecting the similar trends in growth rates for both<br />
series (chart 7). In recent months, it has edged slightly<br />
higher – to 74%.<br />
“Traditional toy sale peaks for<br />
discount department stores are now<br />
mirrored in their online trade.”<br />
Tony Davis, Quantium
Growth in Toys & Media has slowed<br />
significantly, while Household<br />
Goods & Electronics lags<br />
Share of total spend in 12 months to October 2012<br />
% Sector 1. <strong>Online</strong> Auctions, Department<br />
48 Stores, Fashion, Cosmetics, Variety Stores.<br />
% Sector 2. Home, Furniture, Appliances,<br />
19 Electronics.<br />
% Sector 3. Recreation, Toys, Games &<br />
21 Hobbies, Music, Movies, Books.<br />
% Sector 4. Groceries, Liquor &<br />
13 Specialised Food.<br />
Note: Totals may not sum to 100% due to rounding<br />
We continue to observe some divergent trends between<br />
the individual categories of online sales (chart 8).<br />
Growth rates for Sectors 1 (Auctions, Department Stores<br />
& Fashion), 3 (Toys & Media) <strong>and</strong> 4 (Food & Beverages)<br />
have exhibited relatively low levels of volatility over the<br />
last year – ranging between 15% <strong>and</strong> 35% year-on-year.<br />
In contrast, Sector 2 (Household Goods & Electronics)<br />
has been far more volatile – with this sector recording<br />
year-on-year declines in individual months over the past<br />
year (chart 9).<br />
Compared with somewhat divergent trends in 2011,<br />
there has been a convergence in the growth rates for<br />
Sectors 1, 3 <strong>and</strong> 4, with Sector 3 recording the most<br />
significant slow down. For the first half of 2011, this<br />
sector recorded the strongest rates of growth, before<br />
slowing sharply in October 2011.<br />
By age group, there remain some notable differences<br />
in spending by category – with the under 30s having<br />
a larger than average share of spending in Sectors 1<br />
<strong>and</strong> 3, while being notably below average in Sector 4.<br />
The profiles for those aged in their 30s, 40s <strong>and</strong> 50s<br />
are closer to the national average, while those aged 60<br />
<strong>and</strong> over have a larger than average spend in Sector 4<br />
(infographic page 2).<br />
60<br />
40<br />
20<br />
0<br />
Indepth report – October 2012<br />
Chart 9: <strong>Online</strong> index growth by category<br />
(%, yoy)<br />
-20<br />
Jan-11 Jul-11 Jan-12 Jul-12<br />
25<br />
20<br />
15<br />
10<br />
5<br />
0<br />
Sector 1 Sector 2 Sector 3 Sector 4<br />
Chart 10: Share of spending by age group<br />
(year to October 2012)<br />
Under<br />
30<br />
30s 40s 50s 60+ Under<br />
30<br />
Under 30 consists of of ages 18 18 to to 30.<br />
30s 40s 50s 60+<br />
Share of spend (%) Per capita (index)<br />
Chart 11: Growth of spending by age group<br />
(%, yoy)<br />
60<br />
40<br />
20<br />
0<br />
Jan-11 Jul-11 Jan-12 Jul-12<br />
Under 30 30s 40s 50s 60+<br />
140<br />
120<br />
100<br />
80<br />
60<br />
40<br />
5
NAB <strong>Online</strong> <strong>Retail</strong> <strong>Sales</strong> <strong>Index</strong><br />
6<br />
Chart 12: Share of spending by state<br />
(year to October 2012)<br />
40<br />
30<br />
20<br />
10<br />
0<br />
NSW<br />
VIC<br />
QLD<br />
WA<br />
SA<br />
TAS<br />
ACT<br />
NT<br />
NSW<br />
VIC<br />
QLD<br />
WA<br />
SA<br />
TAS<br />
ACT<br />
NT<br />
Share of spend (%) Per capita (index)<br />
Chart 13: Growth of spending by state<br />
(%, yoy)<br />
40<br />
30<br />
20<br />
10<br />
0<br />
Nov-11 Apr-12 Sep-12<br />
WA NT QLD SA<br />
Chart 13B: Growth of spending by state<br />
(%, yoy)<br />
40<br />
30<br />
20<br />
10<br />
0<br />
Nov-11 Apr-12 Sep-12<br />
VIC NSW TAS ACT<br />
140<br />
120<br />
100<br />
80<br />
60<br />
Per capita spending remains<br />
dominated by the 30s <strong>and</strong> 40s<br />
The share of spending by age group has<br />
remained quite stable since we commenced tracking<br />
online retail sales. In an absolute sense, those in their<br />
40s <strong>and</strong> younger account for the majority of sales – at<br />
around 23% for each group in the year to October<br />
2012 (chart 10). However, on a per capita basis, the<br />
bulk of spending is recorded among those in their 30s<br />
<strong>and</strong> 40s – with the under 30s age group recording<br />
below average spending – likely a reflection of their<br />
relative lack of purchasing power.<br />
Compared with some notable divergence in growth<br />
rates in 2011, trends in growth rates by age group have<br />
been much more uniform over the last year – although<br />
the under 30s have recorded marginally stronger<br />
growth rates than other age groups for much of this<br />
time (chart 11).<br />
Per capita spending strongest<br />
in the ACT, NT <strong>and</strong> WA<br />
At a state level, online spending is dominated by the<br />
largest states – with New South Wales (NSW), Victoria<br />
(VIC) <strong>and</strong> Queensl<strong>and</strong> (QLD) accounting for 76% of<br />
total online retail spending (chart 12). However, on<br />
a per capita basis, the ACT has the strongest level of<br />
spending, followed by the Northern Territory (NT) <strong>and</strong><br />
Western Australia (WA).<br />
Growth trends for NSW, VIC, South Australia (SA) <strong>and</strong><br />
the ACT have been relatively uniform in 2012 – <strong>and</strong><br />
in line with the national average (chart 13). Generally,<br />
growth has been marginally stronger in QLD <strong>and</strong> also<br />
stronger than average in the NT – although these<br />
rates have been highly volatile, due in part to the<br />
small population. In terms of growth, WA continues to<br />
outperform the bulk of the country – at 36% year-onyear<br />
in October.<br />
“The Group Buying sector of online<br />
continues to see rapid decline, but<br />
we are bound to see other new<br />
online formats emerge in 2012.”<br />
Tony Davis, Quantium
Regional Western Australia<br />
strongly above average in per<br />
capita spending<br />
Regional Australia continues to record stronger<br />
growth rates for online spending than its<br />
metropolitan peers – resulting in a gradually<br />
diminishing distinction between the two groups on<br />
a per capita basis (chart 14). Metropolitan residents<br />
account for the majority of total spending – 71% in<br />
the year to October 2012 – but the per capita share<br />
for this period dipped to 102.3 points (compared<br />
with 102.5 points in July).<br />
Trends in the metropolitan/regional split remain<br />
divergent around the country – with the spending<br />
of regional WA continuing to increase – up to 126<br />
points (previously 123) – <strong>and</strong> regional spending<br />
outpacing metropolitan WA.<br />
In October 2012, regional sales increased by 30%<br />
year-on-year, compared with 25% year-on-year for<br />
metropolitan sales. Growth rates were higher in<br />
regional WA – at around 45% year-on-year (chart 15).<br />
Trends for the under 30s softer<br />
in WA – likely lacking mining<br />
revenue<br />
While growth in WA online spending has been<br />
considerably stronger than the national average,<br />
there have been notable divergences by age group<br />
(chart 16).<br />
Among the under 30s, there is relatively little<br />
distinction in the year-on-year growth rates over<br />
the last year between WA <strong>and</strong> the rest of the<br />
country. Under 30s in WA recorded average growth<br />
rates of 28% over the last year, against 23% for<br />
Australia excluding WA. On average, under 30s<br />
in WA are less likely to benefit from high mining<br />
incomes – either lacking the qualifications or<br />
experience of older age groups.<br />
Growth rates diverge with the other age groups, as<br />
the under 30s has the lowest growth rate in WA, but<br />
the highest overall for the rest of Australia. n<br />
Chart 14: Share of spending by region<br />
(year to October 2012)<br />
130<br />
120<br />
110<br />
100<br />
90<br />
80<br />
50<br />
40<br />
30<br />
20<br />
WA NSW* AUS QLD VIC Other<br />
Metro (per capita)<br />
Regional (per capita)<br />
Chart 15: Growth of spending by region<br />
(%, yoy)<br />
10<br />
Jan-11 Jul-11 Jan-12 Jul-12<br />
40<br />
30<br />
20<br />
10<br />
0<br />
Indepth report – October 2012<br />
*Note: Metropolitan NSW includes the ACT in this series.<br />
Metro Regional<br />
Chart 16: Average annual growth rate by<br />
age group (% yoy)<br />
To discuss this report in more detail please speak with your<br />
NAB Relationship Manager, visit nab.com.au/onlineretailsales or contact:<br />
Alan Oster<br />
Group Chief Economist<br />
National Australia Bank<br />
+61 (0) 3 8634 2927<br />
Alan.Oster@nab.com.au<br />
Important notice.<br />
Tiernan White<br />
<strong>Retail</strong> Sector Head & Head of<br />
NAB Corporate NSW/ACT<br />
+61 (0) 2 9237 1041<br />
Tiernan.White@nab.com.au<br />
DISCLAIMER: While care has been taken in preparing this material,] National Australia Bank Limited (ABN 12 004 044 937) does not warrant or represent that<br />
the information, recommendations, opinions or conclusions contained in this document (“Information”) are accurate, reliable, complete or current. The<br />
Information has been prepared for dissemination to professional investors for information purposes only <strong>and</strong> any statements as to past performance do not<br />
represent future performance. The Information does not purport to contain all matters relevant to any particular investment or financial instrument <strong>and</strong> all<br />
statements as to future matters are not guaranteed to be accurate. In all cases, anyone proposing to rely on or use the Information should independently<br />
verify <strong>and</strong> check the accuracy, completeness, reliability <strong>and</strong> suitability of the Information <strong>and</strong> should obtain independent <strong>and</strong> specific advice from appropriate<br />
professionals or experts.<br />
To the extent permissible by law, the National shall not be liable for any errors, omissions, defects or misrepresentations in the Information or for any loss<br />
or damage suffered by persons who use or rely on such Information (including by reasons of negligence, negligent misstatement or otherwise). If any law<br />
prohibits the exclusion of such liability, the National limits its liability to the re-supply of the Information, provided that such limitation is permitted by law<br />
<strong>and</strong> is fair <strong>and</strong> reasonable. The National, its affiliates <strong>and</strong> employees may hold a position or act as a price maker in the financial instruments of any issuer<br />
discussed within this document or act as an underwriter, placement agent, adviser or lender to such issuer.<br />
UK Disclaimer: So far as the law <strong>and</strong> the FSA Rules allow, National Australia Bank Limited (“the Bank”) disclaims any warranty or representation as to the<br />
accuracy or reliability of the information <strong>and</strong> statements in this document. The Bank will not be liable (whether in negligence or otherwise) for any loss<br />
or damage suffered from relying on this document. This document does not purport to contain all relevant information. Recipients should not rely on its<br />
contents but should make their own assessment <strong>and</strong> seek professional advice relevant to their circumstances. The Bank may have proprietary positions in<br />
the products described in this document. This document is for information purposes only, is not intended as an offer or solicitation nor is it the intention of<br />
the Bank to create legal relations on the basis of the information contained in it. No part of this document may be reproduced without the prior permission<br />
of the Bank. This document is intended for Investment Professionals (as such term is defined in The Financial Services <strong>and</strong> Markets Act 2000 (Financial<br />
Promotion) Order 2001) <strong>and</strong> should not be passed to any other person who would be defined as a private customer by the rules of the Financial Services<br />
Authority (“FSA”) in the UK or to any person who may not have experience of such matters. Issued by National Australia Bank Limited A.C.N. 004 044 937, 88<br />
Wood Street, London EC2V 7QQ. Registered in Engl<strong>and</strong> BR1924. Head Office: 500 Bourke Street, Melbourne, Victoria. Incorporated with limited liability in the<br />
state of Victoria, Australia. Regulated by the FSA in the UK.<br />
U.S DISCLAIMER: This information has been prepared by National Australia Bank Limited or one of its affiliates or subsidiaries (“NAB”). If it is distributed in<br />
the United States, such distribution is by nabSecurities, LLC which accepts responsibility for its contents. Any U.S. person receiving this information wishes<br />
further information or desires to effect transactions in any securities described herein should call or write to nabSecurities, LLC, 28th Floor, 245 Park Avenue,<br />
New York, NY 10167 (or call (877) 377-5480). The information contained herein has been obtained from, <strong>and</strong> any opinions herein are based upon, sources<br />
believed to be reliable <strong>and</strong> no guarantees, representations or warranties are made as to its accuracy, completeness or suitability for any purpose. Any opinions<br />
or estimates expressed in this information is our current opinion as of the date of this report <strong>and</strong> is subject to change without notice. The principals of<br />
nabSecurities, LLC or NAB may have a long or short position or may transact in the securities referred to herein or hold or transact derivative instruments,<br />
including options, warrants or rights with securities, or may act as a market maker in the securities discussed herein <strong>and</strong> may sell such securities to or buy<br />
from customers on a principal basis. This material is not intended as an offer or solicitation for the purchase or sale of the securities described herein or for<br />
any other action. It is intended for the information of clients only <strong>and</strong> is not for publication in the press or elsewhere.<br />
© 2012 National Australia Bank Limited ABN 12 004 044 937 AFSL <strong>and</strong> Australian Credit Licence 230686<br />
Tony Davis<br />
Director<br />
Quantium<br />
+61 (0) 2 9292 6400<br />
Tony.Davis@quantium.com.au<br />
About Quantium<br />
Quantium is Australia’s leading data analytics <strong>and</strong> marketing strategy firm. Quantium has worked<br />
with NAB for more than 4 years, assessing de-identified transaction data to derive insights, trends <strong>and</strong><br />
shopping habits of different customer groups. The resulting analysis forms Market Blueprint <strong>and</strong> is<br />
used by NAB <strong>and</strong> other businesses to drive innovation <strong>and</strong> business performance through customer,<br />
distribution <strong>and</strong> marketing strategies. www.quantium.com.au