Nab Online Retail Sales Index - Business Research and Insights ...
Nab Online Retail Sales Index - Business Research and Insights ...
Nab Online Retail Sales Index - Business Research and Insights ...

You also want an ePaper? Increase the reach of your titles
YUMPU automatically turns print PDFs into web optimized ePapers that Google loves.
NAB <strong>Online</strong> <strong>Retail</strong> <strong>Sales</strong> <strong>Index</strong><br />
6<br />
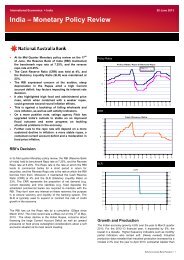
Chart 12: Share of spending by state<br />
(year to October 2012)<br />
40<br />
30<br />
20<br />
10<br />
0<br />
NSW<br />
VIC<br />
QLD<br />
WA<br />
SA<br />
TAS<br />
ACT<br />
NT<br />
NSW<br />
VIC<br />
QLD<br />
WA<br />
SA<br />
TAS<br />
ACT<br />
NT<br />
Share of spend (%) Per capita (index)<br />
Chart 13: Growth of spending by state<br />
(%, yoy)<br />
40<br />
30<br />
20<br />
10<br />
0<br />
Nov-11 Apr-12 Sep-12<br />
WA NT QLD SA<br />
Chart 13B: Growth of spending by state<br />
(%, yoy)<br />
40<br />
30<br />
20<br />
10<br />
0<br />
Nov-11 Apr-12 Sep-12<br />
VIC NSW TAS ACT<br />
140<br />
120<br />
100<br />
80<br />
60<br />
Per capita spending remains<br />
dominated by the 30s <strong>and</strong> 40s<br />
The share of spending by age group has<br />
remained quite stable since we commenced tracking<br />
online retail sales. In an absolute sense, those in their<br />
40s <strong>and</strong> younger account for the majority of sales – at<br />
around 23% for each group in the year to October<br />
2012 (chart 10). However, on a per capita basis, the<br />
bulk of spending is recorded among those in their 30s<br />
<strong>and</strong> 40s – with the under 30s age group recording<br />
below average spending – likely a reflection of their<br />
relative lack of purchasing power.<br />
Compared with some notable divergence in growth<br />
rates in 2011, trends in growth rates by age group have<br />
been much more uniform over the last year – although<br />
the under 30s have recorded marginally stronger<br />
growth rates than other age groups for much of this<br />
time (chart 11).<br />
Per capita spending strongest<br />
in the ACT, NT <strong>and</strong> WA<br />
At a state level, online spending is dominated by the<br />
largest states – with New South Wales (NSW), Victoria<br />
(VIC) <strong>and</strong> Queensl<strong>and</strong> (QLD) accounting for 76% of<br />
total online retail spending (chart 12). However, on<br />
a per capita basis, the ACT has the strongest level of<br />
spending, followed by the Northern Territory (NT) <strong>and</strong><br />
Western Australia (WA).<br />
Growth trends for NSW, VIC, South Australia (SA) <strong>and</strong><br />
the ACT have been relatively uniform in 2012 – <strong>and</strong><br />
in line with the national average (chart 13). Generally,<br />
growth has been marginally stronger in QLD <strong>and</strong> also<br />
stronger than average in the NT – although these<br />
rates have been highly volatile, due in part to the<br />
small population. In terms of growth, WA continues to<br />
outperform the bulk of the country – at 36% year-onyear<br />
in October.<br />
“The Group Buying sector of online<br />
continues to see rapid decline, but<br />
we are bound to see other new<br />
online formats emerge in 2012.”<br />
Tony Davis, Quantium