Performance Modeling and Benchmarking of Event-Based ... - DVS
Performance Modeling and Benchmarking of Event-Based ... - DVS
Performance Modeling and Benchmarking of Event-Based ... - DVS

You also want an ePaper? Increase the reach of your titles
YUMPU automatically turns print PDFs into web optimized ePapers that Google loves.
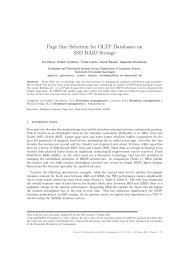
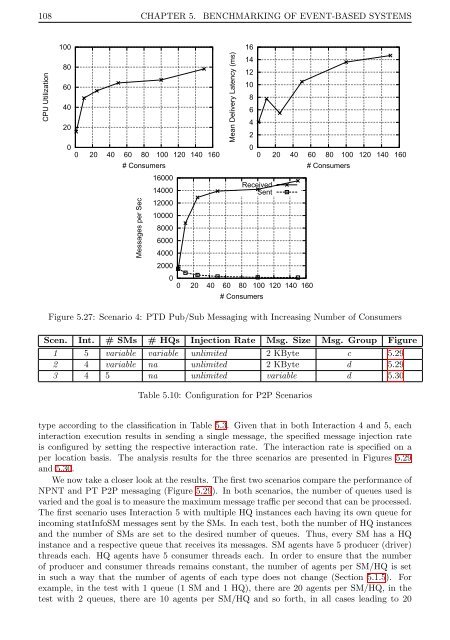
108 CHAPTER 5. BENCHMARKING OF EVENT-BASED SYSTEMS<br />
CPU Utilization<br />
100<br />
80<br />
60<br />
40<br />
20<br />
0<br />
0 20 40 60 80 100 120 140 160<br />
# Consumers<br />
Messages per Sec<br />
16000<br />
14000<br />
12000<br />
10000<br />
8000<br />
6000<br />
4000<br />
2000<br />
Mean Delivery Latency (ms)<br />
16<br />
14<br />
12<br />
10<br />
0<br />
0 20 40 60 80 100 120 140 160<br />
8<br />
6<br />
4<br />
2<br />
# Consumers<br />
0<br />
0 20 40 60 80 100 120 140 160<br />
Received<br />
Sent<br />
# Consumers<br />
Figure 5.27: Scenario 4: PTD Pub/Sub Messaging with Increasing Number <strong>of</strong> Consumers<br />
Scen. Int. # SMs # HQs Injection Rate Msg. Size Msg. Group Figure<br />
1 5 variable variable unlimited 2 KByte c 5.29<br />
2 4 variable na unlimited 2 KByte d 5.29<br />
3 4 5 na unlimited variable d 5.30<br />
Table 5.10: Configuration for P2P Scenarios<br />
type according to the classification in Table 5.3. Given that in both Interaction 4 <strong>and</strong> 5, each<br />
interaction execution results in sending a single message, the specified message injection rate<br />
is configured by setting the respective interaction rate. The interaction rate is specified on a<br />
per location basis. The analysis results for the three scenarios are presented in Figures 5.29<br />
<strong>and</strong> 5.30.<br />
We now take a closer look at the results. The first two scenarios compare the performance <strong>of</strong><br />
NPNT <strong>and</strong> PT P2P messaging (Figure 5.29). In both scenarios, the number <strong>of</strong> queues used is<br />
varied <strong>and</strong> the goal is to measure the maximum message traffic per second that can be processed.<br />
The first scenario uses Interaction 5 with multiple HQ instances each having its own queue for<br />
incoming statInfoSM messages sent by the SMs. In each test, both the number <strong>of</strong> HQ instances<br />
<strong>and</strong> the number <strong>of</strong> SMs are set to the desired number <strong>of</strong> queues. Thus, every SM has a HQ<br />
instance <strong>and</strong> a respective queue that receives its messages. SM agents have 5 producer (driver)<br />
threads each. HQ agents have 5 consumer threads each. In order to ensure that the number<br />
<strong>of</strong> producer <strong>and</strong> consumer threads remains constant, the number <strong>of</strong> agents per SM/HQ is set<br />
in such a way that the number <strong>of</strong> agents <strong>of</strong> each type does not change (Section 5.1.5). For<br />
example, in the test with 1 queue (1 SM <strong>and</strong> 1 HQ), there are 20 agents per SM/HQ, in the<br />
test with 2 queues, there are 10 agents per SM/HQ <strong>and</strong> so forth, in all cases leading to 20