Performance Modeling and Benchmarking of Event-Based ... - DVS
Performance Modeling and Benchmarking of Event-Based ... - DVS
Performance Modeling and Benchmarking of Event-Based ... - DVS

You also want an ePaper? Increase the reach of your titles
YUMPU automatically turns print PDFs into web optimized ePapers that Google loves.
120 CHAPTER 6. PERFORMANCE MODELING OF EBS - CASE STUDIES<br />
6<br />
%URNHU<br />
%URNHU<br />
6<br />
6<br />
3<br />
%URNHU<br />
%URNHU<br />
6<br />
6<br />
3<br />
%URNHU<br />
%URNHU<br />
6<br />
6<br />
3<br />
%URNHU<br />
%URNHU<br />
6<br />
6<br />
3<br />
%URNHU<br />
%URNHU<br />
3<br />
6<br />
6<br />
%URNHU<br />
%URNHU<br />
3<br />
6<br />
6<br />
%URNHU<br />
%URNHU<br />
3<br />
6<br />
6<br />
%URNHU<br />
3<br />
6<br />
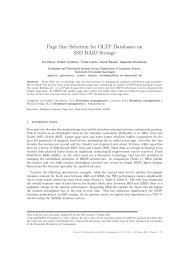
Figure 6.1: Broker Topology<br />
6.1.2 Setup<br />
We have implemented the dissemination <strong>of</strong> requests for quotes using the SIENA publish/subscribe<br />
system [40] enhanced with self-monitoring functionality. We instrumented the system to monitor<br />
<strong>and</strong> collect the event publication rates <strong>and</strong> routing probabilities needed for characterizing<br />
the workload. We implemented an interaction based on the SPECjms2007 scenario <strong>and</strong> used<br />
one <strong>of</strong> its message schemas (see Appendix ).<br />
We used a hierarchical topology with 15 brokers, 8 publishers <strong>and</strong> 16 subscribers. Brokers<br />
were communicating via a Gigabit LAN. The deployment topology is depicted in Figure 6.1.<br />
6.1.3 Experimental Results<br />
Following our methodology presented in the Section 4.1, we first characterized the workload<br />
<strong>and</strong> then built a QPN model <strong>of</strong> the system <strong>and</strong> used it to predict the system performance<br />
under load. Given that the network utilization was very low, it was omitted from the model,<br />
assuming that the network service times did not have any significant impact on the overall<br />
system performance. We employed the QPME tool (Queueing Petrinet <strong>Modeling</strong> Environment)<br />
to build <strong>and</strong> analyze the model. We considered a number <strong>of</strong> workload <strong>and</strong> configuration scenarios<br />
varying the publication rates <strong>and</strong> the system topology. Tables 6.1 <strong>and</strong> 6.2 show the results for<br />
two <strong>of</strong> the scenarios we analyzed. The broker throughput <strong>and</strong> the event delivery latency for a<br />
r<strong>and</strong>omly selected subscriber are shown. As we can see, the predictions are pretty accurate <strong>and</strong><br />
reflect the real system behavior. The results for the rest <strong>of</strong> the subscribers as well as for the<br />
other scenarios we considered were <strong>of</strong> similar accuracy to the ones presented here. The model<br />
analysis was conducted using SimQPN [127] <strong>and</strong> took less than two minutes on st<strong>and</strong>ard PC<br />
hardware.